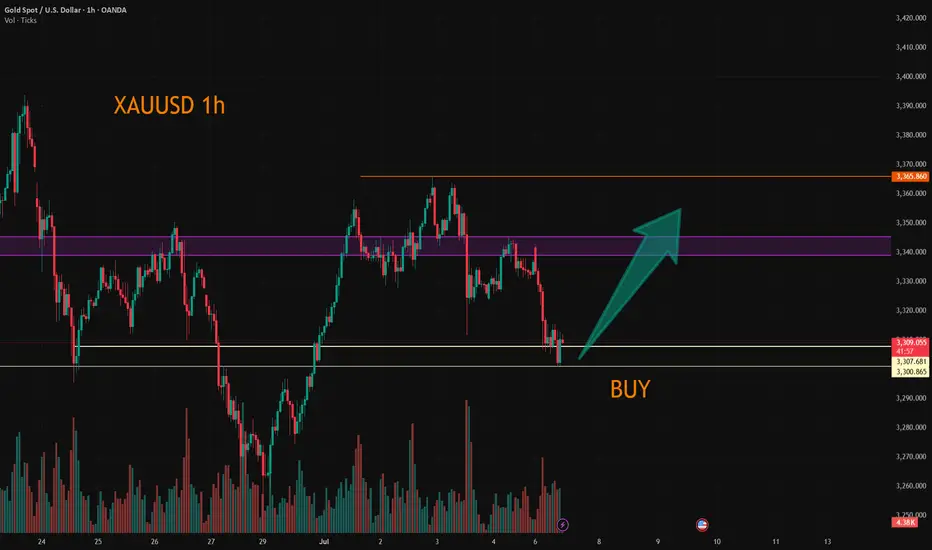
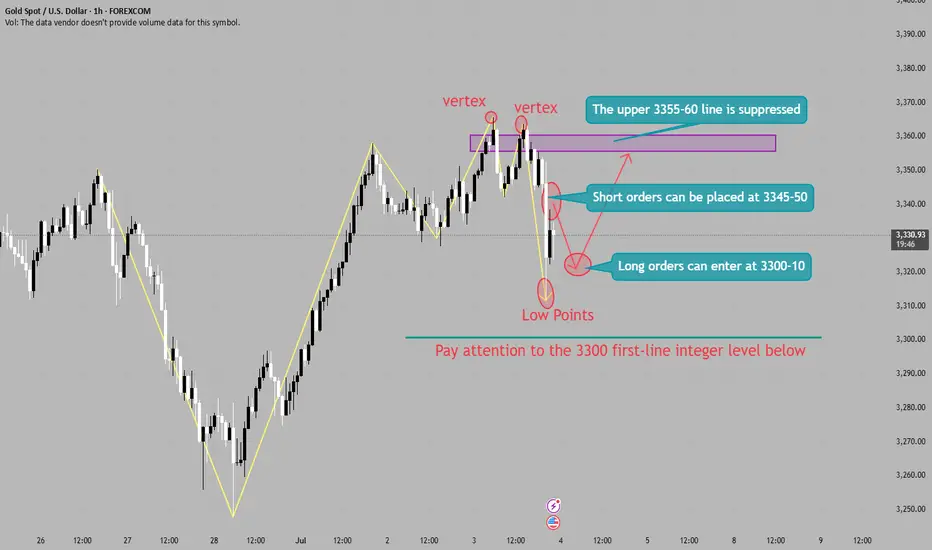
XAUUSD:Go long
Gold prices fell back in Asian trading on Monday, as they digested Friday's negative data. The short term may be partial shock, but the medium and long term news surface uncertainty or to provide support for gold prices, so trading ideas, retracement to do long can.
Trading Strategy:
Both 3300 and 3308 can be used to enter the long position, short-term traders can look at 3325-30, followed by 50 around.
For intermediate traders, the target sees 3365-70 unchanged, and the retracting of 3300/3310/3330 is an opportunity to go long.
More detailed strategies and trading will be notified here ↗↗↗
Keep updated, come to "get" ↗↗↗
Xauusdidea
#XAUUSD: Early Mitigation Or Sellers Trap! Let's See Gold dropped after touching 3365 taking price to 3318.Currently ranging market showing confusion over how gold would react to NFP data which is coming out tomorrow. At this moment we are quite certain that price would drop tomorrow either from entry one or entry two. Please use accurate risk management while trading.
Good luck and trade!
Team Setupsfx_
Trade Breakdown: XAUUSD 15-Min | Liquidity Grab + Reversal PlayOANDA:XAUUSD
Psychological Setup
This trade is rooted in the psychology of smart money and retail behavior. After a sharp drop in price, most retail traders expect continuation (trend-following). However, institutions often manipulate liquidity zones — hunting for stop-losses before a true reversal. This trade capitalizes on that behavior.
🔍 Technical Explanation:
🔻 1. Market Structure:
Price was previously in a downtrend, forming lower highs and lower lows.
A falling wedge pattern (red lines) formed after a strong bearish move, signaling potential bullish reversal.
Price broke the wedge to the upside — a classic reversal signal.
🔁 2. Liquidity Concept:
Below the wedge: The market grabbed liquidity by taking out stop losses of buyers who entered too early.
Above the wedge (TP Areas):
TP 1 Area (red box): This is the first logical resistance where previous supply sits — many sellers will enter here, providing buy-side liquidity.
Next Target Liquidity (grey box above): This is a major imbalance zone and likely where stop-losses of early short sellers are stacked.
Price is expected to grab liquidity from that area (marked by the red arrow).
✅ Entry & Trade Logic:
Entry Zone: After liquidity was swept at the bottom of the wedge, a bullish engulfing candle formed near demand — signaling institutional interest.
Risk-Reward Setup:
Targeting 0.80% move (approx. 26.48 points).
Trade is based on reversal from demand zone + wedge breakout + liquidity grab confirmation.
🎯 Target Projections:
TP1 Area: Conservative target, just above recent structure.
Final Target: High-probability liquidity zone where market is drawn to clean up resting orders (grey zone).
🧠 Why This Trade Matters (Trading Psychology Insight):
Most retail traders get trapped in emotional entries — entering shorts after a drop or longs too early in a wedge.
Smart money waits for liquidity sweeps before moving price in the desired direction.
This setup shows the importance of patience, structure, and understanding market psychology rather than reacting emotionally to price action.
📌 Key Takeaways:
📉 Trap: Falling wedge builds false bearish confidence.
🧠 Psychology: Stop hunts create fuel for reversal.
📈 Reaction: Smart money absorbs liquidity, moves price toward next inefficiency.
Hashtags:
#XAUUSD #SmartMoney #LiquidityHunt #TradingPsychology #GoldTrade #PriceAction #WedgeBreakout #FXOpen #TechnicalAnalysis #SupplyDemand

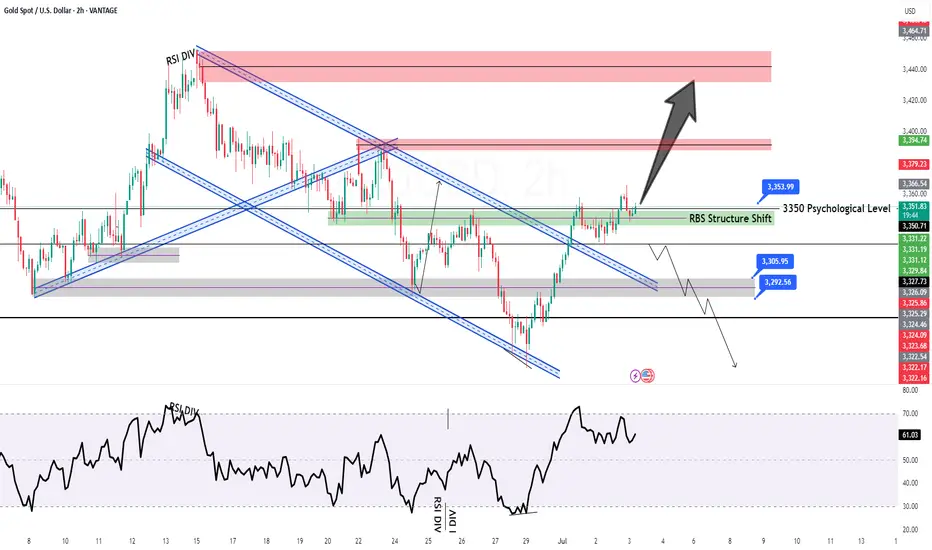
GOLD H2 Intraday Chart Update For 7 July 2025Welcome to the new week traders
as we have FOMC meeting minutes report due this week so firs market is fell down from 3350 Psychological level now is testing 3300 psychological level
all eyes on breakout of 3300 level for now if market breaks 3300 level then it will move towards 3280 then 3350
only clear breakout of 3335 will clear path for towards 3368 level
Disclaimer: Forex is Risky

Elliott Wave Analysis – XAUUSD – June 8, 2025🌀 Elliott Wave Structure Timeframe: H4
Currently, price action is overlapping with multiple abc correction patterns. To reduce noise and gain a clearer perspective, I’ve shifted the analysis to the H4 timeframe.
From the 3500 level down to now, the entire corrective move has been composed of overlapping abc patterns rather than sharp, impulsive rallies. This suggests we are likely forming a contracting triangle correction in the form of abcde (green) as shown on the chart.
At the moment, price appears to be in wave d (green), which is unfolding as a wxy structure (red).
Trading during triangle corrections is particularly challenging due to the complex interweaving of corrective waves. Additionally, price is consolidating within the Volume Profile’s high-liquidity zone, as shown on the chart. Therefore, it is best to remain patient and wait for the triangle pattern to complete.
📉 Momentum
Daily (D1) momentum: Currently showing signs of a bearish reversal → suggesting that price may move sideways or lower this week. (Toward the end of a triangle, price tends to compress and lose clear directional bias.)
H4 momentum: Also shows reversal signals, and a strong bearish candle has recently formed. Thus, a short-term bearish bias is preferred until H4 momentum reaches the oversold region.
🎯 Price Targets
Since the market is currently forming overlapping abc structures, setting precise wave targets is difficult. Therefore, I rely on Volume Profile zones to define key levels:
3342 Resistance Zone: Marks the boundary between high and low liquidity areas → This is a Sell Zone, supported by confluence with D1 and H4 momentum signals.
3294 Support Zone: Represents the lower boundary of high liquidity → This is the projected end of wave X (red) and serves as our Buy Zone.
🧭 Trade Plan
🔻 Sell Zone:
Entry: 3340 – 3342
SL: 3350
TP1: 3320
TP2: 3300
🔺 Buy Zone:
Entry: 3295 – 3293
SL: 3285
TP1: 3312
TP2: 3342
TP3: 3390
📌 Personal Note:
At this stage, I prefer to wait for the abcde triangle to complete or for more structural confirmation. If you decide to trade, focus on short-term setups with reduced position size to manage risk during this complex correction phase.

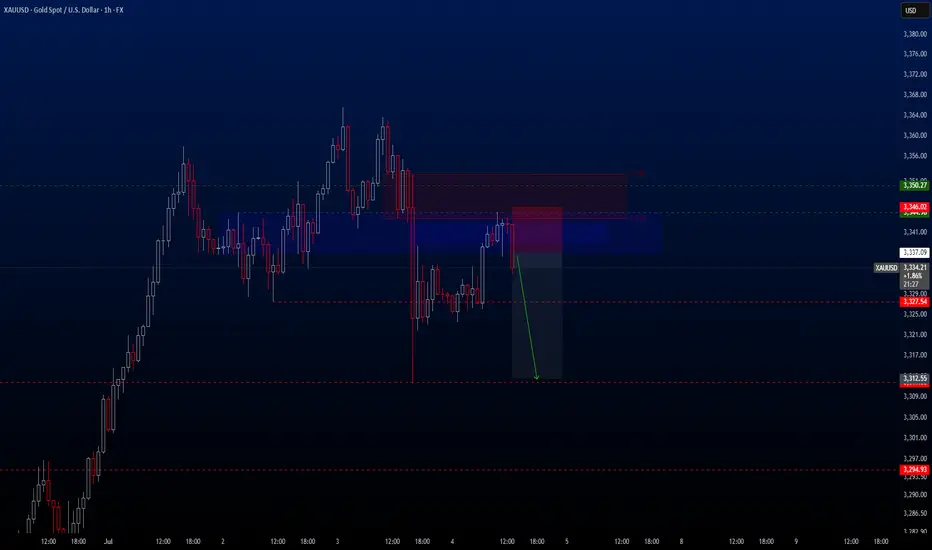
XAUUSD – High-Precision Sell Setup with 1:2.70 R/RGreetings, traders.
After a brief tactical pause, we’ve identified a **high-conviction short setup** on **XAUUSD**.
Despite the U.S. Independence Day holiday, structural momentum suggests there’s still room for meaningful movement in gold during today’s session. The risk-to-reward profile on this setup is exceptional — clocking in at **1:8.70**, it meets our highest-tier execution standards.
If momentum stalls or price consolidates excessively, the trade will be manually closed by **23:00 (UTC+4)**, regardless of outcome.
🧠 Trade Parameters:
• **Timeframe:** 1-Hour (H1)
• **Direction:** Sell
• **Entry:** 3337.09
• **Take Profit:** 3312.16
• **Stop Loss:** 3345.63
• **Risk/Reward Ratio:** 1:2,70
• **Trade Management Note:** Will be closed manually by 23:00 (UTC+4) if momentum conditions are not met.
🔗 Signal Source
All trade setups are published directly by Velatrix Capital — a high-discipline trading desk focused on FX, crypto, and global indices.
No opinions. No hype. Just statistically-grounded execution.
All signals are posted via our TradingView desk:
👉 (www.tradingview.com)
📈 **We don’t chase hype. We build edge.**
🔔 **Subscribe for future setups and institutional-grade trade intelligence.**
**Velatrix Capital**

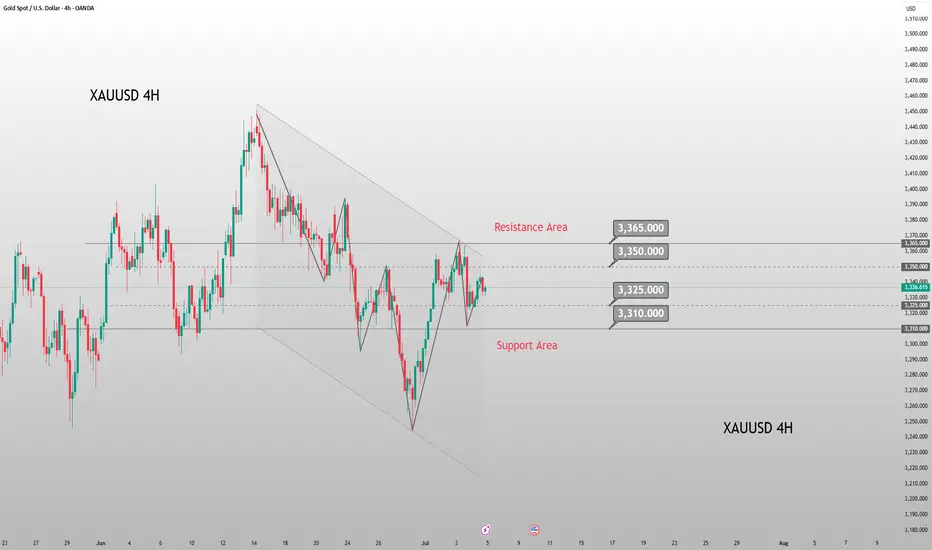
Consolidating Below Trendline Resistance, Bearish Bias IntactTechnical Structure:
OANDA:XAUUSD Gold (XAU/USD) continues to trade below the descending trendline TL1, having failed multiple times to breach the $3,338–$3,345 resistance zone. After retesting Support Zone 1 ($3,303–$3,310), the price is showing signs of a short-term bounce. However, the broader structure remains bearish unless the price can break above TL1.
Key Technical Levels:
Resistance Zone: $3,338 – $3,345
Support Zone 1: $3,303 – $3,310
Support Zone 2: $3,260 – $3,253
Trendline: TL1 continues to act as dynamic resistance
Strategy Insight:
If TVC:GOLD gold remains below the descending TL1, bearish pressure is likely to resume. A short opportunity may arise if the price retests the resistance area and stalls. A confirmed break below Support Zone 1 would expose targets at $3,260 and $3,253.
Disclaimer:
This analysis is for educational purposes only and does not constitute investment advice. Please consult a qualified financial advisor before making trading decisions.

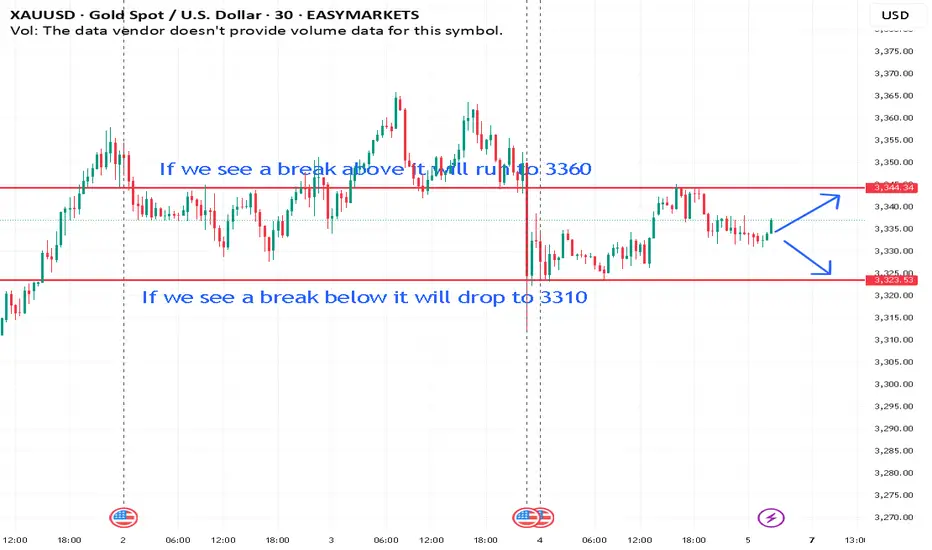
Current outlook for XAUUSD for the july 7th -11th 2025Support and resistance tells us to watch for price action around $3325 - $3345. Either a possible short at 3345 if rejected, or possible further downside if it breaks below 3325.
XAUUSD | 30m | Weekly Open Outlook Published by Mohsen Mozafari## 📍 XAUUSD | 30m | Weekly Open Outlook
⏱️ *Published by Mohsen Mozafarinejad*
---
### 🔍 Market Structure:
The market currently shows a **bearish structure**.
After a recent **BOS (Break of Structure)** near the 3344 zone, price retraced to mitigate unfilled sell orders within the **Extreme Supply OB (TLQ)**.
---
### 🔸 Key Observations:
- Price is reacting from a clear **supply zone (TLQ)** following BOS.
- The move appears to have cleared liquidity from late long entries.
- OB efficiency remains intact, indicating healthy market flow.
---
### 🧭 Scenario A – Short Bias
> If price consolidates or rejects below the 3340 level, a **high-probability short** may form.
🎯 Target: **Demand OB at 3295**
🚫 Invalidation: **Break & close above 3354 (last HH)**
---
### 🧭 Scenario B – Fakeout & V-Shape Reversal
> If price sweeps above TLQ but loses momentum, it could trap buyers and sharply reverse below BOS.
This would signal potential **seller exhaustion**.
---
### ⚙️ Technical Summary:
- **Structure:** Bearish 🔻
- **Efficiency:** Efficient ✅
- **MSU & VTA levels:** Valid for lower timeframe confirmations
- **Momentum:** Controlled pullback detected
---
> 📌 *"Precision beats prediction. Let the chart speak before you act."*
---
#### 🔖 Hashtags:
#XAUUSD #SmartMoney #SupplyDemand #OB #BOS #ScalpingGold #ForexAnalysis #MohsenMozafarinejad

Gold lacks downside momentum: Next week's analysis & adviceGold trading is relatively light today due to the U.S. Independence Day holiday. On the downside, we continue to focus on the short-term support at the 3325 level, while the key resistance above remains in the 3345-3350 range, which was yesterday's breakdown point. The market has closed early today, and price action has been stuck in a range-bound consolidation.
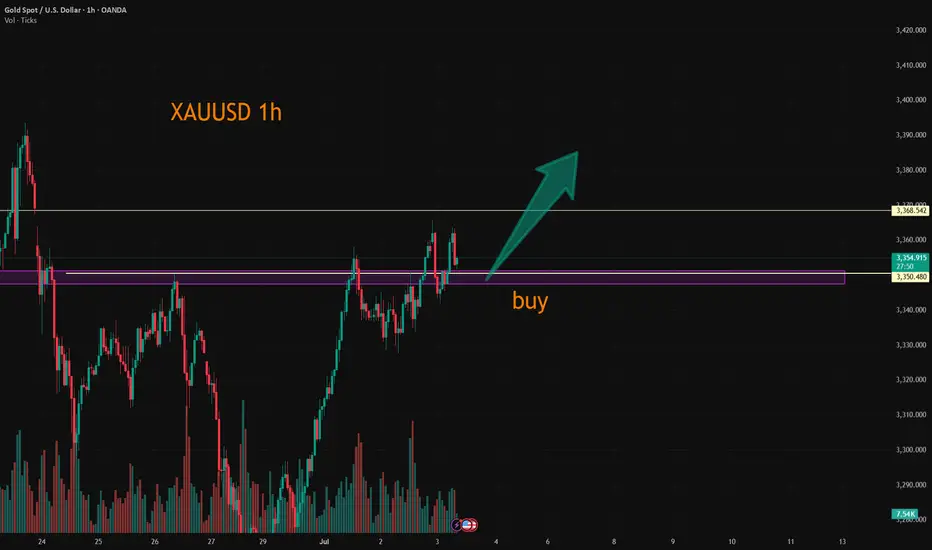
After plunging $40 on the back of bearish non-farm payroll data, gold stabilized and rebounded, recouping nearly half of the losses. This performance confirms that the downside space is limited. Currently, the market has returned to a oscillating upward pattern, and the weekly chart is likely to continue range-bound fluctuations. From a technical perspective, the 3325 level has formed a key support. The secondary retest overnight confirmed the bottom structure, and the gradual lifting of early session lows has also released a bullish signal. Looking ahead to next week, gold is expected to continue its bullish trend. If the 3325 support level below remains unbroken, one can look for opportunities to establish long positions.
XAUUSD
buy@3325-3330
tp:3340-3360-3380
Investment itself is not the source of risk; it is only when investment behavior escapes rational control that risks lie in wait. In the trading process, always bear in mind that restraining impulsiveness is the primary criterion for success. I share trading signals daily, and all signals have been accurate without error for a full month. Regardless of your past profits or losses, with my assistance, you have the hope to achieve a breakthrough in your investment.
GOLD Massive Bullish Breakout!
HI,Traders !
#GOLD is trading in a strong
Uptrend and the price just
Made a massive bullish
Breakout of the falling
Resistance line and the
Breakout is confirmed
So after a potential pullback
We will be expecting a
Further bullish continuation !
Comment and subscribe to help us grow !

Important data such as non-agricultural are all negativeGold hourly chart;
Gold short-term analysis; Gold 4-hour analysis shows that the stochastic indicator is golden cross, which is a bullish signal; MACD indicator double lines stick together upward, which is a bullish signal; 4-hour bias continues to rise; 4-hour downward trend channel is temporarily suppressed, and the pressure position is around 3355-60.
XAUUSDHello traders. After a short break, we’ve identified a promising sell opportunity on the XAUUSD pair.
Despite the U.S. Independence Day holiday, I believe we may still see solid movement in gold during today's session.
🔍 Trade Details
✔️ Timeframe: 1-Hour (H1)
✔️ Risk-to-Reward Ratio: 1:2.70
✔️ Trade Direction: Sell
✔️ Entry Price: 3337.09
✔️ Take Profit: 3312.16
✔️ Stop Loss: 3345.63
🕒 If momentum fades or the price consolidates in a tight range, I will keep this trade open only until 23:00 (UTC+4). After that, I’ll close it manually—whether in profit or loss—depending on how price action evolves.
🔔 Disclaimer: This is not financial advice. I’m simply sharing a trade I’ve taken based on my personal trading system, strictly for educational and illustrative purposes.
📌 Interested in a systematic, data-driven trading approach?
💡 Follow the page and turn on notifications to stay updated on future trade setups and advanced market insights.
Gold AnalysisI am seeing gold for a bearish move as it shifts its direction i am taking a short position from marked zone you guys can manage your risk accordingly

Elliott Wave Analysis – XAUUSD, March 7, 2025🌀 Elliott Wave Structure
On the H1 chart, wave 3 appears to have completed, and price is now entering a phase with an unusual structural behavior.
Wave 3 previously showed strong momentum, moving steeply and continuously, with no clear internal pullbacks – a classic impulse wave. Following this, we observed a corrective abc pattern in black, suggesting the end of wave 3.
Interestingly, although yesterday's ADP report was extremely bullish, gold only managed a mild breakout above the wave 3 high before pulling back this morning. Notably, the upward move followed a 3-wave abc structure in green, and price action is now showing overlapping waves with no clear directional momentum.
🧩 These signs suggest a high probability that:
🔹 Wave 5 is forming as an Ending Diagonal – a 5-wave structure with a 3-3-3-3-3 pattern.
🔹 This is typically seen at the end of a bullish cycle and often precedes a sharp reversal.
Although it's too early to confirm, we should patiently observe the upcoming price action. If the ending diagonal completes, it may present a strong sell opportunity.
🎯 Target for wave 5: around 3395, provided all 5 sub-waves within the diagonal complete.
⚠️ If price breaks below 3324, we must consider that the full 5-wave structure is already done, and a new abc corrective phase may have begun.
🔍 Momentum Analysis
Daily (D1): Momentum is about to turn bearish from overbought territory → suggests a weakening uptrend.
H4: Momentum is turning upward → likely a mild rally or sideways movement today before H4 reaches overbought again.
📌 Trading Plan
Given the current wave behavior and overlapping structure, it is best to remain patient and wait for confirmation before taking a strong position. If the Ending Diagonal structure is confirmed, it could signal a major reversal.
SELL Zone: 3392 – 3395
Stop Loss: 3403
Take Profits:
• TP1: 3368
• TP2: 3340
• TP3: 3324

XAUUSD:A long trading strategy
The highest gold price in the Asian session reached 3365.4, which is already our mid-line target range. If you have completed and left the market, congratulations, because I personally set the TP point of 3368, so it did not touch, the trend of the past two days is appropriate rewithdrawal after strengthening, the high is also gradually rising, the overall long trend has not changed. For today's data, the probability will make gold prices continue to rise, trading ideas or to do the main.
Trading Strategy:
BUY@3347-51
TP:3365-70
This TP range is also the target range of the median trader, for friends who do not have automatic stop profit, you can take a profit manually at that time.
More detailed strategies and trading will be notified here ↗↗↗
Keep updated, come to "get" ↗↗↗
Who will be the winner in the battle between bulls and bears?From the analysis point of view, the short-term resistance above is around 3295-3301, and the pressure at 3315-3316. Focus on the pressure at 3324, the long-short watershed. In terms of operation, the rebound will continue to be the main short and look for a decline. The short-term support below is around 3250-3255. Relying on this range, the main tone of high-altitude participation remains unchanged.

XAUUSD:Today's Trading Strategy
Gold retreated in the sub-session, I have personally increased my long position near 3331, the overall trend is bullish unchanged, the median strategy is patient to rise. If you are trading short, you can go long at 3325-3330 and leave at 3340-45. The same can be said if you want to solve the problem; Trade according to your trading preferences and risk tolerance.
More detailed strategies and trading will be notified here ↗↗↗
Keep updated, come to "get" ↗↗↗

GOLD H2 Intraday Chart Update For 3 July 2025Hello Traders,
Main event of is day NFP and all eyes on 3400 Psychological for now, right now market sustains around 3350 Psychological level for downward move GOLD still need to break 3324 level in order to go further down above 3324 LEVEL GOLD is still remains Bullish
Remember: It's NFP day
Disclaimer: Forex is Risky
#XAUUSD: +2000 Swing Sell In Making! Get ReadyGold has dropped to the 3330 region but has now reversed and is currently trading at 3350. The next potential move could be at 3380, followed by 3400. Our sell entry is at 3400, where we believe the price will reverse. Our long-term view is that gold will head towards 3100, but our first target will be 3200. Please use accurate risk management when trading gold, as it can cause serious financial issues if not planned properly. This analysis does not guarantee any price movement.
Good luck and trade safely!
Team Setupsfx!

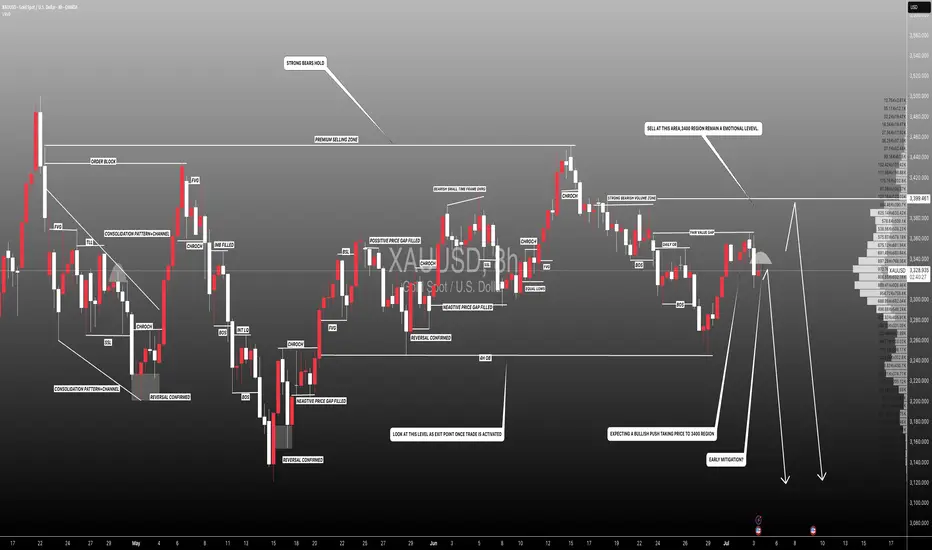
Mozafari Nejad ### Multi-Timeframe Analysis: 15min + 30min + 2# XAU/USD | Gold Market Outlook by Mohsen Mozafari Nejad
### Multi-Timeframe Analysis: 15min + 30min + 2h | July 2–3, 2025
---
## 🔍 Technical Overview:
| Timeframe | Structure | Efficiency | Context |
|-----------|-----------|------------|---------|
| 15min | Bullish ✅ | Efficient ✅ | Reverse H&S complete – price entering neckline zone |
| 30min | Bullish ✅ | Inefficient ❌ | Clean BOS – ready for potential continuation |
| 2H | Bullish ✅ | Inefficient ❌ | HL confirmed – clear bullish delivery range ahead |
---
## 🧠 Key Insights:
- **Left Shoulder - Head - Right Shoulder** clearly visible and now validated with neckline break
- Price is reacting from **last TLQ + ILQ zones** with MSU
- Strong **liquidity gap** above 3,380–3,405 likely to be targeted
- **Highs around 3,420–3,440** may act as liquidity magnet if clean break happens
- **BOS and CHoCH** confirmed across all LTFs — strong bullish intent
- Structure remains **bullish** as long as 3,312–3,320 HL holds
---
## 🎯 Price Zones to Watch:
| Zone | Action |
|--------------|----------------|
| 3,335–3,340 | OB Flip Support / Demand (Retest Possible) |
| 3,368–3,375 | Reaction Zone / Short-Term Take Profit |
| 3,404–3,420 | Major Liquidity Above / SH Grab |
| 3,428–3,440+ | Stop-Hunt Potential for Final Exit |
---
## 📌 Trade Scenarios:
### 🟢 Long Setup
- **Entry:** 3,340–3,348 (OB retest or continuation)
- **SL:** below 3,328
- **TP1:** 3,375
- **TP2:** 3,400
- **TP3:** 3,420+
### 🔴 Caution for Short
Only valid if price shows **CHoCH + strong rejection** from above 3,420–3,440.
Otherwise, trend continuation is dominant.
---
## 🧭 Summary:
> Gold continues its bullish structure in all LTFs.
> Reverse H&S has broken neckline cleanly.
> Momentum + inefficiency zones above = clear drive to liquidity.
> Patience is key – reentry on OB retest = high R/R setup.
---
🖋️ Prepared by: **Mohsen Mozafari Nejad**
*Smart Money | Liquidity Zones | Order Blocks | MSU/MSD Framework*

Elliott Wave Analysis – XAUUSD | February 7, 2025🌀 Elliott Wave Structure (H1 Timeframe)
Looking at the current price structure, we can see that the price is moving sharply and steeply—this suggests the formation of a 5-wave impulsive structure.
Specifically:
- Waves 1, 2, and 3 (green) appear to have completed.
- Currently, wave 4 is forming as a 3-wave corrective structure (abc in black).
- Once wave 4 completes, we anticipate the next upward move as wave 5, which will complete the full 5-wave cycle (green).
🎯 Potential Price Targets for Wave 4
Based on the structure of the abc correction and support zones, we identify two key target areas:
+ Target 1: 3324
+ Target 2: 3311
When the price breaks above the top of wave b (black), it will serve as a strong confirmation that wave 4 has ended and wave 5 is beginning.
📈 Momentum Analysis
Daily (D1): Momentum is still rising and likely needs 2–3 more days to enter the overbought zone, supporting the continuation of the uptrend.
H4: Momentum is about to turn upward, signaling wave 4 may be nearing completion.
H1: Momentum is also preparing to turn up, suggesting the price is approaching the end of the wave 4 correction zone.
💼 Trading Plan
BUY ZONE: 3325 – 3322
STOP LOSS: 3215
TAKE PROFIT 1: 3345
TAKE PROFIT 2: 3368
TAKE PROFIT 3: 3395
📌 Wait for H1–H4 momentum alignment before triggering a BUY entry for wave 5.

gold on sell retrace#XAUUSD still on sell reverse, between 3347-3348 holds sell reverse. But if current H1 closes above 53 then bullish starts.
Sell limit 3347-3348, target 3320, stop loss 3356.
Above 3353 have bullish on H1 closure, target 3370
