GOLD Breakout Done , Long Setup Valid To Get 150 Pips !Here is My 15 Mins Gold Chart , and here is my opinion , we finally above 3350.00 and we have a 30 Mins Candle closure above it And Perfect Breakout , so i`m waiting the price to go back and retest this res and new support and give me a good bullish price action to can enter a buy trade and we can targeting 100 to 150 pips .
Reasons To Enter :
1- New Support Created .
2- Bullish Price Action .
3- Bigger T.F Giving Good Bullish P.A .
4- Clean Breakout .
Xauusdlong

XAUUSD Gold move 5 Aug 2025Price is currently reacting off a key 15-minute demand zone between 3352 and 3355, which has previously acted as a strong support level. Bullish rejection wicks within this area suggest buying interest and a possible short-term reversal.
The bias is bullish for a retracement move. A potential long opportunity exists from the 3352–3355 support zone, targeting the 3370 area, which aligns with a previous 15-minute supply zone and breakdown origin.
This setup is based on the expectation of a retracement toward 3370 before any further downside continuation. A clean break and close below 3352 would invalidate the idea and suggest continuation lower.
Confirmation through bullish price action within the zone is advised before execution.

Next movement is so critical The next movement of the gold will make the last decision , 1h fram above the 3352 will make the next target 3360/3380/3400
Be careful and chill !
Breaking the 3348 may see rejection on 3344 3340 as said in the morning ! Will follow up with it

XAUUSD Critical movement !!!The 3351 4h frame was so critical as I said and showed the movement will make the decision.
Flying now with
tp : 3385
tp:3400
tp : 3413
Better wait for another confirmation on the breaker block 3370 closing above it with green candle . push the price higher as showed

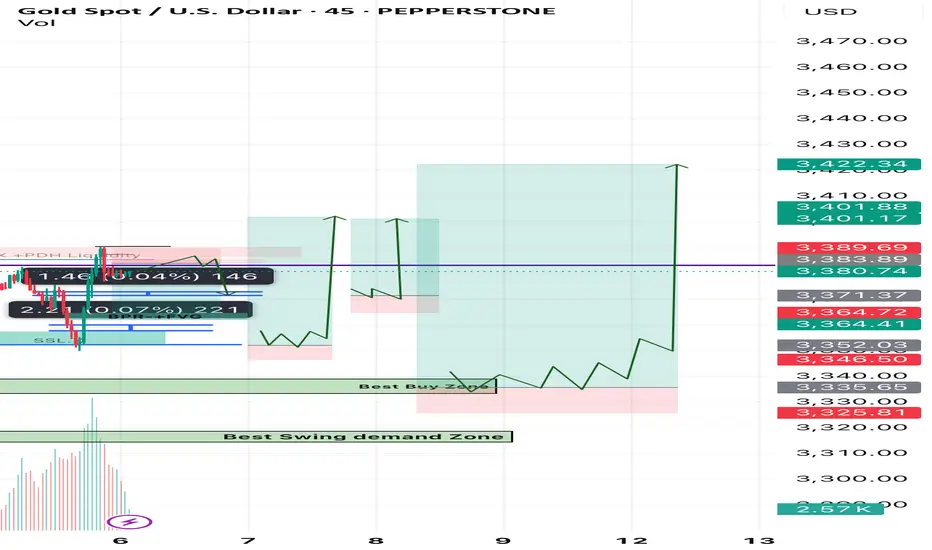
Gold h4 Based Setups Short Gold and Long analysis Market tapped above previous high (BSL + PDH Liquidity), then rejected → classic liquidity sweep
• Formed FVG + BPR zone (red box) and price consolidated below it
• You’re in a short trade targeting ~3365 (blue/green zone) where a new BPR + FVG block is formed (possible demand zone)
If price holds below 3383–3387 zone (FVG + BPR) and breaks 3375 support zone clearly
• We might see a drop toward:
• 3365 (1st TP – already marked)
• 3356–3352 (next demand & SSL area)
🟡 Bullish Rejection Possibility:
• If price reclaims 3387 with a strong candle close
• Then:
• Stops above 3388–3390 may get swept
• Upside potential = 3396–3402 (but less likely unless fundamentals support)
Golden Buying zone for Swing trade 3335-3330 zone
Second buy Golden Zone 3315-3318
Sl Below 3295 For Swing trader
Mange your Risk Alwayse use strick Stoploss
Happy Trading Best Of Luck
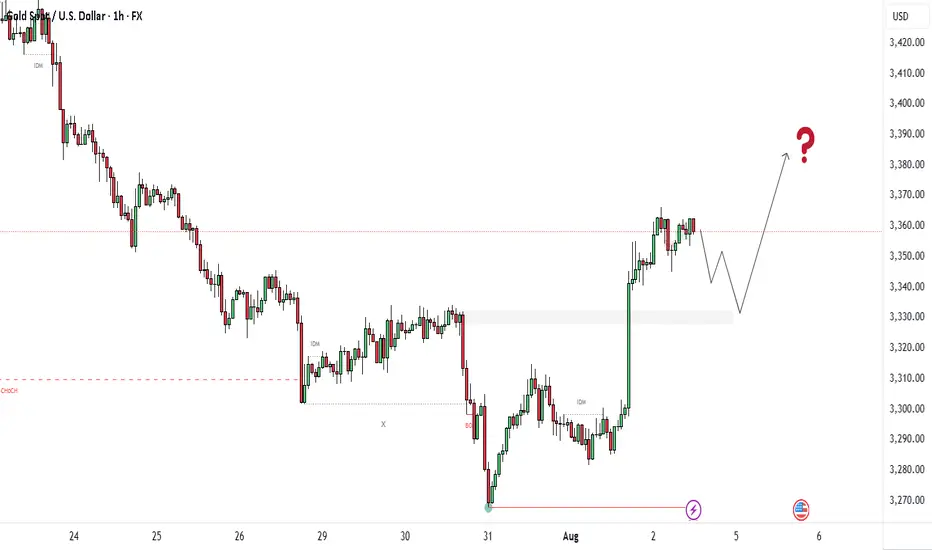
XAUUSD 8/4/25 followupPrice closed strongly above Sunday's open so I am just looking for retracements to the upside from here.

Gold Technical Analysis - Testing Key ResistanceGold has been showing a short-term bullish momentum after bouncing from the 3285 support zone, forming an ascending channel visible on the chart. The price is currently trading near 3361, close to the upper boundary of the channel and a key horizontal resistance level at 3365–3370. If the bullish momentum continues and price breaks above 3365–3370, we could see further upside toward 3396 and potentially 3400+. However, a failure to hold above this level could trigger a short-term retracement toward 3335–3325 support.
📈 Potential Scenarios:
- Bullish: If price sustains above $3,365, we could see an upside push toward $3,396 and possibly higher to $3,410 resistance.
- Bearish: A rejection near the channel top or $3,365 may lead to a pullback toward $3,325 (Fib 0.5) and then $3,285 support.
🔑 Key levels to watch:
- Upside: $3,365 → $3,396 → $3,410
- Downside: $3,335 → $3,325 → $3,285
- Trend Bias: Short-term bullish as long as price stays above 3325
Note
Please risk management in trading is a Key so use your money accordingly. If you like the idea then please like and boost. Thank you and Good Luck!
GOLD/USD – 1H ChartGold has recently shown a clear Change of Character (CHoCH) near the 3275 level, signaling a potential shift from bearish to bullish momentum. After a strong downtrend, the market formed a base and then launched an aggressive bullish rally, breaking previous structure and indicating a possible trend reversal. Currently, price is consolidating around the 3350–3360 zone, just above a key demand zone between 3330 and 3340, which is likely to act as a support area. This zone also aligns with a previous supply area that has now flipped into demand, confirming smart money interest.
The projected move shows a potential short-term dip into this demand zone before continuing the upward push toward the 3370–3390 range, where buy-side liquidity is likely resting. This level could act as a near-term target or resistance. If price holds above 3330 and shows bullish confirmation (like an engulfing pattern or FVG reaction), buyers could look for opportunities with targets near 3370 and 3390. However, if the price breaks below 3330 with strong bearish momentum, the bullish bias may be invalidated, and we could see further downside.
Overall, the structure is bullish, but traders should watch for a retest of the demand zone before entering long positions. Risk should be managed carefully with stops below 3330.
What You Should Watch:
Entry confirmation around 3,335–3,340 with bullish engulfing or FVG reaction
Set TP1 = 3,370
TP2 = 3,390
SL = Below 3,330
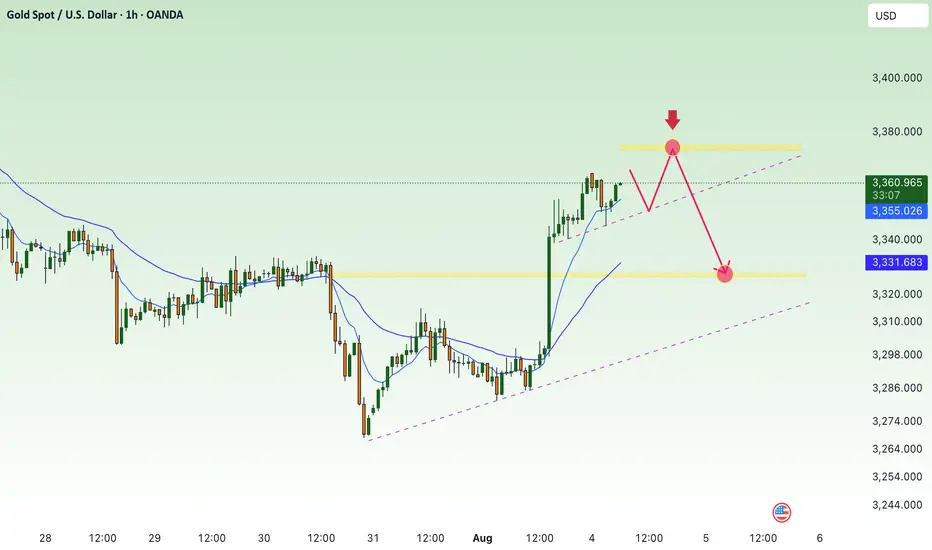
gold on sell reverse#XAUUSD on price reverse, base on the double rejection between 3345-3357. We await for breakout below 3351.6 before selling.
Entry 3351.6, target 3340-3315, SL 3361.
Above 3367 on 2 times breakout holds bullish till 3377 which have sell reject to fall below 3360-3350.

Bulls continue to be active following NFP data⭐️GOLDEN INFORMATION:
Gold (XAU/USD) slips toward $3,360 in early Asian trading on Monday, snapping a two-day winning streak. However, disappointing U.S. job data and lingering tariff concerns could pressure the U.S. Dollar and help cushion the downside for the Dollar-denominated metal.
The yellow metal is under pressure from a recovering Greenback, though gains may remain capped as weaker-than-expected Nonfarm Payrolls (NFP) data has strengthened expectations of a Federal Reserve rate cut in the near term.
⭐️Personal comments NOVA:
Buyers maintained early in the week, continuing to move towards higher resistances: 3374, 3387
⭐️SET UP GOLD PRICE:
🔥SELL GOLD zone: 3374- 3376 SL 3381
TP1: $3365
TP2: $3350
TP3: $3333
🔥BUY GOLD zone: $3328-$3326 SL $3321
TP1: $3335
TP2: $3348
TP3: $3360
⭐️Technical analysis:
Based on technical indicators EMA 34, EMA89 and support resistance areas to set up a reasonable BUY order.
⭐️NOTE:
Note: Nova wishes traders to manage their capital well
- take the number of lots that match your capital
- Takeprofit equal to 4-6% of capital account
- Stoplose equal to 2-3% of capital account
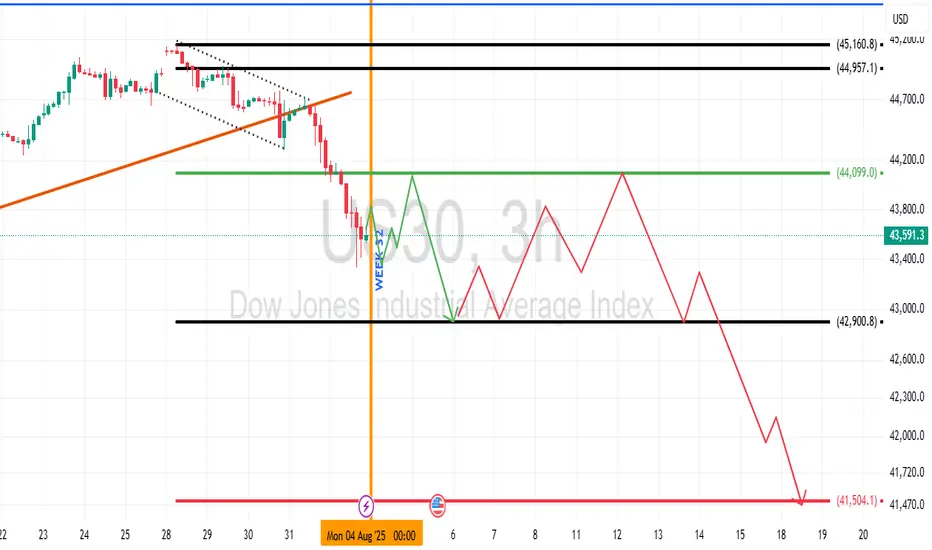
US 30 Dow Jones Industrial Average Week 32 OutlookUS 30, along with related indices, is likely to range for most of the week with early sells to confirm the support of interest. Best interest is in the bearish sentiment right now.
**"Gold Price Rebounding from Support:Potential Move Toward 3436This chart shows the **price movement of Gold (XAU/USD)** on a **daily timeframe**.
### Key Points:
* **Support Zone** : Around **\$3,266**, this is the area where price has bounced up multiple times, meaning buyers step in here.
* **Resistance Line**: Around **\$3,436**, this is the level where price has been rejected before, meaning sellers are strong here.
* **Current Price**: Around **\$3,293**.
### What the Chart Suggests:
* Price is near the **support** zone again.
* If the support holds, the green arrow shows a possible move **upward**.
* Price may first move up slightly, pull back, and then try to **break above resistance** at \$3,436.
Gold is in a sideways range. It's near a strong support level and might go up from here toward the resistance level, as shown by the green line.

Gold (XAU/USD): Supply Zone Rejection & Bearish Breakdown Chart Breakdown:
Supply zone rejection: Gold revisited the “supply zone” (light green/grey area) and failed to break above — a classic signal of seller dominance.
Uptrend invalidated: A sharp rise (steep black trendline) ended with a peak marked by the green arrow, followed by a decisive breakdown.
Ichimoku Cloud test: Prices slipped through the Ichimoku components, reinforcing the shift to bearish sentiment.
Potential targets: The red/green risk‑reward box highlights a short position, targeting ~3,347 then ~3,318 levels (blue labels) as initial support zones.
Strong supply base: The extensive grey zone below marks a "stronger supply zone" — this could cap any modest bounce and keep the downtrend intact.
🔍 Interpretation:
Bias: Bearish — sellers have taken control after a failed breakout.
Strategy: Short on rallies toward the mid‑green/red box (~3,373–3,380), targeting ~3,347 first and then ~3,319. Watch for support at the strong supply region (~3,292) for potential reversal or consolidation.
Risk management: Keep stop above the red zone—above recent highs (~3,380+) to limit risk.
🚀 In a nutshell: After failing to break supply and losing its short‑term uptrend, gold appears poised for a pullback. The next key levels to watch are ~3,347 and ~3,319—where buyers might step back in, or the downtrend continues toward the deeper supply base.

GOLD Bullish Today , Long Scalping Entry Valid To Get 150 Pips !Here is My 15 Mins Gold Chart , and here is my opinion , we finally above 3296.00 and we have a 30 Mins Candle closure above it , so i`m waiting the price to go back and retest this res and new support and give me a good bullish price action to can enter a buy trade and we can targeting 100 to 150 pips .
Reasons To Enter :
1- New Support Created
2- Bullish Price Action
3- Bigger T.F Giving Good Bullish P.A .

gold on third pattern breakout#XAUUSD have multiple test the third pattern, now price forming needs to breakout the 3308 before any further movement.
Buy entry 3301.4, TP 3308-3323.
Below 3291 holds a very strong bearish continuation, if breakout price will fall till 3269

gold on buy retrace#XAUUSD price have reformed back above 3306, now we are expecting bullish from 3309 on 2 times breakout.
Entry 3309 2 times breakout, target 3326-3335, SL 3297.
Below 3297 holds bearish reversal, target 3270. 3317 will reject, H1 closure there will continue bullish.

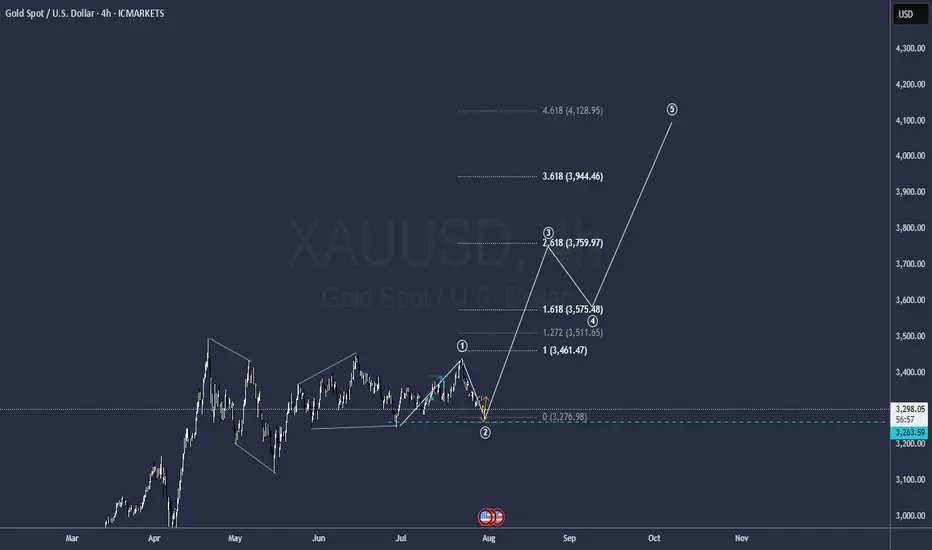
GOLD to all time highsIt is ready
a bitch wave one correction seems to be over so get ready to hit 4.000
GG
XAUUSD Long SetupXAUUSD has shown good sign on the zone and possible movement has been shown in the analysis. Consider it take the setup with keeping your risk management in consideration.

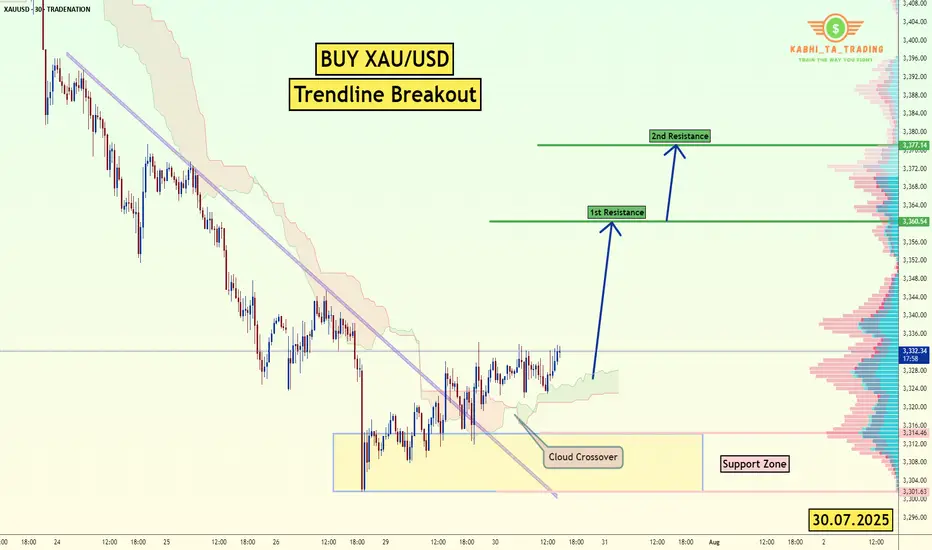
XAU/USD Trendline Breakout (30.07.2025)The XAU/USD pair on the M30 timeframe presents a Potential Buying Opportunity due to a recent Formation of a Trendline Breakout Pattern. This suggests a shift in momentum towards the upside and a higher likelihood of further advances in the coming hours.
Possible Long Trade:
Entry: Consider Entering A Long Position around Trendline Of The Pattern.
Target Levels:
1st Resistance – 3360
2nd Resistance – 3377
🎁 Please hit the like button and
🎁 Leave a comment to support for My Post !
Your likes and comments are incredibly motivating and will encourage me to share more analysis with you.
Best Regards, KABHI_TA_TRADING
Thank you.
Disclosure: I am part of Trade Nation's Influencer program and receive a monthly fee for using their TradingView charts in my analysis.
We go up!Gold trapped all the buyers, flash crash like said yesterday, now we buy till 3400. Rates ain't getting cut, they already have gold at the price they want.

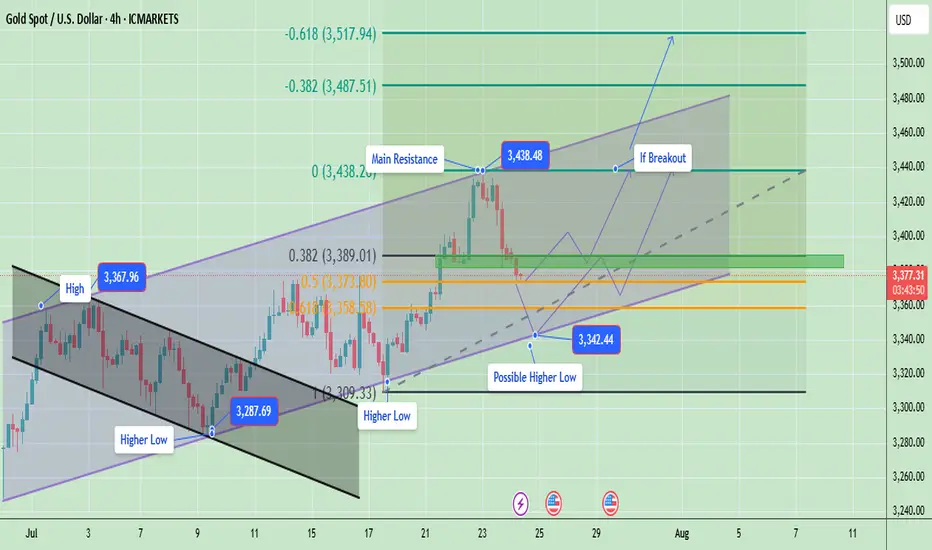
Gold Breakout or Pullback Ahead?Currently, price is in a correction phase within this rising channel after hitting the upper resistance near $3,438. The pullback is moving toward the mid and lower channel zones, which is healthy for a bullish continuation. Gold is in a healthy pullback phase inside a bigger bullish trend. If support at $3,358 – $3,373 holds, expect an upward push back to $3,438 → $3,487 → $3,517 in the coming sessions. Only a clean break below $3,309 would signal a deeper bearish move.
Gold is likely to consolidate or retest the lower channel support ($3,358 – $3,373). If buyers defend this zone, the price is expected to bounce back toward $3,400 – $3,420 and eventually retest $3,438.
Key Price Zones
- Main Resistance: $3,438 (if broken, potential rally toward $3,487 → $3,517)**
- Immediate Support: $3,373 (first reaction level)
- Major Support: $3,358 (key level to protect bullish structure)
- Potential Higher Low Zone: Around $3,342.44
Expected Price Behavior
- If gold holds above $3,373 – $3,358, it is likely to form a new higher low near $3,342 – $3,358 before attempting to push higher.
- A successful breakout above $3,438 would indicate continuation of the bullish momentum targeting $3,487 and $3,517 ).
- Failure to hold above $3,358 may open the door for a deeper correction toward $3,309, but the overall trend remains bullish unless that level is broken.
Trend Outlook
- Short-Term Trend: Consolidation / corrective pullback within a bullish channel
- Medium-Term Trend: Bullish (higher lows and breakout structure intact)
- Long-Term Trend: Bullish as long as the channel holds above $3,309
Gold is currently in a pullback phase after a strong bullish breakout. The market is likely forming a higher low and may resume upward momentum once the $3,373 – $3,358 zone is confirmed as support. A breakout above $3,438 would validate a bullish continuation toward $3,487 - $3,517.
Note
Please risk management in trading is a Key so use your money accordingly. If you like the idea then please like and boost. Thank you and Good Luck!
Gold’s Liquidity Hunt Eyes on Bullish FVG Reaction!Gold Analysis – NY Session Outlook
During the New York session, gold created equal highs near recent swing highs, indicating that upside liquidity remains uncollected. Currently, the market is pulling back, targeting liquidity resting below the trendline, along with internal liquidity levels beneath.
If gold continues to move downward and taps into the marked bullish Fair Value Gap (FVG), monitor that zone for any signs of bullish confirmation. If confirmed, there is potential for a further upward move toward the equal highs and beyond, aiming for external liquidity.
Always Do Your Own Research (DYOR).

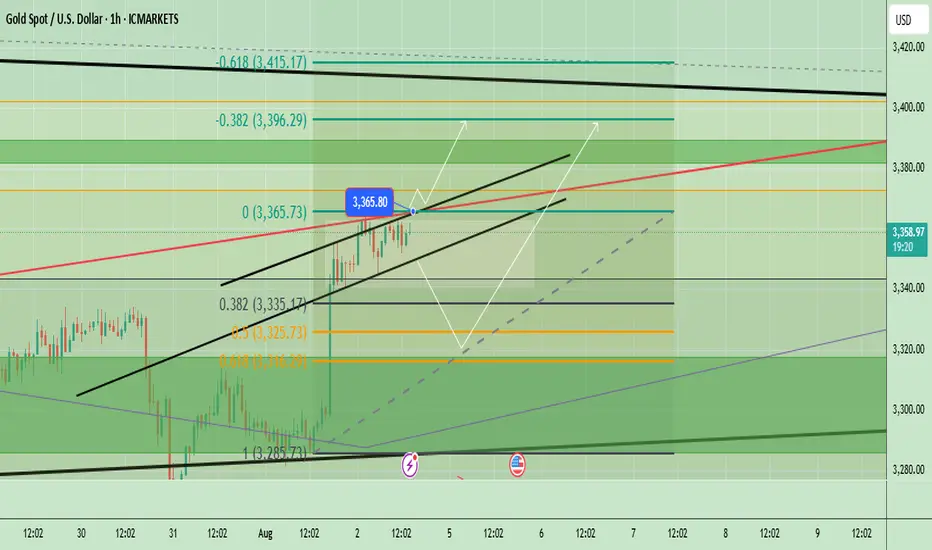
XauUsdThere are two analyses.
As you can see, the overall trend is bullish and long positions have more chances, the important market points are drawn accurately and have high validity.
The red arrow has a 60% chance of occurring and the blue arrow has a 40% chance.
Important market points:
Resistance:
3340
3369
3390
3422
Support:
3303
3280
