GOLD H2 Intraday Chart Update For 2 July 2025Hello Traders,
Today all eyes on breakout of 3360-70 zone in order to GOLD go for further advance below this zone all eyes are remains on 3318 level if market successfully maintain 3330 level then will go down further towards 3300 Psychological Level after passing 3318
NFP main event of the day which is held by tomorrow
Disclaimer: Forex is Risky
Xauusdlong

7/2 Trapped Orders from Yesterday Turned ProfitableGood morning, everyone!
Yesterday’s early-entry gold short position encountered some temporary drawdown, but thanks to flexible adjustments, the trade has now moved into profit overall.
Currently, the price is hovering near a key support area. Based on the 1H and 2H charts, there is still room for further downside. At this point, there are two strategic options:
Close the position to lock in current profits;
Hold the position and wait for further decline, keeping in mind that if support holds, the price may rebound back toward the 3350 level, introducing some risk.
You can decide whether to stay in the trade or exit, depending on your risk tolerance and trading plan.

Gold operation suggestionsLooking back at the market in May and June, although gold has experienced adjustments, its shape is very resilient. In the monthly cycle, the price of gold is firmly above the MA5 moving average. From the perspective of large-cycle technical analysis, this is a typical strong bullish pattern, demonstrating the strong control of the bulls. As the adjustments are gradually in place, the later bullish outbreak is worth looking forward to. However, the adjustment to 3247 this time is not small, so in the short term, the gold price is likely to fluctuate upward. At present, 3451 is an important watershed. Once it is effectively broken through, the gold price is expected to hit the 3500 mark, and I personally believe that 3500 will not be the end point, and it is expected to be refreshed later.
Gold Rebound Underway – Support Zone Holds Strong! - Short termGold( OANDA:XAUUSD ), as I anticipated in the previous idea , has attacked the Support zone($3,281-$3,243) and Support lines .
From an Elliott Wave theory perspective , it appears that Gold has completed 5 sub-waves of the main wave C .
Also, we can see the Regular Divergence(RD+) between Consecutive Valleys.
I expect Gold to rise to at least $3,307 in the coming hours.
Second Target: $3,321
Note: Stop Loss (SL) = $3,240
Gold Analyze (XAUUSD), 1-hour time frame.
Be sure to follow the updated ideas.
Do not forget to put a Stop loss for your positions (For every position you want to open).
Please follow your strategy; this is just my idea, and I will gladly see your ideas in this post.
Please do not forget the ✅ ' like ' ✅ button 🙏😊 & Share it with your friends; thanks, and Trade safe.

Can gold hit a new high again?During the U.S. trading session, spot gold trended higher in a volatile manner, reaching a three-day high of 3,357.88 as of 22:30. The rally was primarily driven by a weaker U.S. dollar, heightened uncertainty over U.S. trade agreements, and intensified market expectations for Federal Reserve rate cuts. The global economic uncertainties have highlighted gold's safe-haven value. Market participants should monitor the negotiation progress ahead of the tariff deadline on July 9. Traders have priced in at least two rate cuts in 2025. This Thursday's U.S. employment report may catalyze a decline in U.S. Treasury yields. Trump plans to replace Powell, demanding that the new chairman supports rate cuts. The market is focused on this week's ADP and non-farm payroll data to gauge the Fed's policy trajectory.
From a 4-hour technical perspective, the MACD has formed a bullish divergence, triggering a rebound with expanding red histogram bars. Prices are advancing along short-term moving averages, breaking through the previous range of resistance levels, indicating a short-term bullish trend. Before the non-farm payroll data, prices are expected to remain range-bound, with attention paid to safe-haven demand triggered by geopolitical risks. Focus on the opportunity for a secondary rally after the end-of-session pullback confirmation. Short-term resistance is seen at the 3,375-3,380 zone.
On the hourly chart, prices are in a narrow high-range consolidation with limited pullback momentum. Candlesticks maintain strength by relying on short-term moving averages.
you are currently struggling with losses,or are unsure which of the numerous trading strategies to follow,You have the option to join our VIP program. I will assist you and provide you with accurate trading signals, enabling you to navigate the financial markets with greater confidence and potentially achieve optimal trading results.
Trading Strategy:
buy@3330-3335
TP:3360-3365
Gold price rises by more than $100, will the bull run continue?📰 News information:
1. Geopolitical situation
2. PMI data
3. Global Central Bank Governors Meeting
📈 Technical Analysis:
The NY session is about to begin, and there are two things we need to pay attention to. First, the PMI data, and second, the talks between global central bank governors. If Powell again hints that the inflation outlook is weaker than expected, this will increase the Fed's easing bets and trigger a new round of decline in the US dollar. The dovish tone may help gold prices to further rebound. On the contrary, if Powell makes some hawkish or cautious remarks, this may exacerbate the recent downward trend in gold prices. The key point at present is the 3350 mark. If the 4H closing line of the NY session remains below 3350, then in the short term we are expected to continue to retreat to the 3330-3320 range. If the 4H closing line is above 3350 and stabilizes, gold may rebound to the 61.8% position, which is around 3372.
🎯 Trading Points:
SELL 3340-3350-3355
TP 3330-3325-3320
BUY 3330-3320
TP 3340-3350-3372
In addition to investment, life also includes poetry, distant places, and Allen. Facing the market is actually facing yourself, correcting your shortcomings, confronting your mistakes, and strictly disciplining yourself. I hope my analysis can help you🌐.
FX:XAUUSD FXOPEN:XAUUSD PEPPERSTONE:XAUUSD FOREXCOM:XAUUSD FX:XAUUSD OANDA:XAUUSD TVC:GOLD

XAUUSD MONTHLY/WEEKLY ANALYSISWhat we’re seeing here on **XAUUSD (Gold Spot)** is a **classic higher-timeframe accumulation pattern** followed by **a potential explosive bullish leg**.
After a strong move up in April, we witnessed a **textbook V-reversal**, consolidation, and now — **a higher low** forming around the \$3,290 zone. That’s our key demand level. 💥
✅ If this higher low holds and price starts pushing with volume, we may be gearing up for a **multi-phase breakout** with the following potential targets:
🔹 **Target 1:** \$3,500
🔹 **Target 2:** \$3,694
🔹 **Target 3:** \$3,902
🎯 **Final Target:** \$4,101+
This isn’t just a short-term scalp setup. This is a **position trade opportunity** for those with patience and precision. The structure is clean, momentum is returning, and the levels are marked.

#XAUUSD:First Buy, Then Sell Swing! Big Move In Making! Gold failed to decline further as previously predicted in our analysis. Instead, it continues to exhibit bullish sentiment. The current price trading in a critical region between 3350 and 3360, where significant resistance is observed. We anticipate that the price must pass through this region before it can clearly surpass the 3400 mark.
When this occurs, it is advisable to implement precise risk management strategies while trading gold due to its volatile nature. Additionally, the DXY index is experiencing a decline and currently trading at its all-time low since 1976. This development will likely have a substantial impact on the gold price.
We wish you the best of luck and ensure safe trading practices.
Kindly consider liking, commenting, and sharing this idea.
Team Setupsfx_
❤️🚀

gold on sell retest#XAUUSD price have retest 3350 which have short bearish retest, fundamental is possible to change market direction.
Sell limit 3350, target 3336-21, stop loss 3360.
2 times breakout above 3353 today high will continue bullish till 3370 bearish retracment.
Gold Bulls Ready to Charge: $3,500 Target Could Be Days AwayThe chart shows a strong medium-term uptrend in gold that began in late 2024, carrying the price steadily higher through the first half of 2025. After peaking, price has been consolidating in a clear range bounded by a well-defined resistance and support zone.
The Resistance Zone is marked around $3,438, where price has been repeatedly rejected. Each time the market approached this level, sellers stepped in, causing retracements. This reinforces the area as a significant supply zone.
Below, the Support Region near $3,249–$3,250 has provided a floor for price action. It’s notable that this area was once a resistance, making it a classic breakout-retest structure. Buyers have stepped in multiple times to defend this level, indicating healthy demand that aligns with the broader bullish trend.
The recent candles suggest the market is trying to build momentum for another test of the resistance. Wick rejections near support indicate that buyers are showing interest again. At the same time, the overall structure remains constructive, with higher highs and higher lows visible on the longer timeframe.
The Price-Volume Trend (PVT) indicator along the bottom is gradually climbing, which suggests accumulation is still happening beneath the surface. This can be a signal that a fresh breakout attempt is brewing.
Trade Setup
Here’s how the trade idea is structured visually on your chart:
• Entry Zone: Around $3,348, near the midrange and just above support.
• Stop-Loss: ~99 points below the support area (around $3,249), offering a cushion against volatility.
• Target: Approximately $3,555–$3,560, the next major resistance above the current consolidation.
• Reward Potential: ~207 points (6.19%) upside.
• Risk-Reward Ratio: ~2.09, which is a favorable setup for a trend continuation trade.
Analysis Summary
This is effectively a range-bound bullish continuation setup. The idea is to enter on support retest and ride the next impulse leg higher. Price is consolidating above the former breakout area, with clear evidence of accumulation on the PVT. If gold can close convincingly above $3,438, it will likely trigger breakout buying interest and stop-loss clusters from short sellers, which could drive price rapidly toward your target.
However, keep in mind that failure to hold above $3,249 support would invalidate the setup and could lead to a deeper correction or range breakdown. For this reason, your stop-loss level is well-placed to limit risk.

Double Top Breakdown at Resistance ZoneThe chart reveals a classic Double Top pattern formation near the 3,360–3,480 resistance zone, followed by a clear bearish rejection (highlighted with red arrows). This confirms the presence of strong supply pressure in that region.
🔍 Key Technical Highlights:
🔺 Double Top Pattern
The price formed two swing highs near the resistance zone, failing to break above.
After the second peak, the price started declining, confirming the reversal pattern.
📉 Bearish Channel
The recent downtrend is contained within a descending channel, with consistent lower highs and lower lows.
Price broke below the neckline of the double top pattern around 3,270.
🎯 Target Projection
Based on the height of the double top pattern, the projected downside target is near 3,207.5, aligning perfectly with the support zone marked below.
🟠 Historical Support Areas
The large orange circles indicate key reaction points, confirming that the 3,207–3,220 area has acted as support in the past.
📊 Outlook:
If the current bearish momentum continues, price is likely to head towards the support target zone at 3,207.5. Any pullback toward 3,320–3,350 could provide a shorting opportunity with stops above the recent highs.
🔧 Bias: Bearish
📍 Resistance: 3,360–3,480
📍 Support: 3,207–3,220
📍 Target: 3,207.5

GOLD Support Ahead
HI,Traders !
#GOLD is going down
Now but the pair will soon
Hit a horizontal support
Of 3241.70 from where
We will be expecting a
Local bullish rebound !
Comment and subscribe to help us grow !

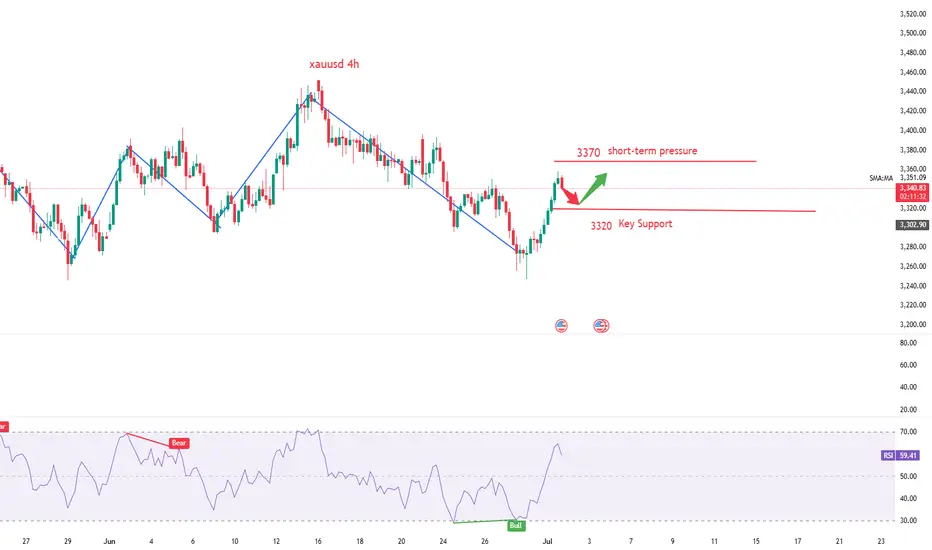
The bull market is too fierce. How to solve the short position?📰 News information:
1. Geopolitical situation
2. PMI data
📈 Technical Analysis:
The conflict between Iran and Israel has stopped for a while, but there is a possibility of it breaking out again. There is a possibility of triggering risk aversion in the short term. From a technical perspective, the 4H MACD indicator shows a golden cross, and the moving average and other indicators are also radiating upward, with a strong bullish signal. The 1H chart Bollinger Bands open upward, and the short-term pressure position is at 3340-3345. The short-term data indicators are seriously overbought, and there may be a profit correction in the short term. Therefore, if you want to short in the short term, you can only consider the 3340-3350 range. In the short term, gold will not usher in a large retracement, and the short-term target is only suitable for looking at 3320-3310. As for the long trading point, it is expected to wait for the European and American trading hours.
🎯 Trading Points:
SELL 3340-3350
TP 3320-3310
BUY 3325-3315
TP 3335-3340-3350
In addition to investment, life also includes poetry, distant places, and Allen. Facing the market is actually facing yourself, correcting your shortcomings, confronting your mistakes, and strictly disciplining yourself. I hope my analysis can help you🌐.
TVC:GOLD OANDA:XAUUSD FOREXCOM:XAUUSD PEPPERSTONE:XAUUSD FXOPEN:XAUUSD FX:XAUUSD

XAUUSD 15MIN - Bullish Setup I Trade Plan Above 3349This chart presents a carefully planned intraday buy opportunity on XAUUSD (Gold vs. US Dollar), focusing on short-term bullish price action.
📍 Key Levels & Setup Logic:
Buy Entry Zone: 3350
A strong potential demand area based on recent market structure. The price is expected to bounce from this level if bullish pressure sustains.
No Trading Zone: 3337–3349
This zone marks an area of high volatility and indecision. Traders are advised to avoid initiating trades within this range to prevent premature entries and whipsaws.
TP 1 – 3374.35:
First take profit level aligning with minor resistance and past consolidation.
TP 2 – 3390.91:
Second take profit target based on resistance zone and Fibonacci confluence.
Re-Entry Point:
If the price breaks and holds above 3397, a buy-side re-entry is valid at 3398, targeting continuation toward higher resistances.
TP 3 – 3420 & TP 4 – 3445 (Reversal Zone):
Strong resistance and potential exhaustion/reversal zone. Monitor price action closely here for signs of trend weakening.
SL- Previous Swing Low.
⚠️ ZONES:
🔴 No Trading Zone: 3337–3349 (Avoid trades in this range — potential indecision zone)
🔴 Reversal Zone: Near 3445 — monitor price action for potential exhaustion.
📌 Technical Commentary:
Structure favours upside as long as price sustains above the No Trading Zone.
Clean higher-low formation suggests momentum shift.
If price confirms break above 3397 resistance, bullish continuation toward 3445 is highly probable.
🔍 Trade Summary:
Strategy: Buy on Breakout & Pullback
Confirmation: Bullish bounce from 3350 or breakout above 3397
Risk Management: Avoid trades within 3337–3349; reassess if price falls below this zone
Profit Targets: Laddered exits at 3374.35, 3390.91, 3420, 3445
⚠️ Disclaimer & Important Note:
This analysis is for educational and informational purposes only. It does not constitute financial advice or a recommendation to buy or sell any financial instrument. All trading involves risk. We are not responsible for any kind of loss incurred, whether financial, emotional, or otherwise. Always do your own research and consult with a licensed financial advisor before making any trading decisions.
Trading involves significant risk, and you should never invest more than you can afford to lose. Past performance is not indicative of future results.
The trade idea shared above reflects personal market interpretation and is subject to change based on new market conditions.
📍Posted by: THEPATELCRYPTO
📈 Stay safe. Trade smart.
🔔 Follow for more ideas!

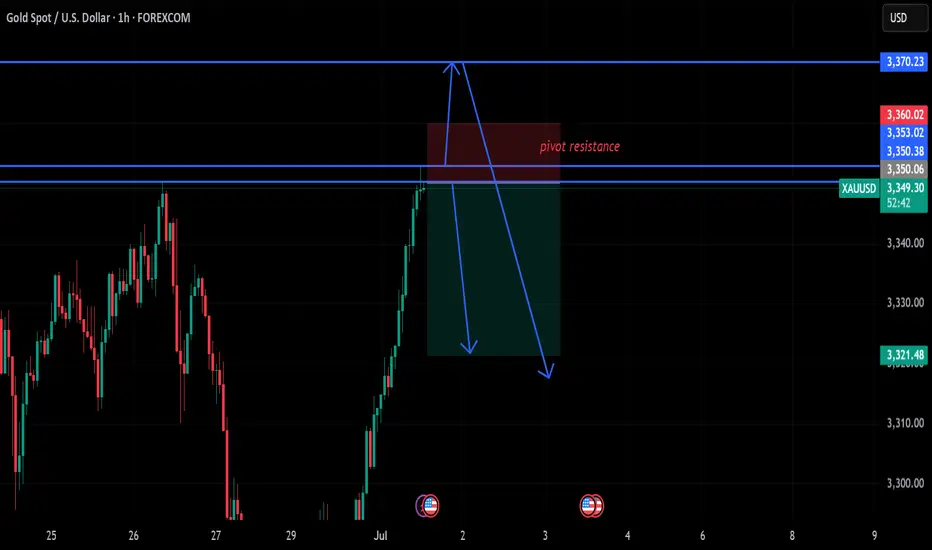
7/1 Gold Analysis and PMI Data Trading StrategyGood afternoon, everyone!
Gold has now entered a resistance zone, and on the 30-minute chart, a technical correction appears likely. This correction typically takes one of two forms:
A direct pullback from current levels;
A minor upward push before the pullback, intensifying the need for correction.
In most cases, the second scenario doesn’t result in a large move—unless it’s accompanied by strong news. Given this setup, today’s trading idea is to:
Start with a small short position near current resistance;
Add to the position if price pushes slightly higher, and patiently wait for a pullback. This strategy has shown over 80% historical success rate.
Key support levels to watch:
If the price rises before pulling back: 3321–3316
If the price drops directly: 3313–3306
On the 4-hour chart, the rebound is not yet complete, so if the pullback finds solid support, there’s still room for buy-side setups in line with the short-term trend.
⚠️ Important: U.S. PMI data will be released during the New York session. Strategy depends on pre-release price positioning:
If price remains below 3312, and the data is bullish → look for long setups.
If price is above 3323, wait for a post-data rally to sell into.
If the data is bearish → consider selling immediately.
Stay flexible, manage your positions wisely, and trade with discipline ahead of the U.S. session.

Gold price recovers above 3300⭐️GOLDEN INFORMATION:
Gold (XAU/USD) trades at $3,292 after rebounding from an intraday low of $3,246 and looks set to close out June with a modest gain of over 0.18%. However, its upward momentum has been restrained by easing geopolitical tensions in the Middle East and growing optimism over forthcoming trade agreements. Meanwhile, analysts at Citi expect Gold to consolidate within the $3,100 to $3,500 range throughout the third quarter.
In Washington, US Treasury Secretary Scott Bessent expressed confidence that the “One Big Beautiful Bill” will make progress in the coming hours. The sweeping tax reform legislation, which narrowly passed the Senate over the weekend, includes major tax deductions funded by reductions in Medicaid spending and green energy incentives.
⭐️Personal comments NOVA:
Gold price recovers above 3300 , ahead of NF reports this week . Accumulates above 3300
⭐️SET UP GOLD PRICE:
🔥SELL GOLD zone: 3353- 3355 SL 3360
TP1: $3340
TP2: $3330
TP3: $3320
🔥BUY GOLD zone: $3272-$3270 SL $3265
TP1: $3283
TP2: $3295
TP3: $3310
⭐️Technical analysis:
Based on technical indicators EMA 34, EMA89 and support resistance areas to set up a reasonable BUY order.
⭐️NOTE:
Note: Nova wishes traders to manage their capital well
- take the number of lots that match your capital
- Takeprofit equal to 4-6% of capital account
- Stoplose equal to 2-3% of capital account

The latest analysis and layout of gold in July made a good start📰 News information:
1. Geopolitical situation
2. PMI data
📈 Technical Analysis:
Yesterday, we gave the idea of looking at the upper resistance of 3310-3320. The 4H pressure is still at 3327. As long as this key resistance level is not effectively broken, gold will fall again. On the contrary, if it stabilizes above 3327, the trend may reverse. In the short term, pay attention to the upper resistance of 3327. If it is not broken, you can short with a light position. If it falls below 3300-3290, consider going long.
🎯 Trading Points:
SELL 3310-3320
TP 3305-3300
BUY 3300-3290
TP 3310-3320-3350
In addition to investment, life also includes poetry, distant places, and Allen. Facing the market is actually facing yourself, correcting your shortcomings, confronting your mistakes, and strictly disciplining yourself. I hope my analysis can help you🌐.
TVC:GOLD FXOPEN:XAUUSD PEPPERSTONE:XAUUSD FOREXCOM:XAUUSD OANDA:XAUUSD TVC:GOLD

The limit is 3320. Rebound and still short📰 News information:
1. Gold market liquidity at the end of the month
2. Impact of geopolitical situation
📈 Technical Analysis:
Currently, gold has rebounded to around 3295, reaching our ideal trading area. I have given the short-selling trading idea in the previous post. At present, in the short term, we still maintain the short-selling trading idea before effectively breaking through the upper resistance. Focus on the 3325 line of resistance
🎯 Trading Points:
SELL 3295-3310-3320
TP 3285-3270
In addition to investment, life also includes poetry, distant places, and Allen. Facing the market is actually facing yourself, correcting your shortcomings, confronting your mistakes, and strictly disciplining yourself. I hope my analysis can help you🌐.
OANDA:XAUUSD FOREXCOM:XAUUSD FX:XAUUSD PEPPERSTONE:XAUUSD FXOPEN:XAUUSD TVC:GOLD

Exclusive operation suggestions for future market trends!!!Gold bottomed out and rebounded on Monday, so wait patiently for room for future gains. Technically, from the current hourly chart, the gold entity has always been above 3278, and it only pierced through 3275 and then began to rebound. If the retracement does not break the 618 position, there will inevitably be a high point in the future. So next, we should focus on the vicinity of 3280. If gold always closes above 3280, then the high point of 3297 on Monday is likely to be refreshed. Secondly, from the perspective of 123 seeking 4, if it goes up again, it is very likely to touch around 3310. 3310 is exactly around 618. And it is also the top position of this hourly chart range. Therefore, gold should be shorted above 3280 with caution, and the probability of touching above 3300 is very high. In terms of operation, it is recommended to directly enter the market to go long near 3280, and look at 3310-3320. If you want to short, you must wait at least for 3310-3320 before you can enter the market to short once.

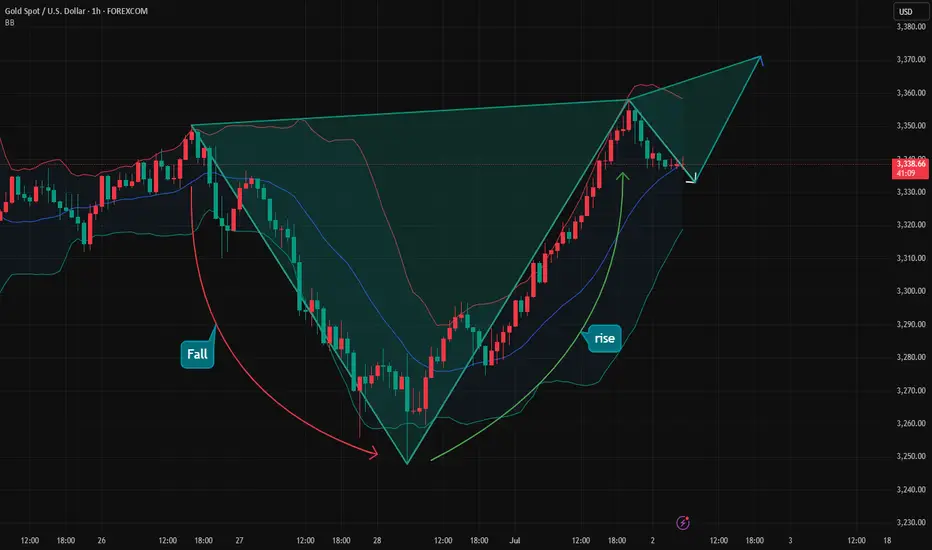
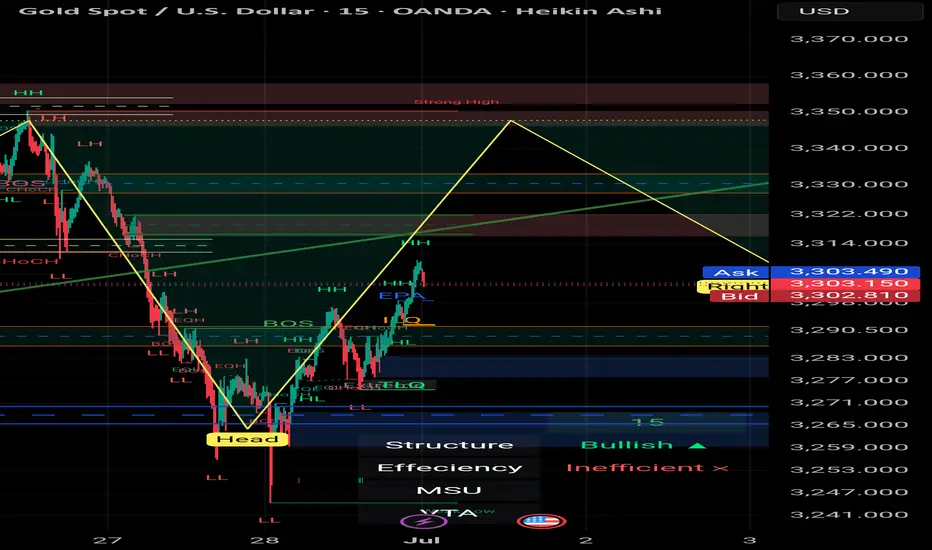
Gold Market Outlook – 1st of July | XAU/USD | 30min | by Mohsen # Gold Market Outlook – 1st of July | XAU/USD | 30min | by Mohsen Mozafari Nejad
🔸 **Instrument:** Gold Spot / USD (XAU/USD)
🔸 **Timeframe:** 30min
🔸 **Methodology:** Smart Money Concepts (SMC) + Liquidity + OB + Market Structure
🔸 **Focus:** New Monthly Open Setup
---
## 🔍 Market Context:
- **Structure:** Bullish on LTF (MSU)
- **Efficiency:** ✅ Clean & Efficient Delivery
- **Recent Activity:** Reverse H&S completed + double BOS + CHoCH confirmed
- **Price Level:** Trading near key Supply zone (3300–3315)
- **Monthly Context:** July begins with bullish momentum & previous session showed aggressive buy-side pressure
---
## 🧠 Technical Breakdown:
1. **Strong recovery** after clearing deep liquidity sweep (Head zone)
2. **Bullish BOS** structure confirmed on LTF → Multiple HH and HL formed
3. Price now testing **Key Supply/OB zone at 3300–3315**
4. Above this zone lies a **Strong High (SH) around 3,350**, a potential liquidity magnet
5. Overall bias is bullish unless strong rejection appears from upper OB
---
## 📌 Trade Plan:
| Position | Entry Confirmation Zone | Stop Loss (SL) | Take Profit (TP) |
|----------|--------------------------|----------------|------------------|
| Long | Above 3,303–3,310 (structure hold) | Below 3,294 | TP1: 3,325 / TP2: 3,340 / TP3: 3,348 |
| Short (scalp only) | Bearish reaction from 3,345–3,350 | Above 3,353 | TP1: 3,310 / TP2: 3,290 |
---
## ⚠️ Risk Factors to Watch:
- 🔺 High-impact USD news (July 1st releases: Manufacturing PMI / employment preview)
- 🔺 Overextension above supply zone without support → trap risk
- 🔺 Bull trap risk if price spikes above 3,340 then sharply reverses
---
## ✅ Summary:
> **Start of July** could fuel volatility and directional momentum.
> The structure is clearly bullish short-term, but upper liquidity zones remain **highly reactive**.
> Smart traders will wait for reaction at the 3,340–3,350 SH zone before overcommitting.
**Structure:** 🟢 Bullish
**Trend:** 📈 MSU
**Efficiency:** ✅ Clean
**Liquidity:** 🔺 Above SH & Below recent HL
---
📊 Prepared by: **Mohsen Mozafari Nejad**
GOLD Breakout Done Let`s Buy It To Get Clear 200 Pips !Here is my opinion on 30 mins T.F , We have a very good bullish price action and we have a very good breakout with amazing bullish candle and now the price back to retest the breakout area , it`s my fav place to enter a buy trade and the price can move 200 Pips easy , i`m waiting for retest and good bullish price action to enter a buy trade .

Gold Is Set to Bottom Out and Rebound This WeekGood morning, everyone!
At today’s open, gold once again dipped into the 3258–3248 buy zone, then rebounded toward 3270. From a structural perspective, gold has clearly entered a downward trend, but this decline is unlikely to be one-directional—short-term rebounds and consolidations are expected along the way.
Based on my experience, below 3250 remains a favorable area for initiating long positions. Whether the price rebounds directly or continues lower before building a stronger base to challenge 3300 again, the broader outlook remains bullish as long as the 3200 support holds. A bottoming reversal this week is still the more probable scenario.
As such, the focus early this week should be on buying near the lows, with short opportunities on rebounds as a secondary strategy. Monitor key support levels for signs of strength.
This week is also packed with important data—including PMI, Non-Farm Payrolls (NFP), and the unemployment rate, in addition to regular economic releases. Given the current macroeconomic backdrop, significant market volatility is expected—bringing both risk and opportunity. Manage your exposure carefully and stay adaptable.

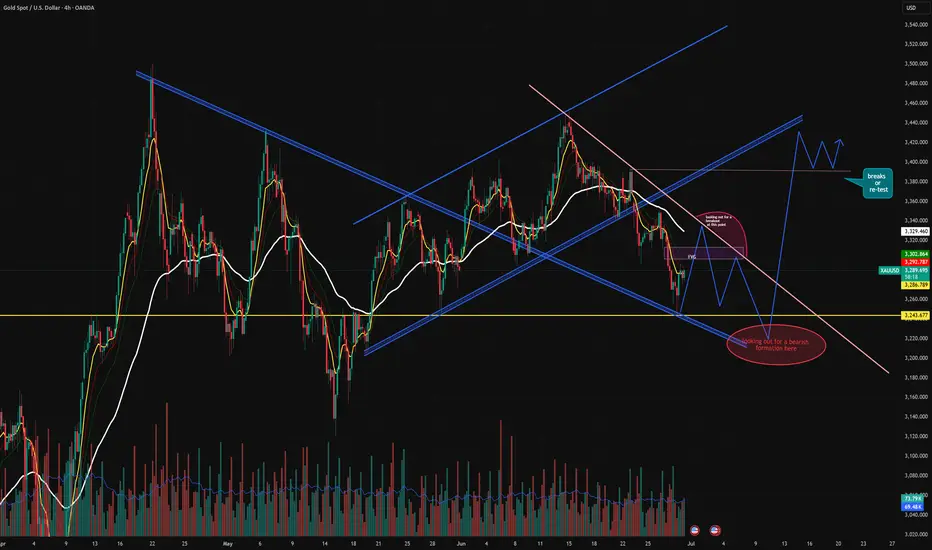
XAUUSD 4H Analysis:= Key Levels, FVG Reaction & Structure projec🔔 XAUUSD 4H Analysis – Key Levels, FVG Reaction & Structure Projections
Gold is currently trading within a complex structure after breaking down from a rising parallel channel and is now testing confluence zones that could dictate the next major move.
📈 Scenarios:
🔺 Bullish Path: Clean breakout and retest above the FVG zone and descending trendline → price could re-enter the previous rising channel targeting 3,400+.
🔻 Bearish Path: Rejection from the FVG & trendline → look for lower highs to form → continuation toward 3,243 key support and possibly beyond.
If support breaks below $3,246, the next level of interest lies near $3,200 psychological round number.
📌 Conclusion:
We’re in a decision zone. The next move depends on how price behaves around the FVG and trendline resistance. Patience and confirmation will be key — breakout traders and mean reversion traders both have defined setups ahead.
#this is not a buy sell advice.
#just a view
#apologies and credit if someone has already seen and posted this.