Bulls recover in new week, gold price returns to 3300⭐️GOLDEN INFORMATION:
Gold prices (XAU/USD) regained some lost ground during Monday’s Asian session, buoyed by growing expectations that the US Federal Reserve may implement more interest rate cuts this year—and potentially sooner than previously anticipated. Such prospects weigh on the US Dollar, making the dollar-denominated metal more attractive to overseas buyers.
However, the recent improvement in global risk sentiment—driven by the US-China trade accord and a ceasefire agreement between Israel and Iran—could reduce demand for Gold’s safe-haven appeal. Investors now turn their attention to upcoming comments from Federal Reserve officials, with speeches from Atlanta Fed President Raphael Bostic and Chicago Fed President Austan Goolsbee expected later in the day.
⭐️Personal comments NOVA:
Gold price recovered, accumulating at the beginning of the new week around the price range of 3300. Still in the main downtrend.
⭐️SET UP GOLD PRICE:
🔥SELL GOLD zone: 3316- 3318 SL 3323
TP1: $3305
TP2: $3290
TP3: $3277
🔥BUY GOLD zone: $3248-$3246 SL $3241
TP1: $3258
TP2: $3270
TP3: $3286
⭐️Technical analysis:
Based on technical indicators EMA 34, EMA89 and support resistance areas to set up a reasonable BUY order.
⭐️NOTE:
Note: Nova wishes traders to manage their capital well
- take the number of lots that match your capital
- Takeprofit equal to 4-6% of capital account
- Stoplose equal to 2-3% of capital account
Xauusdlong

Analysis and layout of gold trend at the end of the month📰 News information:
1. Gold market liquidity at the end of the month
2. Impact of geopolitical situation
📈 Technical Analysis:
From the beginning of the decline of gold near 3338 on Friday to today's lowest point near 3244, gold has fallen by nearly $94. At present, gold has rebounded as expected. In the short term, I think we have two key areas to pay attention to. The first is the position of 3290-3295, which is a 50% rebound, and the second is the upper top range limit range of 3300-3320. Of course, if it breaks through 3280 and then retreats, it can also be long twice, but the current price rebounds, considering the position of the temporary low long position, there is not much trading opportunity. First look at the key areas given to find opportunities for shorting, and pay attention to the opportunity of retreating to 3280-3270 below.
🎯 Trading Points:
SELL 3290-3295
TP 3380-3370
SELL 3300-3310-3320
TP 3290-3280-3270
BUY 3270-3260
TP 3290-3300
In addition to investment, life also includes poetry, distant places, and Allen. Facing the market is actually facing yourself, correcting your shortcomings, confronting your mistakes, and strictly disciplining yourself. I hope my analysis can help you🌐.
OANDA:XAUUSD FOREXCOM:XAUUSD FX:XAUUSD PEPPERSTONE:XAUUSD FXOPEN:XAUUSD TVC:GOLD

#GOLD buy limit in M5we will buy GOLD @ 3278.60 with the small SL @3274.00
target is 3285 and 3295
we will see
The rebound short-selling trend remains unchangedFrom the 4-hour analysis, the upper short-term resistance is around 3297-3301, and the pressure at 3315-3316 is paid attention to. The pressure at 3324 is focused on. In terms of operation, the rebound continues to be the main short and the trend is downward. The short-term support below is around 3250-3255. The overall main tone of high-altitude participation remains unchanged relying on this range.

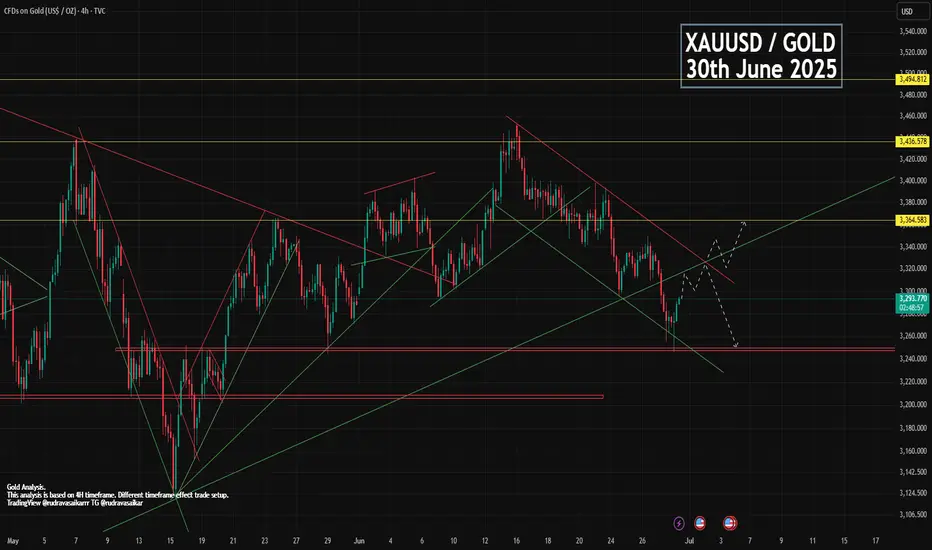
GOLD 30th JUNE - MONTH-END BULLISH OR BEARISHDue to war no update on gold, gold made bolt move downward. Slowly war has been becoming calm but no good news about it has been stopped completely. But you can see some great and correct structure in gold chart where you can find amazing entry and exit points. Gold lower was 1246 since then. Now gold is trading in bullish flag and expecting to breakout. And after breakout we can expect a big move upward.
Key point.
Support - 3248, 3272, 3289
Resistance - 3298, 3313, 3332, 3349
Comment and like for analysis. Love it then follow
Any Query Reach Us or comment down.
Follow for more updates.
Rudra Vasaikar Wishes You A Great And Very Amazing Trading Life. Trade Safe, Trade Right.
RISK WARNING 🔴 🔴 🔴
There is high risk of loss in Trading Forex, Crypto, Indices, CFDs, Features and Stocks. Choose your trade wisely and confidently, please see if such trading is appropriate for you or not. Past performance is not indicative of future results. Highly recommended - Information provided by Rudra Vasaikar/Pro Trading Point are for Educational purpose only. Do your investment according to your own risk. Any type of loss is not our responsibility.
HAPPY TRADING.
"The Great Gold Heist" – XAU/USD Master Plan🏆 "The Great Gold Heist" – XAU/USD Master Plan (High-Risk, High-Reward Loot!) 🚨💰
🌟 Attention, Market Robbers & Money Makers! 🌟
Hola! Oi! Bonjour! Hallo! Marhaba! 🤑💸
🔥 Based on the legendary Thief Trading Strategy (technical + fundamental heist tactics), here’s our blueprint to STEAL massive profits from the XAU/USD (Gold vs. Dollar) market! 🔥
🎯 The Heist Plan (Long Entry Setup)
Entry Point 📈: *"The vault is UNLOCKED! Swipe bullish loot at any price—but for a cleaner steal, set Buy Limits within 15-30M recent swing lows/highs. ALERT UP! ⏰"*
Stop Loss 🛑: "Thief’s SL hides at the nearest swing low (3H TF: 3250.00) OR below the last daily candle wick. Adjust based on your risk appetite & lot size!"
Target 🏴☠️: 3490.00 (or escape early if the cops—err, bears—show up!)
⚡ Scalper’s Quick Loot Guide:
"Only scalp LONG! Rich? Go all-in. Broke? Join the swing traders & rob slow ‘n’ steady. Use Trailing SL to lock profits!"
📊 Market Status:
XAU/USD (GOLD) – Neutral (But Bullish Sneak Attack Likely! 🐂💥)
"The heist is ON, but watch for traps—overbought zones, consolidation, and bearish robbers lurking!"
🔍 Pro Thief Moves:
✅ Fundamentals Matter! (COT Reports, Geopolitics, Macro Data, Sentiment—check our BIO0 for the full loot list!) 🔗👉🏻☝🏻
✅ News = Danger! Avoid new trades during releases. Trail your SLs to protect stolen cash! 📰🚨
💖 Support the Heist Crew!
"Hit the BOOST BUTTON 💥 to strengthen our robbery squad! More boosts = easier money steals daily!"
🚀 Stay tuned—another heist drops soon! 🐱👤💎

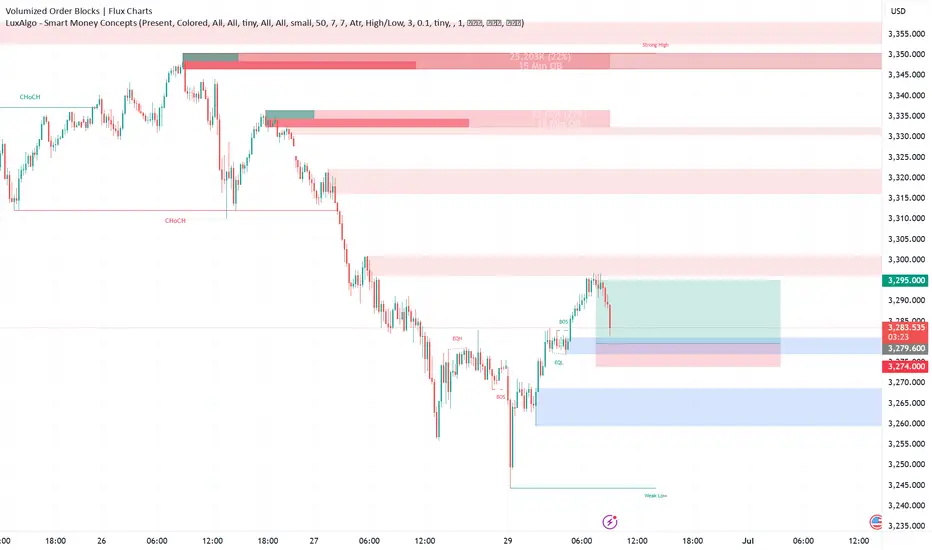
Gold's 3290-3300 Support : Next Week Aims for Gap-Up Retest Last week, gold opened with a gap-up on Monday 🔼, then trended downward 🔽.
⚡ Notably, the 3290-3300 support zone held firmly from Monday to Thursday, demonstrating strong resilience.
🌱 The price plunged to around 3255 on Friday but rebounded promptly.
🔥 For next week, the opening may surge toward the 3290-3300 zone, warranting close attention.
🚀 Buy@3260 - 3270
🚀 TP 3280 - 3290 -3300
Accurate signals are updated every day 📈 If you encounter any problems during trading, these signals can serve as your reliable guide 🧭 Feel free to refer to them! I sincerely hope they'll be of great help to you 🌟 👇

XAUUSD 30/6 – 4/7/2025: Selling Pressure Builds - In the past week, gold OANDA:XAUUSD has been under consistent selling pressure due to the following key macro factors:
- The U.S. Dollar Index (DXY) TVC:DXY surged, raising the opportunity cost of holding gold and leading to widespread sell-offs.
- 10-year U.S. Treasury yields hovered around 4.30%–4.35% , reinforcing expectations that the Fed will keep rates higher for longer.
- Core PCE data for June indicated that inflation remains elevated, reducing the likelihood of imminent rate cuts by the Federal Reserve.
- Geopolitical tensions in the Middle East have temporarily eased, diminishing gold’s safe-haven appeal in the short term.
➤ As a result, these combined factors are applying downward pressure on XAUUSD, especially after price decisively broke the 3,300 USD support zone.
1. Technical Analysis of XAUUSD – Daily Timeframe
On the D1 chart:
- Price has broken below the key support zone 3,300 – 3,331 USD, confirming a short-term bearish structure.
- The Fibonacci retracement from the 3,399 peak to the 3,295 low has completed its pullback to the 0.5–0.618 zone (3,345 – 3,359 ) but was strongly rejected by sellers.
- Price is now trading below both EMA20 and EMA50, indicating strong bearish momentum.
- RSI has turned back under 50 and has not yet reached oversold territory, suggesting further downside potential exists.
2. Key Resistance and Support Zones for XAUUSD
Technical Role ( 3,345 – 3,359 )
- Major confluence resistance (Fibonacci 0.618 + supply) ( 3,295 – 3,300 )
- Immediate resistance zone (post-breakdown retest) ( 3,260 – 3,235 )
- Short-term support and potential buy interest ( 3,223 – 3,205 )
- Strong medium-term support (Fibonacci 1.0 + April lows)
3. Trading Strategy for XAUUSD This Week (30/6 – 4/7/2025)
Strategy 1 – Favor Short Positions Aligned with Bearish Momentum
Entry: Sell near 3,295 – 3,300 (anticipating resistance retest)
Stop Loss: 3,304
Take Profit 1: 3,290
Take Profit 2: 3,285
Take Profit 3: 3,275
Strategy 2 – Countertrend Buy at Key Support with Confirmation
Entry: Buy near 3,235 – 3,240 only if bullish reversal candles (pin bar or bullish engulfing) appear on H4 or D1
Stop Loss: 3,230
Take Profit 1: 3,245
Take Profit 2: 3,250
Take Profit 3: 3,260
Ps : XAUUSD is currently in a downward correction phase, with the next target zone lying between 3,235 – 3,260 USD. The inability to hold above 3,300 confirms that sellers remain in control. The most favorable approach this week is to sell on rallies, especially near former support-turned-resistance zones.
Stay vigilant, follow updated price action closely, and strictly manage risk to protect your capital.
Follow for more high-probability strategies throughout the week – and save this idea if you find it valuable to your trading journey.
Analysis by @Henrybillion

Next Week Aims for 3300 Break💎 Last week, gold opened gap-up on Monday 🔼 but then trended lower 🔽. However, the 3290-3300 support zone remained robust from Mon-Thu ⚡. It plunged to ~3255 on Fri before rebounding 🌱. Next week's open may surge to 3290-3300 🔥!
🚀 Sell@3260 - 3270
🚀 TP 3280 - 3290 -3300
Accurate signals are updated every day 📈 If you encounter any problems during trading, these signals can serve as your reliable guide 🧭 Feel free to refer to them! I sincerely hope they'll be of great help to you 🌟 👇

XAUUSD: We must adapt to the market conditions! Bears in ChargeGold prices dropped as Trump announced a ceasefire between Iran and Israel, causing a significant decline. We anticipate this trend to persist, as recent price data, including volume and price momentum, indicates a strong seller’s control in the current market conditions. We have two targets for you to set your own based on your analysis, along with a stop-loss based on your strategy.
We appreciate your unwavering support throughout the years. Please like and comment.
Team Setupsfx_
❤️🚀

Gold Rebounds After Filling Gap >> Bullish Continuation in SightHello guys!
Gold (XAU/USD) is showing signs of strength on the 4H chart after filling a key gap around the $3,290 level and bouncing off it with bullish intent.
🔹 What I see:
– Price previously broke out of a broad descending channel, flipping the structure bullish
– After forming a rising wedge, Gold corrected lower and filled the gap
– The zone around $3,290 acted as solid support, and the current bounce suggests bulls are regaining control
📈 Outlook:
If this bounce holds and momentum builds, the next area of interest is clearly marked:
🎯 First Target: $3,466 – an area of prior structure and possible supply
📍 Current Price: $3,329
🟢 Bias: Bullish (above $3,290)
🔴 Invalidated below: $3,244
This setup offers a favorable risk-to-reward opportunity if the structure continues holding. Keep an eye on price action near the recent local highs for confirmation.

XAUUSD ( Gold) ( RFI Level entry) We need to wait for a test of this RFI level, as well as a confirmed break inside it on the lower timeframes. Otherwise, let the price go without us.

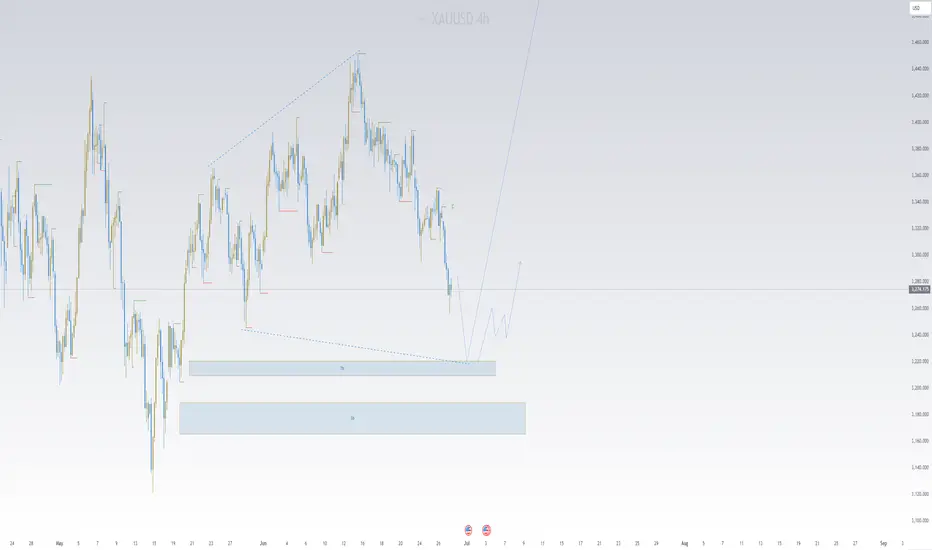
Gold Trade Setup - 27/Jun/2025Hi Traders,
I expect this pair to go Up after finishing the correction.
1) Need to wait for market to show changing of the direction.
2) The current move can be just a part of a correction or an impulse in itself. Going to follow the market behavior at my zones.
How to Enter : Look for engulfing with in the SL zone.
Gold Analysis and Trading Outlook – June 27Good morning, everyone!
Yesterday, gold encountered resistance in the 3348–3352 zone and fell back to around 3310 before rebounding toward the 3336 resistance area. Today’s session opened with renewed weakness, and so far, the overall price action has closely followed our expectations. Whether it was selling near resistance, buying after the dip, or shorting the rebound, each opportunity yielded solid profits.
Some traders have asked about my strategy’s win rate. Those who’ve followed consistently already know—the overall win rate has remained above 80%, with very few instances of error. Even in the rare case of a misjudgment, I apply specific recovery strategies to minimize risk and avoid large losses. That’s the core reason why I’m confident I can help many traders.
Technically, the daily chart still shows a bearish trend, and prices are now approaching the key 3300 support zone. While the current geopolitical uncertainty adds complexity, it doesn't prevent us from executing flexible intraday trades. In fact, range-bound markets can still be highly profitable with a disciplined approach.
Key intraday levels to watch:
Dynamic support: 3318–3313
Major support: 3300–3287
Resistance levels: 3336, 3348–3352, and 3370
Today’s trades can continue to focus on these levels, using a sell-high, buy-low strategy with flexibility.

"Gold Vault Breach! XAU/USD Heist Plan in Motion"🏴☠️💰 XAU/USD Gold Heist Blueprint 💰🏴☠️
“The Vault’s Open… Time to Load Up!”
🌟Hi! Hola! Ola! Bonjour! Hallo! Marhaba!🌟
Dear Money Makers & Market Robbers 🤑💰💸✈️
Get ready to execute the Golden Robbery with style and precision! Based on our 🔥Thief Trading Style🔥 using both technical & fundamental weapons, we’ve decoded the latest gold vault password: XAU/USD (Gold vs USD) is showing bullish bias!
🎯 Heist Instructions:
📈 Entry Point –
“The vault is wide open!”
Enter long anytime — but for the sharp shooters, place buy limits on the most recent 15/30min swing lows or pullback zones for a stealthier entry. Let the retracement pull the guards away 😏🔐
🛑 Stop Loss –
🔒 Set your Thief SL just below recent swing lows on the 4H timeframe (around 3310.0).
🔧 Adjust based on risk tolerance, lot size, and number of open trades — every heist has its escape plan!
🏁 Target Zone –
🎯 Aim for 3395.0 — or vanish before the cops show up!
Trail the stop as you go and don’t get greedy — wealth is preserved when exits are clean! 🏃♂️💨
🧲 Scalper's Advisory:
Only steal on the Long Side! Bulls are funding this operation.
💼 Big pockets? Dive in.
💳 Small stack? Swing with the pros & follow the plan.
🎯 Use Trailing SL to keep the loot safe.
📊 Market Insight – Why We Rob Gold Now?
XAU/USD shows bullish momentum 🐂 backed by:
Macro & Fundamental Data 🧠
Geopolitical & Intermarket Trends 🌍
COT Reports & Sentimental Outlook 💼
Dollar Weakness + Safe Haven Flow 💸
📚 Always cross-check the news wires & reports to validate the path! Fundamentals are the lockpick tools behind every breakout! 🔓📈
⚠️ Stealth Warnings:
📆 News Events = Increased Surveillance!
🚫 No new entries during high-volatility news drops.
🛡 Use Trailing SL on live trades to secure the bag.
💖 Wanna Support Our Heist Style?
Smash that 🚀 BOOST BUTTON 🚀
It fuels our Thief Army and helps you & your crew loot the market with confidence and flair!
Every day’s a new caper — follow the plan, manage your risk, and stay outta jail! 🏆💪🤝🎉
🔐 See you in the next Robbery Blueprint — Stay Locked & Loaded!
🐱👤💼📈💣💸

XAUUSD:Go long
Short - term first do a rebound.
Trading Strategy:
BUY@3283-86
TP:3297-3304
More detailed strategies and trading will be notified here ↗↗↗
Keep updated, come to "get" ↗↗↗

Analysis and layout of the latest gold trends during the day📰 Impact of news:
1. PCE and Consumer Index
📈 Market analysis:
Judging from the 4H chart, the Bollinger Bands are closing and the MACD is showing a trend of forming a death cross, indicating that the short-selling momentum is still relatively strong in the short term. However, as the overall upward structure has not been destroyed, there is still a possibility of a rebound and repair in the future. During the day, we need to pay special attention to the support strength of the MA5 and MA10 moving averages. It is recommended to adopt the idea of shorting at high levels and going long at low levels. The key support below is the 3305-3295 area, and the upper resistance is the 3340-3350 range. However, judging from the chart, in the short term, there may be a rebound near 3313. At present, it has indeed rebounded to around 3319 as expected. If it falls weakly to this week's low of 3295, you can buy if it does not break. On the whole, if it rebounds to 3335-3345, you can consider shorting, and if the support below 3305-3295 is not broken, go long. Today is Friday, and as it is near the end of the month, market liquidity is strong. Please be cautious in your operations today and be sure to set stop losses strictly.
🏅 Trading strategies:
SELL 3335-3345-3350
TP 3320-3315-3300
BUY 3305-3295
TP 3310-3320-3330
If you agree with this view, or have a better idea, please leave a message in the comment area. I look forward to hearing different voices.

XAUUSD: Bearish Trend, Key Support at $3,295Market Overview
In today’s trading session (26/06/2025), XAUUSD shows continued downward momentum. Gold prices are currently hovering around $3,302.05, with a slight drop of 0.01%. The intraday price range has been tight, between $3,330.00 and $3,350.00, indicating a battle between the buyers and sellers around the short-term equilibrium zone.
Recent price action suggests that after a brief recovery, gold is once again encountering resistance at the $3,350.00 level. In the coming hours, a decisive breakout either above this resistance or below current support will dictate the market’s next move.
Key Technical Levels to Watch:
Support Levels: The first significant support is at the $3,295.37 level (50% Fibonacci retracement), with the next support at $3,296.60 (61.8% Fibonacci retracement), followed by a crucial level at $3,300.56.
Resistance Levels: The primary resistance area lies around $3,350.00, with the second resistance at $3,327.72, which coincides with the 3.618 extension of the previous price swing.
Price Action Analysis
As seen in the chart, XAUUSD is currently trading below both the 50-period (blue) and 200-period (yellow) moving averages, indicating a strong bearish trend. The price action is forming a series of lower lows and lower highs, reinforcing the downtrend.
Bearish Trend Continuation: A break below the support at $3,295.37 could signal further downside towards $3,290.00 or even $3,275.00. The yellow trendline indicates the overall bearish direction, and any failure to hold above $3,300.00 could trigger additional selling pressure.
Fibonacci Retracement Levels: Price is testing the 50% and 61.8% Fibonacci levels. A rejection at these levels could cause a pullback towards lower support zones, confirming the bearish outlook for the short term.
Volume Analysis
The volume chart shows relatively low volatility, with decreasing volume during the price pullbacks. This suggests that there is not enough buying interest to push the price higher, and the market may be more inclined towards bearish continuation in the near term.
Market Sentiment
Currently, the market is undecided. The recent price action suggests that traders are waiting for a confirmation of direction. The next few hours are critical in determining if the downtrend will continue or if we will see a short-term bounce at one of the key support levels.
Trading Strategy
Short Position: A break below $3,295.37 would be an excellent opportunity to short XAUUSD with a target at $3,290.00, and further down to $3,275.00.
Long Position: Only consider long positions if XAUUSD manages to break above $3,350.00 decisively, with the next target near $3,375.00.
Conclusion
XAUUSD remains under pressure, and unless there’s a strong reversal at support levels, the bearish momentum could continue in the short term. Traders should monitor the key levels mentioned above closely to adjust positions accordingly.

Bulls and bears are anxious? Rebound continues to empty📰 Impact of news:
1. Initial unemployment claims data
📈 Market analysis:
Gold is in a sideways consolidation near 3320 in the short term. The market has no clear direction for the time being, and the long and short positions are in a tug-of-war. The hourly line rebounded to 3328 and then fell back again, suggesting that there is still room for short-term retracement. The current operation needs to focus on key points: if it rebounds to the 3320-3330 resistance area, you can consider entering short positions again. If the market continues to decline, focus on the 3300-3290 support range. If it stabilizes, long orders can be arranged. The overall idea is to maintain a volatile market. Before effectively breaking through 3350 or falling below 3290, high-altitude and low-multiple is still the main strategy.
🏅 Trading strategies:
SELL 3320-3330
TP 3310-3300-3290
BUY 3310-3300
TP 3320-3330-3340
If you agree with this view, or have a better idea, please leave a message in the comment area. I look forward to hearing different voices.
OANDA:XAUUSD FX:XAUUSD FOREXCOM:XAUUSD FXOPEN:XAUUSD TVC:GOLD

6/25 Gold Analysis and Trading ViewGood morning, everyone!
Gold experienced a sharp decline yesterday. Technically, the conditions for a rebound are in place, but since a solid bottom structure has yet to form, a retest to the downside is likely during today’s session.
Key levels to watch:
Resistance zone: 3336–3348
Support zones: Primary support at 3313–3303, with additional support around 3296–3282
Today’s overall strategy remains buying on dips as the primary approach, with short opportunities near resistance as a secondary option.
Key scenario to monitor:
If the price drops to around 3280 but fails to rebound toward 3336, and the daily close ends below 3300, then the buy-on-dip strategy will likely continue into tomorrow.

Gold Short Term OutlookYesterday’s chart analysis played out well.
Price broke above the MA50 and tested the $3,346 resistance zone. However, this zone failed to hold, and gold dropped aggressively toward the $3,306 support.
Once again, price is trending below both the 50 and 200 moving averages, indicating continued bearish pressure.
For now, the $3,306 support is holding. Bulls need to break above $3,330-$3,346 for higher levels to open up.
🔑 Key Levels:
Resistance:
$3,346 • $3,361 • $3,375
Support:
$3,306 • $3,287 • $3,271 • $3,242

Gold: Resistance Validated, Short at 3340-3350 Tomorrow📈 Gold Trading Recap & Tomorrow's Strategy: Resistance Holds, Short Opportunities Persist
💎 Today's newly updated live short strategy hit the TP target successfully! As mentioned earlier, when gold failed to break the support level, we anticipated it to range around 3330—today's trades were precisely centered on this logic. The 3350 resistance was also validated firmly during the session.
💎 Expect further upside in tomorrow's Asian session—recommend continuing short positions within the 3340-3350 range 🚀
🚀 Sell@3350 - 3345
🚀 TP 3335 - 3325 - 3315
Accurate signals are updated every day 📈 If you encounter any problems during trading, these signals can serve as your reliable guide 🧭 Feel free to refer to them! I sincerely hope they'll be of great help to you 🌟 👇

XAUUSD/GOLDThe bullish trend has opened. After the retracement is confirmed, continue to buy and wait for the market to rise and fill the gap.
