Gold (XAUUSD) Weekly Forecast - 16 to 20 June 2025🔥 Gold (XAU/USD) Weekly Outlook | June 16–20, 2025
🧭 Macro & Geopolitical Context
Israel–Iran war (Operation Rising Lion) has escalated: Israeli strikes on Iran’s nuclear and missile infrastructure on June 13, followed by Iranian missile/drone retaliation, have sharply intensified regional conflict .
The safe‑haven bid is in full swing: spot gold surged toward $3,500, breaking $3,400 last week, driven by risk‑off flows and a weaker US dollar .
🧩 Fundamental Catalysts
1. Fed dovish tilt: May CPI/PPI prints came in soft, lifting expectations for rate cuts. No change is expected at the June 18 meeting, but the Fed’s dot‑plot and Powell’s tone offer upside triggers .
2. Technical breakout: Gold has reclaimed key levels—23.6% Fibonacci (~ $3,377) now acts as support, with the next resistance zones at $3,450 → $3,500 .
3. Bank & analyst sentiment: Goldman Sachs sees potential for $3,700 by year-end; Bank of America projects a path toward $4,000/oz .
📊 Technical Setup & Levels
Support: $3,400; next down at $3,377 (23.6% Fibo) and $3,325 (21‑day SMA) .
Resistance: $3,450 → major barrier $3,500 (all‑time high).
Momentum: RSI around 62—leaves room for further upside .
Catalysts to Monitor
June 18 Fed meeting: Dot‑plot, Powell’s press conference.
Any Iran retaliation or widening of the conflict.
Short‑term US data: June CPI, PPI, Retail Sales (especially mid‑week).
USD strength or weakness—dollar reversal could clip gold gains.
Follow for more updates
#XAUUSD #GOLD #Goldanalysis #WeeklyAnalysis #trade
Xauusdlong

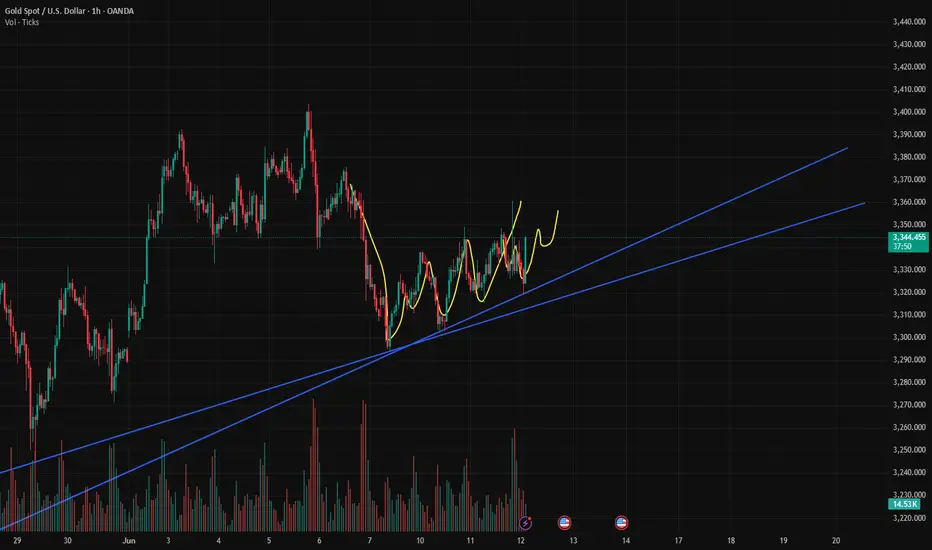
Gold's Wild Ride: Must-Know Price Predictions for Next Week!I can write a lot of smart words but lets make it short, like and sub from you for that)
3 options that i can see:
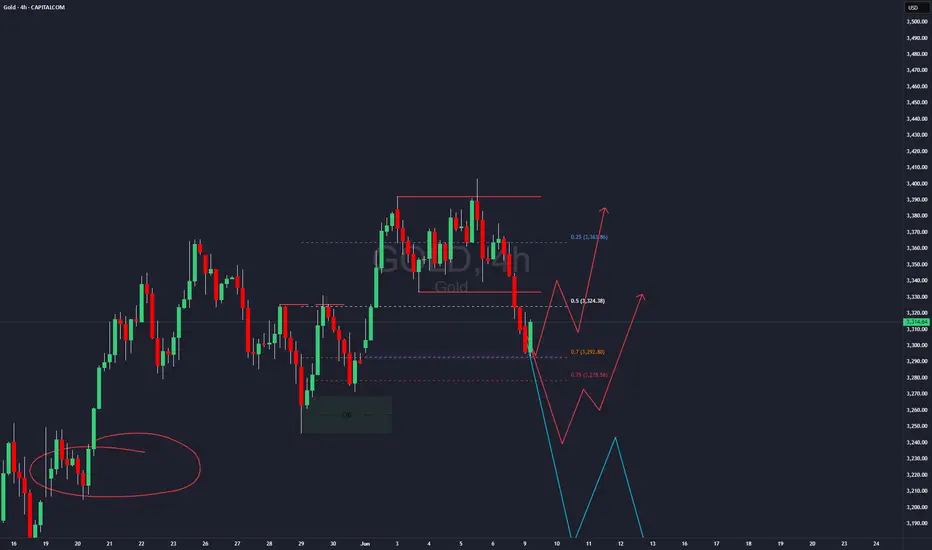
1- dump to Gap at 3292 then bounce target PWH or higher
2 - move a bit lower till PWL and then all the way up till PWH or ATH
3 - cancel all longs, move down below , break 3250 lvl with fvg and second shift on 4h time frame and then gold will keep going lower all the way down to 3k (Low-probability)
The Critical Resistance of Gold at 3500!
The probability of a higher opening for gold next week is relatively high, but I hold a high degree of skepticism towards its sustainability. After three days of fermentation, relevant parties have exhausted all available measures. If there is a higher opening on Monday, chasing the trend is not recommended. The pressure reference for the market in the early week is at the 3462/72 level. From the perspective of the upward channel trend that started from 3200, as long as it does not gap up directly above 3462/72, even if the price touches this area, it will face certain suppression. If it gaps up strongly above 3472 and has a wave of continuation, the previous high of 3500 will also be difficult to break through - at least from the current technical perspective, an optimistic expectation of breaking through 3500 cannot be formed. The most critical influence next week will still be the Fed's speech on Thursday, and the core time point for whether the market can truly break through 3500 will be at that time.
The key support level next week is viewed at 3400. The current price has broken through and stabilized above 3400, and it is expected to operate above this level for a period of time. When the market first pulls back to test around 3400, buying can be continued. Through cycle operation judgment, a high-level consolidation market in the 3500/3400 range is highly likely to form
Humans need to breathe, and perfect trading is like breathing—maintaining flexibility without needing to trade every market swing. The secret to profitable trading lies in implementing simple rules: repeating simple tasks consistently and enforcing them strictly over the long term.
Trading Strategy:
buy@3410-3420
TP:3460-3470

"Due to the economic crisis, the gold market may open with a gap"Due to the economic crisis, the gold market may open with a gap tomorrow."
This upward trend is attributed to increased demand for gold as a safe-haven asset amid geopolitical uncertainties. The conflict has also led to a spike in oil prices and a decline in global stock markets, further enhancing gold's appeal .

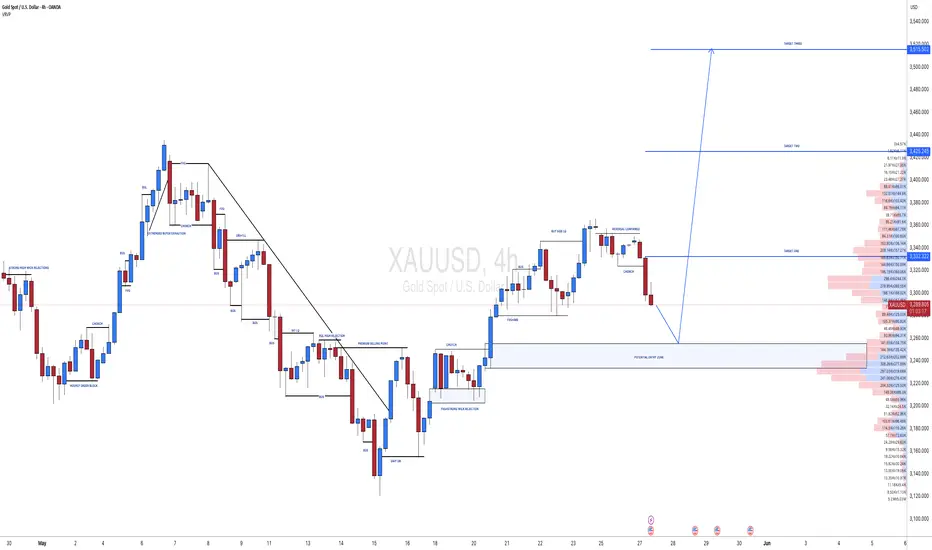
XAUUSD Analysis todayHello traders, this is a complete multiple timeframe analysis of this pair. We see could find significant trading opportunities as per analysis upon price action confirmation we may take this trade. Smash the like button if you find value in this analysis and drop a comment if you have any questions or let me know which pair to cover in my next analysis.

Gold (XAUUSD) Trading Setup – Mid-June 2025 Analysis🔰 Gold (XAUUSD) Trading Setup – Mid-June 2025 Analysis
This chart represents a strategic price action-based setup on Gold (CFDs on Gold – US$/Oz) using a 15-minute timeframe. It includes clearly defined entry zone, support/resistance levels, and profit-taking targets (TP1, TP2) for both bullish and bearish scenarios.
🔍 Current Market Context
Current Price: ~$3431.77
Structure: The price has been in an upward trend with a consolidation phase forming near the key mid-zone.
Highlighted Zone: A decision zone is marked in red (between ~$3422 and ~$3418), acting as the key liquidity zone or breakout area.
📈 Bullish Bias
If price breaks and holds above the red zone:
✅ TP1: $3480
✅ TP2: $3580
These levels act as short- to mid-term bullish targets based on projected extensions of recent upward momentum.
📉 Bearish Bias
If price breaks and holds below the red zone:
✅ TP1: $3320
✅ TP2: $3260
This indicates a possible reversal or correction phase, with targets derived from recent swing lows and support areas.
📌 Trading Notes
The blue shaded areas represent target zones for partial or full exits.
Red zone is the critical breakout decision point.
Ideal for breakout or pullback traders.
Can be combined with volume/confirmation indicators (e.g., RSI, MACD, or price action candles) for entry timing.


XAUUSD:Touching $3500 One More Time Gold is currently extremely bullish and we expect price to touch 3500$ region one more time before it may reverse. you can set your own target based on your risk. Gold will remain volatile in coming weeks and we want all of you to trade safe.
Good luck and trade safe.
Team Setupsfx_

XAUUSD:[GOLD]: First Drop And Then Reverse! Comment Your Views! Gold touched $3350 but was rejected at that level, dropping around 3288. The price shows some minor support at this region, which we’re currently monitoring. If it breaks through, it could touch our buying zone, reversing the trend. You can set three targets based on your own analysis and bias. Please use accurate risk management while trading.
If you’d like to contribute, here are a few ways you can assist us:
- Like our ideas
- Comment on our ideas
- Share our ideas
Team Setupsfx_🚀❤️
#XAUUSD[GOLD]: Massive Boost For Buyers, Incoming More Volume! Gold has been moving as expected in our previous chart. We anticipate a smooth bull market in the coming days, with a target price region of 3400$. There are three specific targets you can aim for.
If you’d like to contribute, here are a few ways you can help us:
- Like our ideas
- Comment on our ideas
- Share our ideas
Team Setupsfx_🚀❤️

#XAUUSD[GOLD]:At Critical Level, Bullish Swing Is Very LikelyHey There Everyone,
So, gold prices took a bit of a dip, hitting 3250 gold. But guess what? They bounced back like a rubber ball and reached 3332! And here’s the exciting part: they broke through that pesky bearish trend line. This means they’re probably going to retest that line to confirm the trend.
Right now, it looks like they’re at a potential retest point, and that’s where things could get really interesting. If strong bullish volume comes in, the price could skyrocket! There are three possible targets here: 3332, 3362, and 3420.
Now, here’s something important to keep in mind: next week, there are some big news and events coming up that could totally shake things up in the gold market. And let’s not forget about price manipulation. If someone tries to mess with the price, it could drop back to 3250 and then reverse course. So, it’s crucial to have backup plans in case of any unexpected twists.
The US dollar is also going to be all over the place due to upcoming news, which could disrupt the gold market and other currencies. So, it’s best to trade cautiously today and next week. The price can be a bit unpredictable, so take your time to do your own analysis and assess your risk before making any moves.
Good luck and trade safely! We wish you all the best in your trading journey!
Cheers,
Team Setupsfx_

XAUUSD:06/06/2025 Update! Gold experienced a decline to 3314 following the release of unexpectedly strong NFP data. However, this decline is unlikely to lead to further price drops below 3314. This is primarily due to the ongoing turmoil within the president’s own political party, which is only just beginning to unfold and will likely intensify in the coming weeks.
Before making any trading decisions, it is advisable to conduct your own analysis. Additionally, the current price action has established an AB=CD pattern, where the price has successfully reversed from point ‘d’. This pattern suggests that waiting for the price to break out could be a prudent strategy for a safe entry.
Three targets have been reasonably set, with the potential to reach target two. However, the target three remains uncertain. The total potential profit from this idea is approximately 1300 pips.
It is also important to monitor the DXY closely. We recommend waiting for the price to complete its bullish correction before taking an entry on gold.
We sincerely hope that this analysis proves beneficial. Please consider liking, commenting, and sharing this post to encourage us to provide more such insights.
Best regards,
Team Setupsfx_

XAUUSD: Another Important Update On Gold Prices! We recently posted an idea analysis on Gold, but our first entry was invalidated due to the heavy sell-off. We expect a smooth move from the current price point. However, please remember that the market conditions will remain volatile and uncertain due to important economic data being published tomorrow.
Good luck, trade safely!
Team Setupsfx_

#XAUUSD[GOLD]:+2200 Pips Big Move! | Setupsfx_|Gold is currently accumulating in smaller timeframes, which suggests it’s in the early stages of a significant move. It’s possible that the price will reverse from either of the entry zones. There are three take-profit areas you can target, but only if they align with your view. This is an educational post, so please don’t blindly follow it – do your own analysis.
Like and comment for more!
Team Setupsfx_

Opportunity for gold price to return to ATH: 3500✍️ NOVA hello everyone, Let's comment on gold price next week from 06/16/2025 - 06/20/2025
⭐️GOLDEN INFORMATION:
Gold prices surged for a third straight session on Friday as geopolitical tensions flared following Israel’s military strikes on Iranian targets, including nuclear facilities and key leadership. The escalation sparked a broad risk-off move across global markets, fueling demand for safe-haven assets. At the time of writing, XAU/USD trades at $3,422, marking a gain of over 1% on the day.
The yellow metal briefly soared to a five-week high of $3,446 before paring gains, as traders took profits ahead of the weekend. The geopolitical unrest, combined with dovish signals from recent US inflation data, has reinforced expectations that the Federal Reserve could begin cutting interest rates later this year—despite improving consumer sentiment. Together, these dynamics continue to support the bullish momentum in gold.
⭐️Personal comments NOVA:
Military tensions continue next week, which is a big boost for gold prices to continue rising above 3500.
🔥 Technically:
Based on the resistance and support areas of the gold price according to the H4 frame, NOVA identifies the important key areas as follows:
Resistance: $3488, $3502, $3562
Support: $3382, $3342
🔥 NOTE:
Note: Nova wishes traders to manage their capital well
- take the number of lots that match your capital
- Takeprofit equal to 4-6% of capital account
- Stoplose equal to 2-3% of capital account
- The winner is the one who sticks with the market the longest

Current Gold Trend Analysis and Trading RecommendationsOn Friday, the strategy of going long on gold at relatively low levels was once again precisely fulfilled. The morning strategy clearly suggested opening long positions within the range of 3400 - 3410. As expected, the price of gold once again surged to around the 3445 level, and profits were successfully secured once more.
The hourly chart of gold shows a volatile upward trend. Driven by risk aversion in the early morning, it surged rapidly but fell back for correction after hitting resistance at 3444 during the European session. Before the U.S. session, it stabilized at 3412 and rallied again. The previous large bearish candlestick was more of a minor shakeout—after washing out floating chips, it has now regained its upward momentum.
Maintain a strongly bullish approach for now. The 3415-3410 range forms a key support zone, and long positions can be continued above this level. Upper resistance remains at 3445-3450; a valid breakout could lead to further gains toward 3475 and beyond. However, be aware that a sustained rally may trigger a pullback due to overbought indicators or divergences. For operations, consider going long near support and exercise caution when chasing highs near resistance
XAUUSD
buy@3405-3315
tp:3430-3450
Investment itself is not the source of risk; it is only when investment behavior escapes rational control that risks lie in wait. In the trading process, always bear in mind that restraining impulsiveness is the primary criterion for success. I share trading signals daily, and all signals have been accurate without error for a full month. Regardless of your past profits or losses, with my assistance, you have the hope to achieve a breakthrough in your investment.

Gold: Monitor Middle East Developments Over the WeekendAmid escalating tensions in the Middle East, risk-off sentiment surged,
sending gold soaring past the 3414 resistance and peaking near 3450,
before retracing and rebounding off the 3414 support zone.
⚠️ While this was a high-volume breakout, it was news-driven,
so keep in mind:
📌 If tensions ease over the weekend, a pullback on Monday is highly likely
📌 If tensions escalate, another bullish run would be expected
—
🔍 Technical Outlook:
🧭 4H chart: 9-count nearing completion — overbought signals building
🧭 2H chart: MACD showing early signs of a bearish crossover; potential divergence forming
🧭 1D chart: Breakout with volume confirms bullish trend, but risk of short-term correction remains
—
📌 Key Price Zones:
🔺 Resistance: 3468 – 3487 – 3500
🔻 Support: 3414 (critical) – 3400 – 3392
⚠️ If broken, next downside targets: 3378 – 3367
—
📈 Strategy Suggestions:
As we head into Monday:
✅ Consider selling on rallies if geopolitical tensions ease
✅ If tensions worsen, follow the momentum — but watch for reversal signs

XAUUSD(GOLD): +1874 PIPS Target| Touching $3600? Gold experienced a significant price surge, driven by the ongoing conflict between Iran and Israel. This heightened uncertainty among global investors led to a price touch of $3445. The current price is accumulating, and we anticipate a strong bullish distribution in the near future. Please prioritise accurate risk management during trading.
Good luck,
Team Setupsfx_

May peace prevail on earthIf geopolitical conflicts continue to fester, gold prices may keep climbing due to safe-haven demand—yet this is far from our wish. 📈
When risk aversion pushes candlestick charts higher, we'd rather see battlefield fires cease by dawn, letting the rhythm of peace replace market volatility. 🌍✨

Bull market continues? Beware of the possibility of a pullback📰 Impact of news:
1. The geopolitical situation between Israel and Iran deteriorates
📈 Market analysis:
In the short term, gold is expected to rise further. Relatively speaking, there is still room for further increase. If it continues to rise today, it depends on the test of 3440 points, which is the opening position of the previous decline. In the short term, pay attention to the 3340-3350 resistance. If it can break through and stay above it, the 3468-3493 line we gave in the morning can still be used as a reference, and it is even expected to reach 3500. But at the same time, the RSI indicator in the hourly chart is approaching the overbought area, so we still need to be vigilant about the possibility of a pullback.
🏅 Trading strategies:
SELL 3440-3450
TP 3430-3420
BUY 3415-3400
TP 3420-3440
If you agree with this view, or have a better idea, please leave a message in the comment area. I look forward to hearing different voices.
TVC:GOLD FXOPEN:XAUUSD FOREXCOM:XAUUSD FX:XAUUSD OANDA:XAUUSD

XAUUSD:Buy or SellRegarding the trend of XAUUSD (gold against the US dollar), it is completely in line with my expectations yesterday. The current price has reached the watershed of 3345. If it breaks through, continue to be bullish. If it does not break through. Then wait for the market to fall.
### Key analysis points
1. Confirmation of resistance breakthrough
- The importance of the 3345 level: If this position is a resistance that has been tested many times recently (such as previous highs, Fibonacci retracement levels or trend line suppression), it may trigger short-covering or new buying after the breakthrough, pushing the price further up.
- Verify the effectiveness of the breakthrough: It is necessary to observe the momentum at the time of the breakthrough (such as accompanied by a large positive line, increased trading volume) and whether the closing price can stand above 3345 to avoid false breakthroughs.
2. Upward target
- First target: If the breakthrough is established, the next resistance may look at the 3360-3380 area (previous high or extended Fibonacci level).
- Medium-term potential: If the trend reversal is confirmed, it may even challenge the 3400 psychological level.
3. Pullback risk management
- Support level: If it fails to break through 3345 or falls back after a false breakout, you need to pay attention to the support below (such as 3320-3300), which is the short-term long-short watershed.
- Stop loss reference: The stop loss of long positions can be set below 3300 to protect the safety of funds.
Trading strategy suggestions
- Aggressive strategy (breakthrough trading):
- Entry: Go long when the price breaks through 3345 and then confirms the pullback.
- Stop loss: Below 3320 (adjusted according to volatility).
- Take profit: Close orders in batches (3360, 3380).
- Conservative strategy (retracement trading):
- Wait for the pullback to the 3320-3300 support area to stabilize and then go long, stop loss 3280.
- The target is the same as the breakthrough strategy.
- Short warning:
If the 3345 resistance continues to suppress and a bearish pattern appears, consider shorting with a stop loss above 3360.
Variables to be added
1. Time frame: Is the above analysis based on the daily or 4-hour chart? Short-term trading requires a smaller cycle to confirm the signal.
2. Driving factors: Pay attention to the Fed's policy expectations, the US dollar index, the geopolitical situation, etc., which may suddenly change the technical pattern.
Summary
Whether the current rebound can continue depends on the effectiveness of the breakthrough of 3345. If successful, it can be bullish, but a strict stop loss is required.
If you need a more detailed entry point analysis or position management plan, please feel free to let me know your trading cycle and risk preference, and I will provide you with a customized strategy.

XAUUSD: Buy or sell now?Continuously update good transactions. Let members make rich profits. How to trade XAUUSD today?
Reference suggestions are as follows:
If it retreats to the range of 3318-3328, consider buying. Target 3345-3360
If it falls below 3310, chase the shorts and choose to sell. Target 3280-3265
For reference only. Do not trade independently.
If you need a more detailed entry point analysis or position management solution, please feel free to tell me your trading cycle and risk appetite, and I will provide you with a customized strategy.

XAUUSD: Buy or sell now?The price of XAUUSD has come to the position near 3345 again. The pressure at this position is very controversial. We need to observe. If this position is stable. Then we need to pay attention to the target of 3360-3385. If it is unstable, we will short and wait for the TP of 3320, which still needs to be emphasized. If you are not sure how to trade. Remember to leave us a message. We will lead you to make better and more accurate transactions, expand profits or recover losses. Do not trade independently. Create greater losses.
Remember to continue to pay attention to the core trading strategy updates of swing trading.