Current Gold Trend Analysis and Trading RecommendationsThe tensions between the U.S. and Iran continue to intensify as the second U.S. nuclear-powered aircraft carrier enters the Persian Gulf. Iran's Defense Minister warned that it would attack U.S. bases if conflict broke out. However, the sixth round of talks between the two sides is scheduled for June 15 in Oman, a development that has raised market expectations for a de-escalation of negotiations. Geopolitical risks are time-sensitive, as if the conflict does not escalate, risk aversion may fade rapidly, and gold could give back its gains.
From a 4-hour technical analysis, the short-term support level below focuses on the 3365 area, with the 3340 level as key support. The main strategy remains to go long on pullbacks to these support levels and follow the upward trend. The key bullish threshold lies at the 3320-3325 zone – any pullback before the daily close breaks below this level presents a buying opportunity, maintaining the primary approach of trend following. We recommend prioritizing long positions on corrections and using short positions on rebounds as a supplement. The short-term resistance above is at the 3400-3405 area, while the short-term support below is at the 3360-3350 range.
XAUUSD
buy@3350-3360
tp:3380-3400
Investment itself is not the source of risk; it is only when investment behavior escapes rational control that risks lie in wait. In the trading process, always bear in mind that restraining impulsiveness is the primary criterion for success. I share trading signals daily, and all signals have been accurate without error for a full month. Regardless of your past profits or losses, with my assistance, you have the hope to achieve a breakthrough in your investment.
Xauusdlong

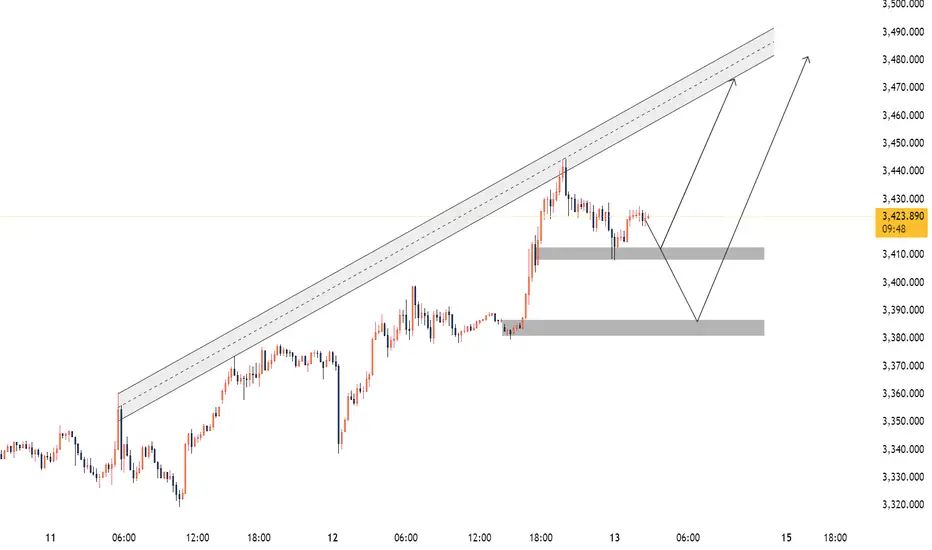
Gold/XAUUSD Possible Move 13 June 2025 The market continues to exhibit strong bullish momentum within a well-respected ascending channel. After an impulsive breakout to the upside, price is now retracing in a healthy corrective move, offering high-probability buying opportunities at two well-defined demand zones.
🔍 Technical Structure:
Price is trending inside an ascending parallel channel, with clear respect for both the median and outer trendlines.
A significant bullish impulse pushed price above previous local highs, suggesting institutional interest and continuation potential.
Currently, price is retracing and approaching two key demand areas that align with bullish continuation setups.
🎯 Key Buy Zones:
✅ Zone 1: 3,408 – 3,412
Minor mitigating demand zone, likely to act as support if the market retraces slightly.
Ideal for aggressive long entries if price shows confirmation (e.g., bullish engulfing, LTF structure shift).
✅ Zone 2: 3,380 – 3,385
Deeper unmitigated demand zone, aligned with a potential liquidity sweep and strong institutional support.
Considered a high-probability entry area for larger impulse moves.
🌍 Fundamental Context:
Recent geopolitical tensions in the Middle East, can lead to sharp intraday moves, with 100+ pip 5-minute candles not being out of the question.
Given this backdrop, demand zones become critical areas for smart money entries as traders seek to align technical levels with macro drivers.
📈 Trade Signal:
Bias: 🔵 Bullish
Buy Zone 1: 3,408 – 3,412
SL: Below 3,395
TP: 3425, 3440, trail till 3,470
R:R: ~1:3
Buy Zone 2: 3,380 – 3,385
SL: Below 3,368
R:R: ~1:4
🧠 Final Note:
Watch for price reaction at both zones. Use LTF confirmation before entry and respect your risk management. With news-driven volatility in play, quick movements are expected, offering excellent trade opportunities for prepared traders.
gold on sell retest#XAUUSD on price reverse, possible expect price to drop below those bearish zone before buying.
Entry on sell 3421, SL 3431, TP 3399-3378.
Below 3378 holds bullish reverse, if H1 and next H1 closes long above 3433 then bullish will reach 3470.

6/13 Gold Analysis and Trading SignalsGood morning, everyone!
Gold rallied to around $3399 during yesterday’s session, accurately reaching our preset sell zone at 3385–3403. Since then, the market has started pulling back, and today’s opening shows signs of accelerated downside movement. However, there are several strong support zones below, with immediate focus on 3378–3368, and further support around 3352–3343.
📉 Technical Outlook:
The current price action suggests the potential formation of a Head and Shoulders pattern. If confirmed, this could trigger a deeper correction towards 3340–3330. A break of these levels would significantly weaken the current bullish structure and open further downside risk.
🌍 Fundamental Drivers:
Today’s inflation-related data releases may add significant volatility;
Additionally, stay alert to any developments in the Middle East geopolitical situation, which could quickly shift market sentiment toward risk-off if escalations occur.
📌 Today’s Trading Recommendations:
✅ Sell Zone: 3410–3420
✅ Buy Zone: 3338–3326
🔄 Intraday Key Reaction Levels:
3403 / 3378 / 3362 / 3355 / 3343
🔒 Recommendation: Market is at a technically sensitive zone. Consider entering positions in batches and maintain strict risk control.

Watch Out for Weekly-Level ResistanceAs news of Israel's strike on Iran’s nuclear facility continues to spread, a surge in risk-off sentiment has driven noticeable gains across safe-haven assets. The escalation of tensions in the Middle East has clearly become a key trigger for current market sentiment. Should the conflict intensify further, oil and other safe-haven assets may see continued upside; conversely, if tensions ease, the retreat of risk aversion could lead to price corrections.
From a technical perspective, gold is currently facing downward pressure from the weekly trendline. If geopolitical tensions persist, gold may potentially rally toward the 3500–3550 range. However, without stronger fundamental support, a significant correction could follow once that level is reached.
On the intraday chart, the price has now broken below the middle Bollinger Band on the 30-minute timeframe and is near lower band support around 3413. MACD and moving average alignment suggest there may still be room to test the 3396–3388 trend support zone. The 1-hour chart remains in a consolidation phase, and while a short-term rebound is possible, selling at higher levels appears to be the safer strategy for today.
As it is Friday and given the geopolitical uncertainties, the potential for weekend risk is significantly higher. It is recommended to reduce exposure before the market closes. If you choose to hold positions over the weekend, be sure to set appropriate stop-losses to mitigate unexpected developments.

GOLD , Making New H.H , 2 Scalping Long Entries, Don`t Miss It Here is my 2 scalping long entries on Gold , if the price close above the highest res , we can wait the price to go back to retest it and then we can enter a new buy scalping trade to create the new H.H . Very Easy And Simple Analysis . Make It Easy Always To Can Continue .

XAUUSD Analysis todayHello traders, this is a complete multiple timeframe analysis of this pair. We see could find significant trading opportunities as per analysis upon price action confirmation we may take this trade. Smash the like button if you find value in this analysis and drop a comment if you have any questions or let me know which pair to cover in my next analysis.

GOLD ANALYSIS BULLISH 13 JUNE 2025
As per previous analysis gold moved in the way as I was expecting. Gold is still strongly bullish, this is all due to geopolitics Iran and Israel war. As #gold made high to 3444 also took correction and now continue to it's bullish rally. Due to this war gold may surge to new high, for today I am again expecting to break yesterdays high. I will recommend please don't trade when there is such war and geopolitics issues because this is just analysis but market behavior is not normal and it will move in unwanted direction. Plan your trade accordingly and do trade. Key points 3402, 3415, 3424, 3440.
Comment and like for analysis. Love it then follow
Any Query Reach Us or comment down.
Follow for more updates.
Rudra Vasaikar Wishes You A Great And Very Amazing Trading Life. Trade Safe, Trade Right.
RISK WARNING 🔴 🔴 🔴
There is high risk of loss in Trading Forex, Crypto, Indices, CFDs, Features and Stocks. Choose your trade wisely and confidently, please see if such trading is appropriate for you or not. Past performance is not indicative of future results. Highly recommended - Information provided by Pro Trading Point are for Educational purpose only. Do your investment according to your own risk. Any type of loss is not our responsibility.
HAPPY TRADING.
#gold #xauusd #xauusdtrading #goldtrading #goldanalysis #forextrading #forex #trendline #goldsignals #goldnews goldlatestanalysis #xauusdtradesetup #forextradingguide #fxgold
beyong technical analysis, chart patterns, gold, goldanalysis, goldideas, goldlong, goldsignals, goldlatestanalysis, goldtrading, goldtradingview, technical indicators, xauusdanalysis,

Gold Bull Run: Wave 5 on the Way!
Elliott Wave Setup – We're in Wave 5, riding a powerful upward channel from the recent Wave 4 low, aiming for ~$3,500–3,600
Key Resistance & Breakout – The $3,497–3,500 area is critical. A clean breakout above this could open the next leg toward ~$3,600–3,700, echoing forecasts from ANZ and Cantor .
Support Level – Immediate support lies around the $3,392 area (recent resistance turned support). A dip back to $3,420–3,440 could provide a strong buying opportunity.
Macro Drivers – Geopolitical tensions (especially in the Middle East) and a soft U.S. dollar are fueling safe-haven buying, matching broader bullish sentiment
.
📈 Outlook: Minor pullback expected, then resumption of rally. Breakout above $3,500 could trigger the next surge.
🛡️ Strategy Tip: Consider buying on dips around $3,420–3,450 with resistance-based stop-loss and targets at $3,500 then $3,600–3,700.

Gold Market Analysis and Trading Recommendations for TodayYesterday, gold surged then pulled back in a washout move triggered by CPI data, before rebounding again in the evening on news-driven sentiment, closing the daily chart bullish. This morning's opening saw further rally breaking new highs, confirming strong bullish momentum. Today's strategy remains buying on dips with the uptrend.
On the 4H chart, gold stabilized at the mid-Bollinger band before rebounding with consecutive bullish candles. Moving averages are bullishly aligned and Bollinger bands are widening—all signaling strong bullishness. However, as the triangle consolidation range remains unbroken, chasing the rally is unadvised. Focus on dip-buying: key supports at 3,345–3,340 and 3,325; resistances at 3,385 and 3,400, where potential shorting opportunities may be considered based on price momentum.
XAUUSD
buy@3340-3350
tp:3370-3380
Investment itself is not the source of risk; it is only when investment behavior escapes rational control that risks lie in wait. In the trading process, always bear in mind that restraining impulsiveness is the primary criterion for success. I share trading signals daily, and all signals have been accurate without error for a full month. Regardless of your past profits or losses, with my assistance, you have the hope to achieve a breakthrough in your investment.

Gold price fluctuates again, layout in the evening📰 Impact of news:
1. Initial jobless claims data favors bulls
📈 Market analysis:
The high of 3392 in the US market fell back for the first time to test the 3377 area to stop the decline and then tried again but failed to break through the 3400 integer mark. It can be seen that this position is very suppressed. The top and bottom conversion of 3377 has become the watershed for bulls to defend in the future market. 3400 is the short-term key pressure and the closing line has a long upper shadow K. If 3377 is lost, the price will fluctuate again. In the short term, focus on the 3390-3400 resistance on the upside and the 3377-3365 support on the downside.
🏅 Trading strategies:
SELL 3385-3395
TP 3370-3360
BUY 3365-3360
TP 3390-3400
If you agree with this view, or have a better idea, please leave a message in the comment area. I look forward to hearing different voices.
TVC:GOLD FXOPEN:XAUUSD FOREXCOM:XAUUSD FX:XAUUSD OANDA:XAUUSD

XAUUSD:Go long
After completing long orders around 3358-3380, the current thinking is still long. The pressure transition has been completed near 3376, which can be regarded as support for now. Go long according to this level.
Trading Strategy:
BUY@3375-79
TP:3390-3400
↓↓↓ More detailed strategies and trading will be notified here ↗↗↗
↓↓↓ Keep updated, come to "get" ↗↗↗

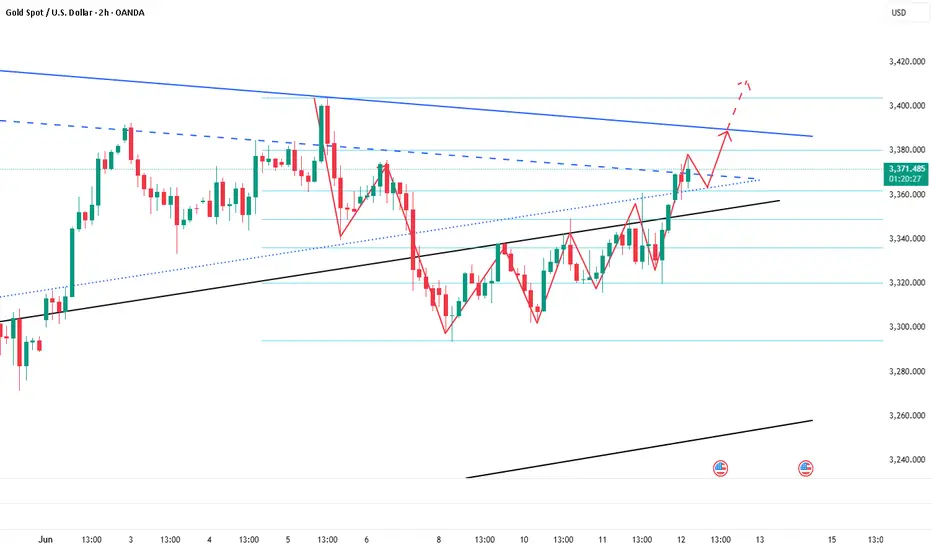
XAUUSD: Analysis June 12XAUUSD is trading within a short-term rising channel.
The market structure remains slightly bullish, with continuous corrections to support zones and then rebounds.
The RSI and MACD indicators have not entered the overbought zone, indicating that there is still room for growth if important support zones are held.
Buy Zone:
1. 3346 – 3350: If the price does not go deep, this is the "retest MA/trendline" zone in the uptrend channel. You can Buy when there is a clear price reaction in this zone.
2. 3330 – 3325: This is a very clear H1 technical support zone. Price may retrace here before bouncing back.
Sell Zone:
3385 - 3390: This is a strong resistance zone on the H1 chart, coinciding with the “Order Block” zone of the sellers. The price may touch and react strongly if there is no breakout momentum.

Great analysing from smart analysis This Wyckoff Accumulation scenario on Gold was like a blueprint—every stage played out almost exactly as anticipated. From the Selling Climax (SC) to the Spring and Test, it was as if the market followed the textbook. Watching this unfold live last night was both thrilling and affirming. Truly, it was a masterclass in market behavior.
Analysis : mohsen mozafari nejad 😎

6/12 Gold Analysis and Trading SignalsGood morning, everyone!
Gold rebounded after dipping to around $3320 yesterday, following a pullback from our previously defined sell zone (3358–3373). Early today, price broke above 3360, reaching a high of 3373, exactly within the resistance zone we expected. The initial rejection from this level aligns well with our plan.
📈 Technical Analysis:
Watch closely whether 3373 can be broken with strong volume. If so, the next key resistance lies around 3385.
However, if price reaches this level without first testing the 3352–3346 support, a rejection is likely. In such case, 3385 may serve as a temporary top and a potential short entry point.
🧭 Trend Structure:
On the 4H timeframe, the bullish momentum remains intact. The last two candles suggest strong buying pressure. If today's fundamentals are supportive, a test of 3400 or higher is possible.
On the 1D chart, the market is still in a technical correction phase. The bounce near 3300 was supported by the long-term trendline. However, if price drops back below 3340 and stays there, a trend reversal becomes more likely.
Focus on the 3314–3296 support zone. If that breaks, a deeper drop is likely, possibly $100 or more, pushing price toward 3200–3190. The decline may unfold as a slow grind or sharp breakdown.
📊 Fundamental Watch:
Today’s Initial Jobless Claims data could have greater-than-usual impact due to the recent CPI release.
The Federal Reserve's Quarterly Financial Accounts Report is also due today and may affect broader market sentiment.
📌 Today’s Trading Recommendations:
✅ Sell Zone: 3385–3403
✅ Buy Zone: 3331–3321
🔄 Intraday Scalping Levels:
3376 / 3358 / 3346 / 3334

Beware of Bear Traps — Avoid Chasing Prices Blindly!Today, gold rallied up to 3380, then retraced to retest the 1H MA60 (around 3340),
before making another strong upward breakout, surpassing the earlier Asian session high.
📌 This upward move was driven by a combination of key factors:
🔸 Trump’s announcement of new tariffs to be imposed within two weeks
🔸 Rising geopolitical tensions in the Middle East, fueling safe-haven demand
🔸 A weaker-than-expected CPI yesterday
🔸 And an upcoming PPI release later today
📉 Current Price Outlook:
🔺 Strong resistance at 3392, closely watched
🔺 Next resistance zone: 3403–3414
🔻 Key support zones: 3360–3350
⚠️ Also note: the 3289 price gap remains unfilled,
which means downside risks haven’t been fully eliminated — avoid chasing rallies blindly!
✅ Trading Strategy:
Stick with the approach:
📌 Buy near key support, sell near known resistance
📌 Stay alert for news-driven bull traps, and manage risk wisely

EURUSD LongHere is our EUR USD Signal that we posted
As you can see it's running nicely at 258 Pips.
EURUSD Buy
📊Entry: 1.13538
⚠️SL: 1.12594
✔️TP1: 1.14732
✔️TP2: 1.16256
✔️TP3: 1.18194
We have 5 big swing trades running at present, all of which comes from our trading strategy that is solely based on pure maths. So far in 2025 we have hit 1 stop loss from over 100 trades.
My point to this post is to encourage you all to keep trying, don't give up. It took us over 2 years to perfect this strategy, and we know it works.
If you want any help just ask me, and I will help you.


Buy gold, it is expected to continue to rise and test 3380-3390After the Asian session began, gold began to rise rapidly, and the original plan to short gold near 3355 had to be cancelled. After gold touched 3374, it fell back slightly, but after retreating to 3357, it rebounded again and broke through the short-term suppression near 3370 again. At present, gold still has the potential to rise further.
According to the current structure, gold has formed an oscillating upward structure, and the lows have been rising. After breaking through the short-term resistance area of 3360-3370, the willingness to rise has strengthened. Gold is expected to usher in a second rise and test the 3380-3390 area. If it breaks through this area, gold is even expected to continue to the 3410-3420 area. As gold rises, the gold support area rises to the 3360-3350 area.
So for short-term trading, we can try to go long on gold while controlling the risk after gold retreats to the 3360-3350 area!
XAUUSD:Go long
Gold bottled out and rebounded, hitting the lowest 3319 line, which just gave us the opportunity to leave the 3320 stop profit. Then, under the stimulation of the news surface, it did not break through the 3375 line. Then, combined with the previous ideas, the next need to do long strategy. Keep an eye on the breakout at 3375 during the day.
Trading Strategy:
BUY@3353-58
TP:3375-84
↓↓↓ More detailed strategies and trading will be notified here ↗↗↗
↓↓↓ Keep updated, come to "get" ↗↗↗

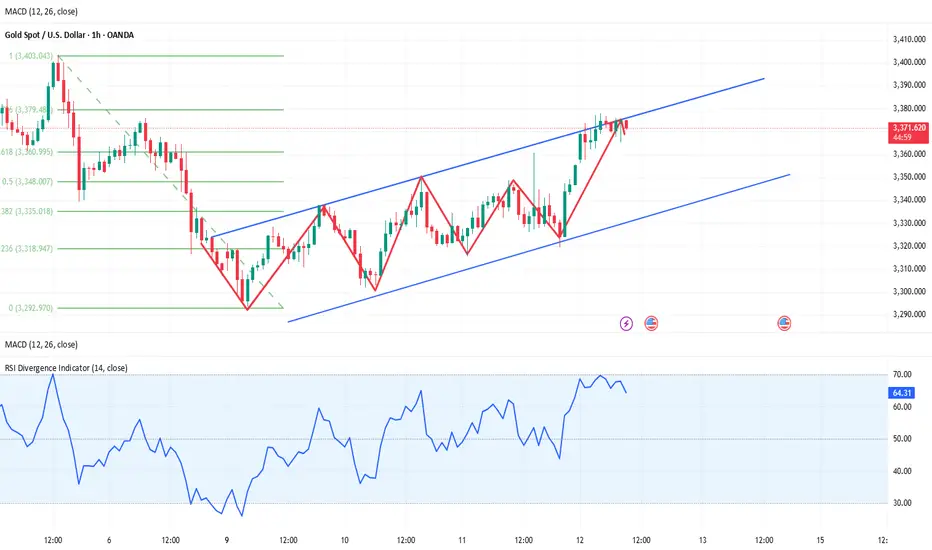
Gold 200% Trading SignalsI'm provided, here’s a breakdown of the buy trade setup and potential Take Profit (TP) levels for XAU/USD (Gold) on the 1-hour timeframe:
🟢 Buy Setup Summary:
Pattern Identified: Bullish wedge (indicates potential breakout upward).
Support Trend Line: Clearly marked under price, showing consistent higher lows.
Breakout Zone: Around 3,378.463 (current resistance area).
Setup Trigger: Buy after bullish breakout above resistance (3,378 area).
📌 Buy Entry:
Entry Price: After confirmed breakout and retest of resistance around 3,378.
🎯 Take Profit (TP) Levels:
1. TP1: 3,390 (psychological round number + minor resistance zone
2. TP2: 3,410 (intermediate resistance)
3. TP3 (Final Target): 3,450 (as per chart label: ~1000 pips move
🔒 Stop Loss (SL):
Below the wedge pattern, possibly at 3,295–3,305, depending on your risk tolerance.
🔁 Trade Management:
Consider trailing SL once TP1 is hit.
Watch for price action around TP1 and TP2 for partial profits or exit signs.
Be cautious around news events that could impact Gold prices (e.g., FOMC, CPI, etc.).
Let me know if you want this translated into a MetaTrader or TradingView script, or help setting alerts for each TP.

Gold 100% Trading SignalsAfter the changes in the first four trading days of this week, everyone is convinced that gold will rise after adjustment. Now that the trend has been strengthened, today we will discuss where the strength of this bullish trend can reach this week. This week, it has been emphasized that the expected rising space within the week will be 3370-3400. It has almost reached 3375. The target of the next wave of gold rise is 3400.
From a technical point of view, the daily line appeared on Wednesday, standing firmly above the middle track of Bollinger, and the moving average system diverged upward. In the 4-hour chart, the golden cross of the random indicator MA5-MA10 continued, which was good for intraday fluctuations and rises; MACD continued to hit the red kinetic energy column. In terms of form, it continued to rise slowly, which was a bullish signal; then it is expected to rise to the upper track high of Bollinger near 3400 under strong pressure. After this round of rising and pulling up, Bollinger opened in the 4-hour chart. Today may be a one-sided trend, and the intraday support is near 3342. After adjusting to 3342 during the day, you can go long and see today's rising space.
Gold operation strategy: It is recommended to go long at 3345-3350, stop loss at 3340, target at 3360-3370; it is recommended to go short at 3400, stop loss at 3410, target at 3380-3370.

Repeated sweeps, gold trend analysis and operation layout📰 Impact of news:
1. Pay attention to the initial unemployment claims data
📈 Market analysis:
Gold price jumped higher in Asian session. The short-term upper pressure is at 3375. Once it breaks, the upward route of bulls will be opened. The RSI indicator in the 1H chart began to retreat after touching the overbought area. Last night's high of 3360 is now a breakthrough, and the previous strong suppression is at 3350. This morning's Asian session was also broken and stabilized. Then 3360-3350 has changed from a suppression position to a support position. Therefore, the next position we should pay close attention to should be around 3360-3350. If it can fall back to 3360-3350 in the future, it is possible to enter the market to do more, but at the same time, it is also necessary to defend 3345. Independent trading requires a SL.
🏅 Trading strategies:
BUY 3360-3350
TP 3370-3380-3400
If you agree with this view, or have a better idea, please leave a message in the comment area. I look forward to hearing different voices.
TVC:GOLD FXOPEN:XAUUSD FOREXCOM:XAUUSD FX:XAUUSD OANDA:XAUUSD