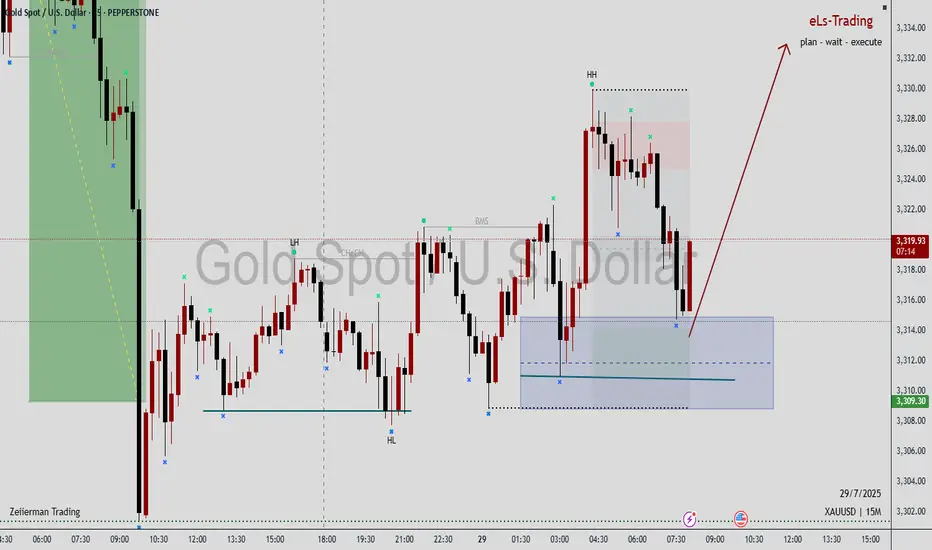
Gold’s Liquidity Hunt Eyes on Bullish FVG Reaction!Gold Analysis – NY Session Outlook
During the New York session, gold created equal highs near recent swing highs, indicating that upside liquidity remains uncollected. Currently, the market is pulling back, targeting liquidity resting below the trendline, along with internal liquidity levels beneath.
If gold continues to move downward and taps into the marked bullish Fair Value Gap (FVG), monitor that zone for any signs of bullish confirmation. If confirmed, there is potential for a further upward move toward the equal highs and beyond, aiming for external liquidity.
Always Do Your Own Research (DYOR).
Xauusdlong

XauUsdThere are two analyses.
As you can see, the overall trend is bullish and long positions have more chances, the important market points are drawn accurately and have high validity.
The red arrow has a 60% chance of occurring and the blue arrow has a 40% chance.
Important market points:
Resistance:
3340
3369
3390
3422
Support:
3303
3280

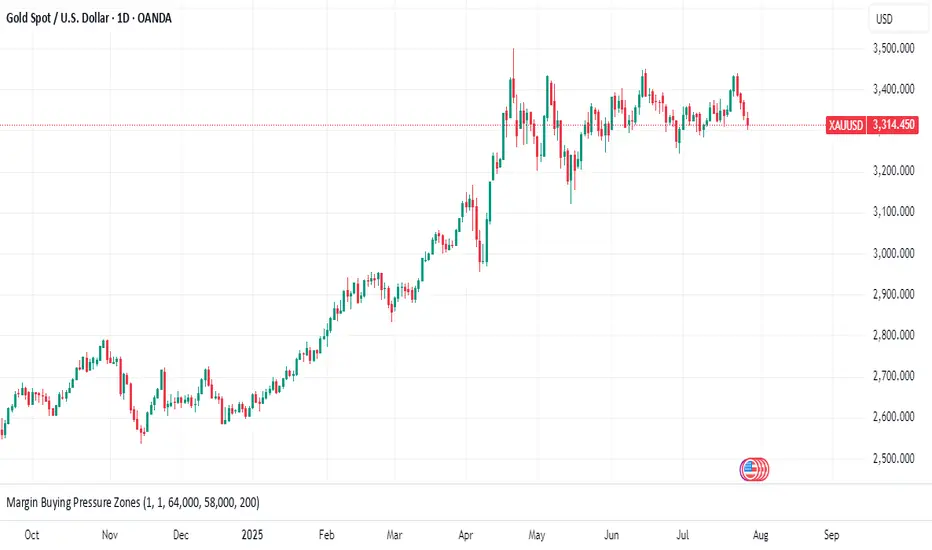
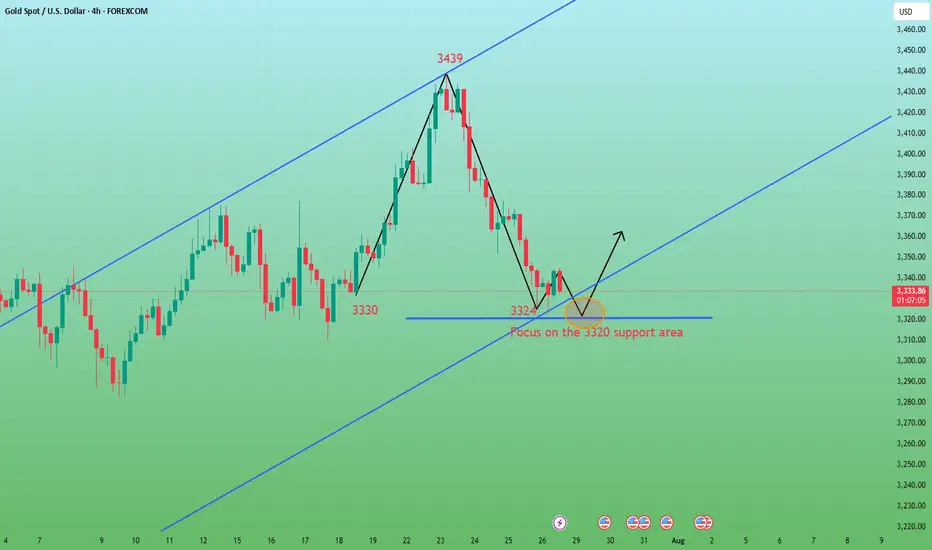
Gold Eyes Rebound Toward $3,438 TargetGold (XAU/USD) is trading near $3,314, approaching support along the rising trend line. A potential bounce could target the $3,438 resistance area, as marked in the chart.

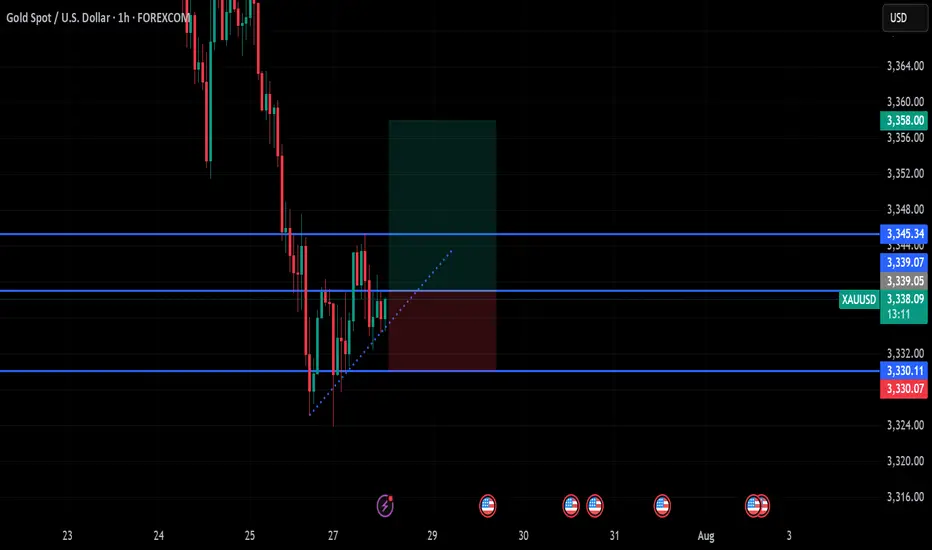
XAUUSD idea 29/07/25We are waiting for our asset to reach our action zone, and based on the reaction, we’ll decide on our next moves.ALWAYS WAIT FOR A CONFIRMATION TO SEE IF THE PRICE VALIDATES THE ZONE.and you what is your vision of the EURUSD its interests me! i wait you in the commentary

gold on sideways#XAUUSD price await double breakout above 3328.6 for bullish to take place. But now we await for any breakout to take trade.
Below 3314 holds sell continuation, target 3296, stop loss 3324.
Above 3328.6 on 2 times breakout will start bullish till 3340.

XAUAUSD ideaWe are waiting for our asset to reach our action zone, and based on the reaction, we’ll decide on our next moves.ALWAYS WAIT FOR A CONFIRMATION TO SEE IF THE PRICE VALIDATES THE ZONE.and you what is your vision of the EURUSD its interests me! i wait you in the commentary
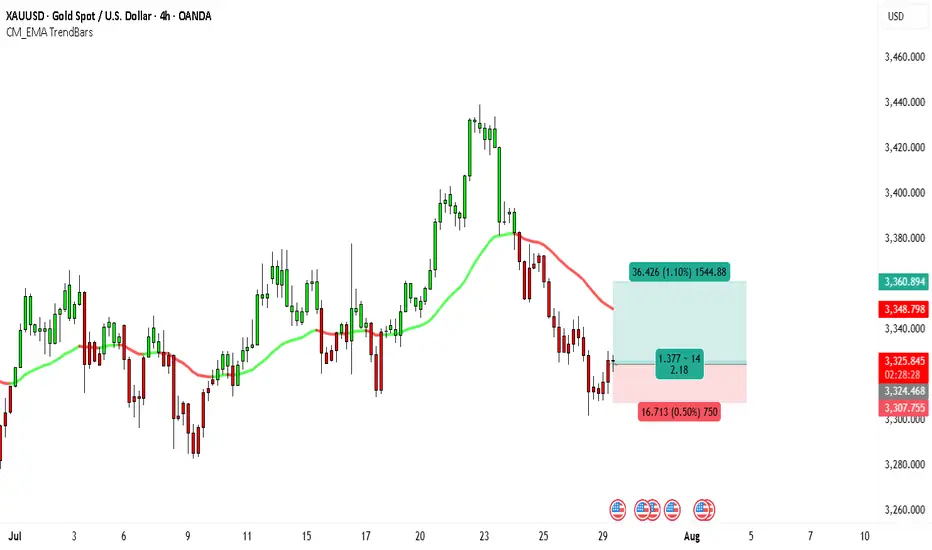
Gold Eyes $3,360 — Is This the Next Breakout?Looking at the 4H chart of XAUUSD, the price appears to be stabilizing after a period of decline, with selling pressure showing signs of exhaustion. The recent candles have smaller bodies, reflecting indecision from sellers and potential accumulation from buyers. Price is holding above the key horizontal support zone around 3,307–3,324, an area that has acted as a strong demand zone in the past. Each time the market dipped into this region, buyers stepped in, which gives the current structure a bullish undertone.
The EMA from your CM EMA TrendBars indicator has flattened out after a downward slope, suggesting that bearish momentum is losing strength. Price is also attempting to retest above this EMA, which, if achieved and maintained, could trigger further buying interest. This aligns with a possible short-term double-bottom pattern forming around 3,307, a common reversal setup if confirmed by a break above nearby resistance levels.
On the broader scale, gold has been in an overall macro uptrend for months. This recent weakness on the 4H chart could simply be a corrective pullback before another leg higher, rather than the start of a prolonged downtrend. If bulls can reclaim the EMA and hold above 3,348, the upside potential opens toward the 3,360 area and potentially higher.
Trading Setup
• Entry: Around 3,324.90
• Target: 3,360.89 (+1.10% / +36.4 USD)
• Stop Loss: 3,307.75 (-0.50% / -16.7 USD)
• Risk-to-Reward Ratio: ≈ 2.18
This setup offers more than double the potential reward compared to the risk, which fits well with a bullish bias. A decisive close above the EMA would serve as further confirmation for the trade.
Gold Price Rally: Why Hedge Funds Are Making Their Biggest Bet Glimmer of Gold: Why Hedge Funds Are Making Their Biggest Bullish Bet in Months
In the complex and often turbulent theater of global finance, the movements of so-called "smart money" are watched with an eagle's eye. When these sophisticated players, particularly hedge funds, move in concert, it often signals a fundamental shift in market sentiment. Recently, a powerful signal has emerged from the depths of the commodities market: hedge funds have dramatically increased their bullish bets on gold, pushing their net long positions to a 16-week high. This aggressive positioning is not a random fluctuation; it is a calculated response to a potent cocktail of persistent geopolitical instability, simmering trade tensions, and a growing conviction that the global economic landscape is tilting in favor of the ultimate safe-haven asset.
The surge in bullish sentiment represents a significant vote of confidence in the yellow metal. It suggests that some of the world's most well-resourced and analytically driven investors are looking past the daily noise of equity markets and are instead positioning themselves for a future where security, stability, and tangible value take precedence. They are not merely dipping their toes in the water; they are making a decisive, leveraged bet that the forces buffeting the global economy will continue to drive capital towards gold's enduring allure. This move has sent ripples across the financial world, prompting investors of all stripes to ask a critical question: What does the smart money see that we should be paying attention to?
Decoding the Data: A Sharp Turn Towards Bullishness
To understand the magnitude of this shift, one must look to the weekly Commitments of Traders (COT) report published by the U.S. Commodity Futures Trading Commission (CFTC). This report provides a detailed breakdown of positions in the futures markets, separating traders into different categories, including "Managed Money." This category, which primarily consists of hedge funds and commodity trading advisors, is a key barometer for speculative sentiment.
The latest data reveals a sharp and decisive increase in bullish conviction. Hedge funds significantly ramped up their gross long positions—outright bets that the price of gold will rise. Simultaneously, they have been closing out their short positions—bets that the price will fall. The combination of these two actions has a powerful magnifying effect on the "net long" position, which is the difference between the number of long and short contracts.
Reaching a 16-week high is particularly noteworthy. It indicates a reversal of previous caution or bearishness and the establishment of a new, more aggressive bullish trend. For months, hedge funds may have been hesitant, weighing the prospects of higher-for-longer interest rates against emerging geopolitical risks. The current data shows that the scales have tipped decisively. This isn't a gradual accumulation; it's a forceful pivot, suggesting a high degree of conviction in the upside potential for gold. This influx of speculative capital acts as a powerful tailwind for the gold price, creating upward pressure as more funds chase the emerging momentum.
The Three Pillars of the Golden Thesis
The coordinated move by hedge funds is not based on a single factor but on a confluence of three powerful, interlocking macro-economic and geopolitical narratives. Each pillar reinforces the others, creating a compelling case for holding gold.
1. The Unsettled World: Geopolitical Risk as a Prime Catalyst
Gold has, for millennia, served as the ultimate barometer of fear. In times of peace and prosperity, its appeal can wane in favor of assets that offer growth and yield. But in an environment of escalating geopolitical tension, its value proposition becomes unparalleled. The current global landscape is rife with such tensions.
Persistent conflicts in key regions continue to create uncertainty, threatening to disrupt energy supplies, shipping lanes, and international relations. The risk of these conflicts widening or drawing in other powers keeps a floor under the demand for haven assets. Beyond active conflicts, the world is witnessing a broader realignment of global power. The rise of multi-polarity and the challenging of the post-Cold War order create a backdrop of systemic instability.
Furthermore, political uncertainty within major economies adds another layer of risk. Election cycles in dominant nations can lead to unpredictable policy shifts on everything from trade and taxation to international alliances. This policy uncertainty makes investors nervous, prompting them to allocate capital to assets that are insulated from the whims of any single government or political outcome. Gold, being a stateless monetary asset with no counterparty risk, is the natural recipient of these capital flows. Hedge funds are betting that these geopolitical undercurrents will not only persist but potentially intensify, making gold an essential portfolio hedge.
2. The Friction of Trade: A Drag on Global Growth
The era of seamless globalization has given way to a period of strategic competition and trade friction. The ongoing trade disputes between the world's largest economic blocs, most notably the United States and China, have moved beyond mere rhetoric and are now an entrenched feature of the global economy. Tariffs, export controls, and national security-driven industrial policies are disrupting long-established supply chains and creating a more fragmented and less efficient global marketplace.
This environment is a significant headwind for global economic growth. The uncertainty surrounding trade policy makes it difficult for businesses to make long-term investment decisions, dampening corporate spending and hiring. Slower global trade directly translates to slower economic growth, which in turn puts pressure on corporate earnings and equity valuations.
In this context, gold shines. As an asset that does not rely on economic growth to generate returns, it acts as a valuable diversifier in a portfolio dominated by stocks and bonds. When growth falters, gold's role as a store of value becomes more pronounced. Hedge funds are positioning for a scenario where persistent trade tensions continue to weigh on the global economy, making riskier assets less attractive and defensive assets like gold more appealing.
3. The Central Bank Pivot: Anticipating Looser Money
Perhaps the most powerful financial driver for gold is the outlook for monetary policy, particularly from the U.S. Federal Reserve. The price of gold has an inverse relationship with real interest rates (interest rates minus inflation). When real rates are high, the opportunity cost of holding a non-yielding asset like gold is also high, as investors can earn a handsome, risk-free return in government bonds. Conversely, when real rates are low or falling, the opportunity cost of holding gold diminishes, making it a more attractive investment.
For the past couple of years, central banks have been in a fierce battle against inflation, raising interest rates at an aggressive pace. However, the market is now increasingly looking ahead to the next phase of the cycle: rate cuts. While the timing is still a matter of debate, the consensus is that the next major policy move from the Fed and other major central banks will be to lower rates to support a slowing economy.
Hedge funds are front-running this anticipated pivot. They are accumulating gold now in expectation that falling interest rates in the future will provide a significant tailwind for its price. Even before the cuts materialize, the mere expectation of looser monetary policy is enough to fuel a rally. Furthermore, there is a persistent fear that central banks might make a policy error—either by keeping rates too high for too long and triggering a deep recession, or by cutting rates too soon and allowing inflation to become re-anchored. Either scenario is bullish for gold, which performs well during both economic downturns and periods of high inflation.
This speculative demand from hedge funds is layered on top of a powerful, long-term structural trend: voracious buying from the world's central banks. For several years, central banks, particularly those in emerging markets like China, India, and Turkey, have been steadily diversifying their foreign reserves away from the U.S. dollar and into physical gold. This "de-dollarization" trend is a strategic move to reduce dependence on the U.S. financial system and to hold a neutral reserve asset in an increasingly fractured world. This consistent, price-insensitive buying from official institutions creates a strong and stable floor of demand for gold, providing hedge funds with the confidence to build their own large, speculative positions on top of it.
Conclusion: A Resounding Vote for a Golden Future
The sharp increase in bullish gold bets by hedge funds is more than just a statistic; it is a story about risk, fear, and the search for security in an uncertain world. It reflects a growing consensus among sophisticated investors that the confluence of geopolitical turmoil, economic friction, and an impending shift in monetary policy has created a uniquely favorable environment for the precious metal.
These funds are acting as canaries in the coal mine, signaling a potential increase in market volatility and a flight to safety. Their aggressive positioning, backed by billions of dollars in capital, can become a self-fulfilling prophecy, driving prices higher and drawing in more waves of investors. As the world continues to grapple with deep-seated structural changes, the decision by the "smart money" to make its largest bullish wager on gold in months is a clear and resounding signal: in the quest for a safe harbor, all that glitters is, once again, gold.
gold on buy reverse#XAUUSD price have multiple reject between the third range, now we expect for breakout to buy.
Above 3339 holds bullish reverse, target 3345-3358. 3345 can reverse back on sell.
Below 3330 on 2 times breakout will drop the price till 3320-3300
After continuous decline, oversold rebound opportunity.Last week, gold showed a trend of rising and falling. The weekly line closed with an inverted hammer and a long upper shadow, continuing the cross-line pattern of the previous week. The short-term rise was obviously blocked. Although the trend line connecting the daily lows of 3247-3282-3309 has been substantially broken, it may continue to fall after testing and sorting. In the short term, we need to focus on the 3348 suppression level and the 3324 support level. If they fall below, they may fall to the 3300/3285 support area. From the current trend, the overall bearish and lack of rebound momentum, the weak pattern may continue, and only when the price falls to a specific position to complete the bottoming will it attract entry.
Therefore, it is recommended to maintain a bearish mindset. The hourly line shows that the long and short conversions are relatively frequent. The upward trend channel was maintained in the first three days, but all gains were given up in the next two days and the downward channel was rebuilt. Given that both the 4-hour and daily lines have fallen below the key support level, 3348 has become the key point for today's bearishness, and it is necessary to change the mindset in time and go short.
XAUUSDHello Trader ❤
I expect the price to start growing from these two areas🚀
The stop of this scenario is also visible in the image above❌
I hope you make the most of it...

Gold may rebound.From the 4-hour analysis chart, we focus on the short-term suppression of 3370-75 on the top, and focus on the suppression of 3397-3400 on the first line. After all, gold fell and broke through here this week, and then fell southward. Below, we focus on the support of 3312-18.

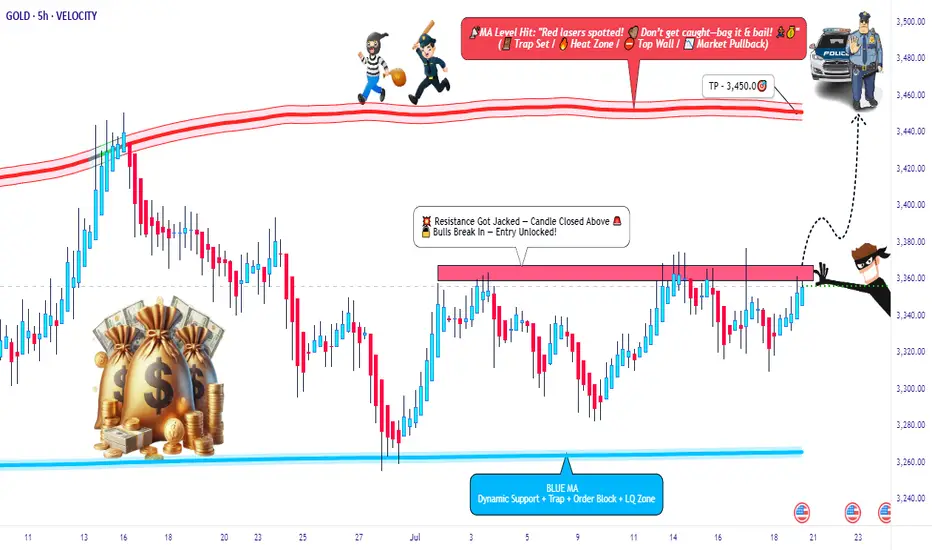
XAU/USD Breakout Playbook – Rob the Market!🚨💰 GOLD HEIST IN MOTION! | XAU/USD Thief Trading Strategy (Breakout Edition) 🏴☠️
🧠 Strategic Mindset | Not Your Average Chart Talk
Yo Market Bandits & Pip Hunters – welcome to the underground playbook!
This isn't your grandma’s chart breakdown – it’s a Thief Trading Takedown on XAU/USD (Gold), where we’re not chasing the market… we’re outsmarting it.
THE MASTER PLAN: Enter Like a Ghost, Exit Like a King 👑
📍 ENTRY POINT – The Break-In Begins!
💥 Breakout Level: Watch for 3370.00 resistance to crack – this is our green light.
🕵️♂️ Entry Style:
• Buy Stop above MA resistance zone (fast & clean)
• OR Buy Limit near swing low zones after confirmation pullback (sniper entry)
🧠 Thief Tip: Wait for the breakout to happen. No orders, no SL before it. Patience is profit.
🔄 Layer the Entry:
• Deploy DCA (Dollar Cost Averaging) or scaling entries with precision
• Build positions like stacking cash bags — smart, silent, and calculated
🛡️ PROTECT THE LOOT – Stop Loss Logic 💣
📍 SL Guide: 3310.00 (4H swing low – update as price structure evolves)
🔥 SL ONLY comes after breakout. Set it too early? That’s how you get caught.
⛔ No pre-breakout orders. No early SL. Stay invisible till it's go time.
🎯 THE ESCAPE – Profit Like a Phantom 🚀
💸 Take Profit: 3450.00
📉 Scalpers: Trail SL as price pushes – never give back stolen pips
🌀 Swing Traders: Monitor resistance layers – don’t let the bulls turn on you
🧭 CONTEXT – Why This Setup?
🔍 Macro Snapshot:
• Trend: Neutral/Bullish Lean
• Influencers: COT reports, geopolitical tension, dollar flows
• Sentiment Shifting – watch the herd, but don’t run with it
🗞️ News Risk: Don’t get wrecked by events! Avoid entries during high-impact news.
🚨 Trailing SL is your best weapon during volatility.
⚡ POWER UP THE CREW – Support the Movement
💬 Drop a comment, hit the 🔥 like button, and share with your trading gang
More Thief Trading blueprints coming soon – bigger breakouts, cleaner setups
⚠️ STAY SHARP, THIEVES!
This ain't financial advice – it’s an outlaw’s edge on the market.
Trade smart. Risk well. Protect the bag.
🏴☠️ XAU/USD GOLD HEIST IN PROGRESS... Join the Movement. Let’s Rob the Market.
GOLD (XAU/USD) SHORT TRADE PLAN
July 25, 2025
Trade Overview (My setup)
- Direction: Short (SELL)
- Entry Price: $3,330
- Take-Profit: $3,270
- Stop-Loss: $3,370
- Lot Size: 0.18 lots (18 oz)
- Risk: $720
- Reward: $1,080
- Risk/Reward Ratio: 1.5 : 1
Technical Analysis Supporting the Bearish Bias
1. Price Structure & Trend
- Descending channel observed on the 4H chart - strong short-term bearish signal.
- Series of lower highs and lower lows confirms bearish trend.
- Price is testing $3,325-$3,300 support - breakdown opens downside to $3,270-$3,250.
2. Key Support/Resistance Zones
- Key support: $3,300 being tested.
- Resistance: $3,360-$3,370 zone - logical stop-loss location.
3. Indicator Confirmations
RSI (4H): ~35-40, bearish territory, no bullish divergence.
Moving Averages: Price below 50 EMA and 200 EMA - bearish crossover.
MACD: Bearish crossover, histogram confirms selling momentum.

Gold Trade SetupI will risk!!!
It seems we are near at the end of correction wave...
The first target R/R is 2 and the second is 4...


Gold – 24 July: Watching H4 OB Zone for Bullish ReversalGold – 24 July Outlook
Watching H4 OB Zone for Potential Reversal
📌 Recap of 23 July Trade:
As outlined in yesterday’s analysis, the M15 Order Block ( 3417–3412 ) held well. The market reacted precisely from this level, and our long setup successfully hit the defined 120-pip target .
However, after reaching a high near 3434 , the price failed to break above and instead rejected sharply, breaking the recent M15 higher low — a key structural sign that signals the start of a possible H4 pullback phase.
🔍 Current Market Context:
Trend Overview:
While the overall bias remains bullish, this break of M15 structure suggests short-term weakness and a corrective move in progress on the H4 chart.
Key Zone in Focus:
H4 Order Block Zone: 3359 – 3345
This is a critical zone to watch today. The market is currently trading around this area, and it could act as a potential reversal point where the uptrend resumes.
🎯 Trading Plan:
– Closely monitor the price action within the 3359–3345 zone.
– If price respects this zone and LTF (e.g., M1) shows signs of structure flip or ChoCH + BoS , it could present a fresh long setup opportunity.
– As always, only act on the trade if multiple confluences align — don’t anticipate, let the market confirm.
📈 Summary:
Bias: Watching for a bullish reversal from the 3359–3345 zone.
Setup Condition: Wait for clear LTF confirmation before entering.
Risk Management: Stick to 1:3 RR — 40 pip SL and 120 pip TP as per system.
Let the market come to your setup. Patience is your greatest edge.
📘 Shared by @ChartIsMirror

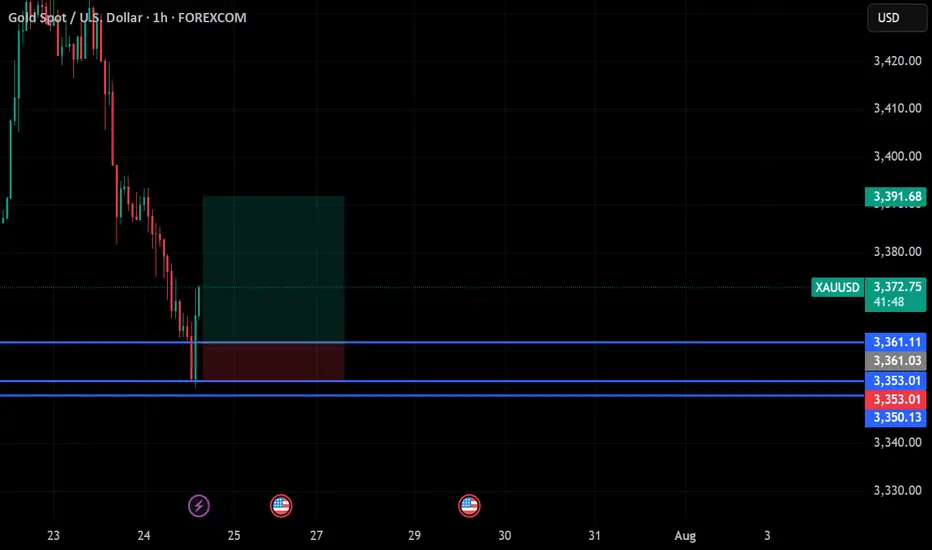
gold on buy reverse#XAUUSD price we await a little retrace below 3361 to continue bullish. Market price can follow
Entry at 3361, target 3391, stop loss 3353.
Bearish can follow depending on if tariff is lower.
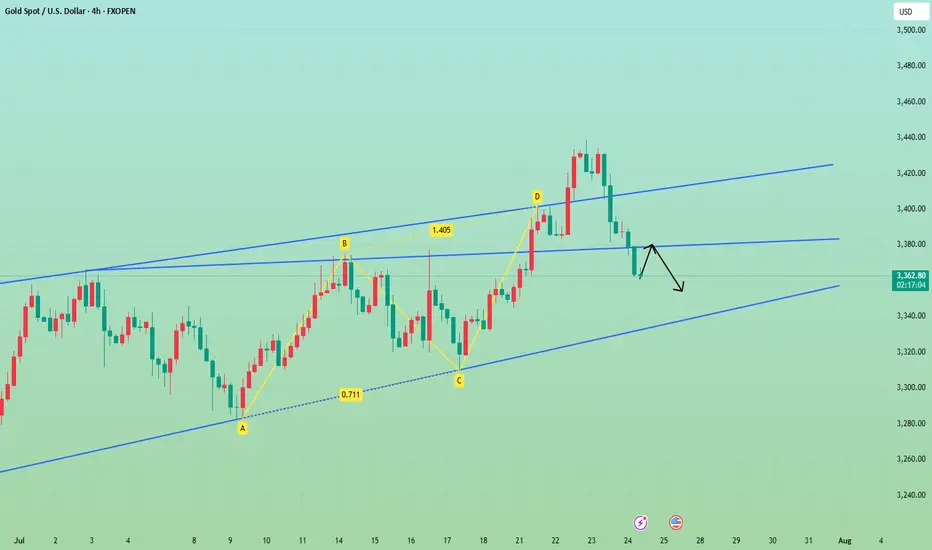
Gold's weak pattern, rebound is still empty.In fact, I strongly advise you not to attribute this wave of decline to the progress of trade negotiations. If you keep talking about these things all day, you will make mistakes inexplicably. I want to ask, do you know what its progress is? The previous rise was said to be not negotiated, so don’t you think this is a useless theory and fundamentals? As a topic of conversation with friends, it’s okay, but if you use it as a basis for trading, forget it. Every time it can take off at 3250 and fall at 3430, such a coincidental space, what other reasons are there besides the main control?
I deliberately gave a rebound expectation. If it can reach 3403, I am willing to go short again. The reason for taking this position is that gold has indeed broken the previous bottoming pattern, the support of the BD trend line, and the horizontal support of point D, but the problem is that it has not really broken the trend line of the inward channel. In this case, I must prevent a rebound, and it would be great if I could enter the market at 3403. You can look at the probability of a head and shoulders top.
Otherwise, I can only watch it fall first. Faced with this weakness, I choose to directly chase the bearish trend. The current price is still early compared to today's high of 93, and the support below is at 3360.
Xau/Usd - Gold turn to Bull runGold time to Long..
buy 3364
SL 3361
TP 3377
Xau/Usd Bull Run started

LONG Setup - Smart Money Bias (15m)
## 🟢 LONG Setup - Smart Money Bias (15m)
- **Pair**: XAU/USD (Gold)
- **Timeframe**: 15m
- **Entry Zone**: Around **3390.050**
- **Stop Loss (SL)**: **3377.200**
- **Take Profit Targets**:
- **TP1**: 3402.800
- **TP2**: 3410.500
- **TP3**: 3418.800
---
### 📌 Confluences:
- Demand zone respected and tapped.
- Bullish reaction from POI (Point of Interest).
- FVG (Fair Value Gap) filled and reversal initiated.
- BOS + CHoCH in lower timeframe confirmed.
- Forecast projection aligns with upside inefficiency.
---
### 🧠 Strategy:
- Smart Money Concepts (SMC)
- Liquidity Sweep below demand
- Risk-Reward Ratio: ~1:2.3
🚨 **Note**: Trade with caution around US market open hours (volatility expected).
📌 Disclaimer & Reflection
Before we dive into today's mark down, I want to take a moment to address the previous signal that hit stop loss. As traders, we must acknowledge that losses are part of the process—no matter how solid our analysis may be. I take full responsibility for the outcome, and I appreciate the trust and patience of this community.
Every stop is a reminder that perfection doesn't exist in the markets—only probabilities. What matters most is how we adapt, learn, and continue to evolve.
Let's move forward with clarity and discipline.

XAUUSD LONG Here are reasons to buy gold,
1.Ascedig triangle formed and clear when you look at daily and h4 time frames.
2.At 3410.42 support truns in to resistance
3.Be on the look out of tend in trends on the smaller time frames

Continued price increase - gold increased to 3450⭐️GOLDEN INFORMATION:
Gold prices climbed for a second straight session on Tuesday, gaining over 0.9% as sliding US Treasury yields continued to weigh on the US Dollar. Investors remained cautious amid lingering uncertainty over upcoming US trade agreements. At the time of writing, XAU/USD is trading at $3,427, having rebounded from an intraday low of $3,383.
Yields on US government bonds have now declined for five consecutive days, pressuring the Greenback—reflected in the softer US Dollar Index (DXY). Heightened speculation that the US and European Union (EU) may fail to secure a trade agreement before the looming August 1 deadline has intensified demand for safe-haven assets. As a result, gold surged to a five-week high of $3,433.
⭐️Personal comments NOVA:
Gold price continues to increase, FOMO from the market is good and positive. Heading towards 3450
⭐️SET UP GOLD PRICE:
🔥SELL GOLD zone: 3449- 3451 SL 3456
TP1: $3435
TP2: $3422
TP3: $3405
🔥BUY GOLD zone: $3380-$3378 SL $3373
TP1: $3390
TP2: $3400
TP3: $3415
⭐️Technical analysis:
Based on technical indicators EMA 34, EMA89 and support resistance areas to set up a reasonable BUY order.
⭐️NOTE:
Note: Nova wishes traders to manage their capital well
- take the number of lots that match your capital
- Takeprofit equal to 4-6% of capital account
- Stoplose equal to 2-3% of capital account
