Gold: Market Analysis and Trading StrategiesSo far, although the price has risen, it has not yet broken through the upper resistance, and the lower support remains intact. Overall, the market is still in a narrow range of consolidation. From a technical perspective, the 2-hour chart shows a bullish bias, indicating a potential for continued upward movement in the short term.
However, if during this consolidation phase the price breaks below the key support at 3309, it is likely to further test the support zone around 3296–3288.
At this stage, traders can consider entering light long positions and gradually add to them on dips to reduce the average entry price. For more conservative traders, it's advisable to wait until a clear breakout occurs before taking action.
Watch the 3338–3352 area for potential short opportunities as it's a key resistance zone, and the 3303–3288 range for long entries as it offers strong support. Trading near these levels generally carries lower risk and a higher probability of profit.
Xauusdlong

gold on short bullish till 3340#XAUUSD price aiming 3340 for reverse, possible 3340 price close on D1 or middle close to continue bearish.
#Gold buy at 3326 breakout, target 3340, SL 3317.
We aim at H4 price close in next 2 hours, if possible it closes below bearish 3313 then bearish is possible to continue but buy at 3323-26 will take above 3340.

Gold May Rebound After Monday Dip; Watch Tariffs & GeopoliticsGold may continue to decline before rebounding on Monday📉. The first support level is currently near 3,240-3,260. When approaching this support area, considering going long is advisable👍. It is still crucial to closely monitor the latest developments regarding U.S. tariffs and the situation in war-torn countries, as significant volatility may occur at any time⚠️. If a rebound reaches 3,350-3,360, considering going short is an option📉
⚡️⚡️⚡️ XAUUSD ⚡️⚡️⚡️
🚀 Buy@ 3250 - 3260
🚀 TP 3290 - 3310
🚀 Sell@ 3360 - 3240
🚀 TP 3310 - 3290
Accurate signals are updated every day 📈 If you encounter any problems during trading, these signals can serve as your reliable guide 🧭 Feel free to refer to them! I sincerely hope they'll be of great help to you 🌟 👇

Gold weakness continues, bears continue to exert force📰 Impact of news:
1. The streets of Los Angeles are full of "gunpowder smell"! Immigration protests escalate, and Trump sends troops to suppress them
2. Geopolitical situation
3. Federal Reserve political expectations
📈 Market analysis:
At present, the hourly moving average of gold price is spreading downward. At the same time, the 4H chart has retreated from a high and lost the middle track, breaking through the rising trend line. The low point of the trend line coincides with the middle track. Today's operation uses the low point of 3330-3335 as the critical point of strength and weakness. If the market rebounds below this range, you can just go bearish. If it breaks through this dividing point, you need to be cautious. On the whole, the recommended short-term operation strategy for gold today is to mainly short on rebound. Focus on the resistance of 3330-3340 on the upper side in the short term, and focus on the support of 3290-3280 on the lower side in the short term. The market fluctuates greatly, and stop loss is strictly controlled!
🏅 Trading strategies:
SELL 3325-3335
TP 3300-3290-3280
If you agree with this view, or have a better idea, please leave a message in the comment area. I look forward to hearing different voices.
TVC:GOLD FXOPEN:XAUUSD FOREXCOM:XAUUSD FX:XAUUSD OANDA:XAUUSD

Long Opportunity on XAU/USD (Gold) – Intraday SetupTechnical Insight:
Price broke structure to the upside (BOS) and formed a bullish internal structure (HH–HL)
Current pullback is approaching EPA + ILQ zone
Strong volume node at 3314 (ideal liquidity sweep area)
Bullish orderflow remains intact on 15m
Structure: ✅ Bullish
Efficiency: ❌ Inefficient (which increases probability of fill & reversal)
---
📊 Bias: Long
🧠 Note: Consider confirmation candle or bullish momentum on entry zone.
💡 For educational purposes only – DYOR
📍 Entry Zone: 3314
🎯 Targets:
→ TP1: 3320
→ TP2: 3330
→ TP3: 3340
🛑 SL (Recommended): Below 3310 or structure invalidation

GOLD: Bullish Bias Holds, But Mind the Unfilled GapGold dipped below 3300 today and bounced back, though the gap near 3289 remains unfilled.
This shows buying interest is active, but also reveals that some sideline capital is still waiting for a full retest.
Combined with selling pressure on the rebound, it’s clear that bullish strength is currently limited.
—
🔍 Two Possible Scenarios from Here:
1️⃣ If support proves firm during consolidation, bulls may regain momentum and push higher
2️⃣ If support fails, price is likely to fill the 3289 gap before launching the next leg up
📌 Current Trade Outlook:
✅ Bullish trend remains intact
✅ Regardless of the short-term path, the direction is upward
✅ Watch resistance at 3331, with a key zone near 3348
—
⚠️ Note: The daily chart structure still needs further correction.
If volume remains weak after a second dip and a failed bounce follows, bears may take over again — in that case, the next downside target would be around 3258–3228
📩 Conclusion: Stay long-biased, but react flexibly to support strength and volume shifts.
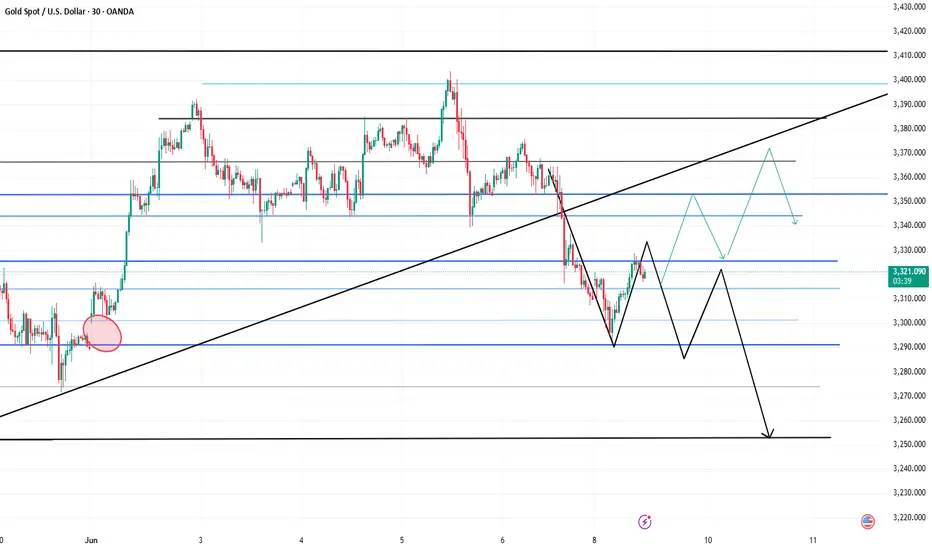
6/9 Gold Analysis and Trading SignalsLast Friday, gold experienced a sharp drop, briefly testing the 3300 level. From a technical standpoint, the market has started to show early signs of bottom formation, which could materialize either as a double bottom / multiple bottom pattern, or through a direct upside breakout.
If the former unfolds, we expect a stronger and more sustainable rebound.
If it turns into a straight bullish leg, traders should be cautious of potential exhaustion in the rally, which may invite a renewed bearish attack.
📊 Key Macro Focus This Week:
Markets will be primarily influenced by data releases on Wednesday through Friday, including:
Monthly CPI
Initial Jobless Claims
Inflation Expectations
As a result, Monday's trading will be dominated by technical patterns, with a bias toward a corrective rebound. The strategic focus should be on buying near support, with short-term opportunities to sell near key resistance.
📌 Monday Trading Plan:
✅ Buy in the 3303–3286 zone (early base-building area)
✅ Sell in the 3343–3353 zone (overhead resistance)
🔄 Intraday pivot levels for tactical entries:
3338 / 3326 / 3317 / 3309

XAUUSD15min Time Frame
Long Entry: After bullish divergence +
✅ Confluence: Bullish divergence + Alligator lines turning up (Lips > Teeth > Jaw)
SL TP EP metioned in graph

GOLD Intraday Chart Update For 9 June 2025Good Morning Traders,
As you can see that market try to fill the previous week opening gap and in that situation we may wait for a while to fill the gap and buying zone is located at 3265-3285, once market gives us a bounce back it will may move back to 3330-3340 SBR Zone
however market try to sustain above 3300 Psychological Level but keep in mind US China Tariff Deal which is due in this week
also if market sustains below 3300 psychological level successfully then it will move towards 3245-55 zone and final destination maybe 3200 Psychological
Disclaimer: Forex is Risky

XAUUSD Bullish Move Next WeekHey traders
I can see XAUUSD in Bullish side in 1d time frame
wait for market
Always wait for confirmation/strong setup for open a trade.
Thank you and Good Luck!
Happy trading.

XAUUSD Analysis todayHello traders, this is a complete multiple timeframe analysis of this pair. We see could find significant trading opportunities as per analysis upon price action confirmation we may take this trade. Smash the like button if you find value in this analysis and drop a comment if you have any questions or let me know which pair to cover in my next analysis.

D1 looking BullingGold on Daily TF looking buy till 3,780$ per ounce on 4h it’s on strong Support zone.!
Let see on monday what will do.!
Note: it’s not financial advice, Trade your own.

GOLD (XAU/USD) Imminent long opportunitiesThis week, my focus for GOLD is on potential long opportunities around the current price level. Price is sitting within a strong area of demand, so my plan is to wait for signs of accumulation and a clear slowdown in bearish momentum before considering any entries.
Ideally, I’d like to see the Asia low swept, which currently lies in the middle of the zone — that would offer even stronger confirmation for a buy setup.
If this current zone doesn’t hold, I have a well-defined 9H demand zone around the 3,220 level, which sits in a more discounted area and aligns well with the overall bullish trend on the higher timeframes.
Confluences for GOLD Buys:
- Clean major daily demand that caused a change of character to the upside
- Plenty of liquidity above and an unmitigated supply higher up
- This is a pro-trend trade, aligning with overall higher timeframe bullishness
- DXY has been bearish over the past few weeks, supporting gold upside
P.S. If price respects this current demand and moves higher, we may see a short-term reaction from the 3H supply zones above — but we’ll monitor price action and adjust accordingly.
Have a great trading week

XAUUSD: $3100 is the next target, Get Ready For the Big Move!Gold is currently making a small correction and looking at how the price is behaved. We are expecting how the price is likely to develop next. Use accurate risk management.

Gold falls below key support, short-term bearish approachAt present, the hourly level has fallen below the key support level of 3330, which is effectively broken as the short-term long-short watershed, which means that the market is weak and volatile in the short term. However, it does not constitute a short trend for the time being. The short-term trend in the future may still fluctuate downward, but there is no basis for a deep decline. Short-term short orders can be participated in, but the general direction remains bullish.
This week is coming to an end. If there are still operation plans, you can wait for a small rebound and then participate in a wave of short-term short operations. The target is controlled at 10-30 points. Enter and exit quickly, and don't be greedy.
Looking ahead to next week, it is expected that the market will fluctuate around 3,300 and then bottom out and then resume its upward trend. The thinking will continue to be mainly "short-term short and long-term long".
The current gold 1-hour moving average system has begun to turn downward. If a dead cross structure is further formed in the future, the downward space will be opened. After gold fell under pressure from a high level yesterday, it continued to be weak today. Combined with the bearish non-agricultural data, there is a lack of support for risk aversion. There is still room for short-term downward movement, and the overall rebound is still the main focus.
Operation suggestions:
Aggressive investors may consider shorting in the 3333-3335 range;
Conservative investors may wait for a rebound to the 3345-3350 area and enter the short position at an appropriate time.
The target is 10-30 points. It is not recommended to hold more than the target.

Gold Drop Fully Expected — Now It's Bulls?This recent decline in gold was well within our expectations. Since Monday, I’ve been highlighting the following:
The 3400 zone is a strong historical resistance, with heavy supply pressure;
A gap remains open at 3289, creating downside risk.
Today's drop is a deep flush of selling pressure near the 3400 zone.
Although the 3289 gap is still unfilled, this move may trigger dip-buying activity, giving bulls some room to work with.
📌 The first rebound resistance is likely near 3343, but because the gap is still a threat, most funds remain cautious. This could result in:
Weaker-than-expected rebounds;
Even possible bull traps followed by renewed downside.
✅ Long strategy reminders:
Keep position size moderate;
Set realistic targets;
Adjust your approach in line with market development.
Stay sharp, stay flexible — profits favor the prepared.

Gold Is Likely to Break Below 3300 SoonYesterday, gold rallied up to near 3400 before pulling back, just as we had anticipated. We've repeatedly emphasized that 3400 is a strong resistance level, and those who followed through with short positions likely saw impressive profits.
Today, after a sharp drop, gold has rebounded again and is fluctuating near resistance. Support lies at 3352, and if that breaks, the next downside target is around 3333, followed by a possible move to fill the gap between 3300–3289.
🔍 Trading Logic:
There's still significant selling pressure above 3300, with the gap remaining unfilled.
Once the gap is filled, bulls may regain confidence to push higher — though they still face dense resistance above.
📌 Clear Profit Opportunities:
✅ Short toward the 3289 gap fill
✅ After the gap is filled, consider buying into the bullish rebound
The setup is clear — the key now is timing your entries and managing your positions wisely.

6/5 Gold Analysis and Trading SignalsGood morning, everyone!
Gold surged above 3380 yesterday but faced strong resistance, pulling back before testing the critical 3400 level. Despite multiple attempts, price failed to break through, highlighting a clear lack of bullish momentum near historical highs.
From a technical perspective, a potential M-top (double top) pattern is forming on the 30-minute chart. If confirmed, we can expect a deeper retracement, with an initial target around 3330, and possibly 3300 in case of further downside. Under this structure, today’s primary trading bias should favor short positions.
That said, if gold breaks above 3400 with strength, the 3416–3438 target zone becomes viable. However, any such breakout is likely to be followed by a pullback. In that scenario, we’ll closely monitor the 3392–3368 support range before executing follow-up trades.
📉 Technical Notes:
Price remains near a historical resistance zone, and buyers are showing hesitancy at these levels;
While yesterday’s Beige Book report provided short-term bullish sentiment, we need to observe whether the Asian and European sessions digest and extend that move.
🗞 Fundamental Outlook:
The key event today is the U.S. Initial Jobless Claims report, which may trigger volatility;
Gold remains supported by risk-aversion flows, but traders should be mindful of potential corrections at elevated levels.
💡 Risk Management Tip:
In such conditions, it is highly recommended to scale into positions with reduced lot size, and use tight risk controls to guard against unexpected reversals.
📌 Trading Recommendations for Today:
Sell near 3423–3436, targeting short-term pullbacks
Buy near 3312–3298, if deeper correction materializes
Pivot levels for tactical trades:
3416 / 3403 / 3392 / 3386 / 3367 / 3352 / 3343 / 3328
Strategy Summary:
Favor short setups on rallies unless 3400 is decisively broken. If support at 3362-3358 fails, expect the bearish trend to gain further momentum.

Gold Analysis June 6: Focus on Nonfarm Payrolls vGold, after rising around 3400, has been under strong downward pressure after US President Donald Trump and Chinese President Xi Jinping had a productive phone call. Today the market focuses on Nonfarm Payrolls
- Technically.
Gold has been under downward pressure from around 3400 and yesterday's decline was good, gold is currently trading below the 3400 zone. However, it has met support at the 3346 - 3340 zone.
Before today's NFP news, you can trade according to the above support zone to buy up, and sell at the psychological resistance zone of 3400.

6/6 Gold Trading StrategyAfter a short rebound, gold is now hovering near key resistance levels.
The critical zone is around 3366 – if price breaks above this, the next upside targets are 3378–3388.
However, from a broader perspective, the 4H chart still shows an uncorrected bearish setup.
Without strong buying volume, the price may drop again — potentially below 3330, or even breach the 3300 level.
—
📅 Key Data Releases Today:
🔹 NFP (Non-Farm Payrolls)
🔹 US Unemployment Rate
Both events are expected to bring high volatility, so manage your risk carefully.
—
📊 My Intraday Trade Plan:
✅ Sell on rallies
🎯 Target: around 3330-3290
📌 Only if price reaches that support zone will I consider shifting to a bullish bias

Maintain price increase, NF will help gold price above 3400⭐️GOLDEN INFORMATION:
He stated that U.S. and Chinese negotiators would soon convene at a yet-to-be-determined location, a development that lifted market sentiment and weighed on gold prices as risk appetite strengthened. This shift occurred despite underwhelming U.S. economic data, which further fueled expectations for a Federal Reserve rate cut later this year.
According to the U.S. Bureau of Labor Statistics, signs of labor market weakness emerged as jobless claims rose, signaling a potential cooling in employment conditions. Meanwhile, the U.S. Bureau of Economic Analysis reported a narrower trade deficit in April, largely attributed to a decline in front-loaded imports ahead of anticipated tariffs.
⭐️Personal comments NOVA:
anxiously awaiting NF news today, there is pressure to weaken the dollar, NF figures that investors are worried about continue to be negative for DXY
⭐️SET UP GOLD PRICE:
🔥SELL GOLD zone : 3449- 3451 SL 3456
TP1: $3436
TP2: $3420
TP3: $3405
🔥BUY GOLD zone: $3303- $3301 SL $3296
TP1: $3320
TP2: $3330
TP3: $3340
⭐️Technical analysis:
Based on technical indicators EMA 34, EMA89 and support resistance areas to set up a reasonable BUY order.
⭐️NOTE:
Note: Nova wishes traders to manage their capital well
- take the number of lots that match your capital
- Takeprofit equal to 4-6% of capital account
- Stoplose equal to 2-3% of capital account

gold on buy#XAUUSD price on buy.
Below 3352 holds bearish flag, take profit 3339.94, stop loss 3361.
At 3339.94 holds bullish reverse, target 3378.
Above 3370 when H1 close on buy holds bullish breakout, TP 3390, SL 3360.

XAUUSD:Go long in batches
Gold in recent two days of strong performance in Asia and Europe, the US is slightly weak, the shock range expanded, below 3340-45 is the rise point of these two times, currently back to around 3365, although the price back before, but the income did not expand. At present, gold is not a strong one-sided rise, is still volatile up, near this position into the long order to hold, is expected to break the probability of today's data is small.
On the trade, buy long in batches around 3365 and 3340-45, and look above the target at 3390-92 first
Trading Strategy:
Long orders near 3365 continue to hold
3340-45 can buy long orders twice
TP:3390-92
↓↓↓ More detailed strategies and trading will be notified here ↗↗↗
↓↓↓ Keep updated, come to "get" ↗↗↗
