GOLD Intraday M30 Chart For 6 June 25As you can see that Market still is in strong range and we are still waiting for clear breakout
NFP main event of the day and remains watchable
If Market break 3335 successfully today then it will move towards 3310
above 3345-50 market remain slightly Bullish
Disclaimer: Forex is Risky
Xauusdlong

XAUUSD BUY IDEAGold tapped a strong Demand Zone, rejecting with bullish momentum despite overall bearish conditions. Low volume + MSS confirms a potential bounce.
Entry: 3,352.79
SL: 3,338.04
TP1: 3,370.00
TP2: 3,388.00
TP3: 3,415.00

Is the Gold Pullback Building Momentum for the Nonfarm Payrolls?On Thursday, gold continued its strong upward trend, hitting a intraday high near $3,403, fully achieving the expected target. Although the European Central Bank's interest rate hike pushed the US Dollar Index higher, triggering a sharp pullback in gold prices during US trading hours, this correction is more regarded as a profit - taking behavior by bulls rather than a signal of trend reversal. Currently, the key support below remains at the $3,340 level. If the price stabilizes above this level, the overall bullish structure remains solid. Thursday's significant pullback is more like a cleaning action by major capital to address excessive short - term positions. The moving average system at the daily chart level still shows a bullish arrangement, with no obvious signs of turning bearish. Given that the Non - Farm Payrolls data will be released on Friday, it is expected that the market will maintain a volatile consolidation trend before that. On Friday, we need to focus on the guidance of the Non - Farm Payrolls data, and the real - time market strategy will be dynamically adjusted according to the data results.
Humans need to breathe, and perfect trading is like breathing—maintaining flexibility without needing to trade every market swing. The secret to profitable trading lies in implementing simple rules: repeating simple tasks consistently and enforcing them strictly over the long term.
Trading Strategy:
buy@3340-3350
TP:3370-3380

Can the bulls help gold hit 3400 today?⭐️GOLDEN INFORMATION:
Gold prices surged more than 0.80% on Wednesday during the North American session, buoyed by disappointing U.S. economic data that signaled a slowdown in business activity and softer job growth. XAU/USD climbed to $3,382 after rebounding from a session low of $3,343.
Heightened tensions between the U.S. and China also contributed to bullish momentum in bullion. With uncertainty looming over upcoming trade negotiations between Washington and Beijing, investors sought refuge in safe-haven assets like gold.
Adding to market jitters, President Donald Trump signed an executive order doubling tariffs on steel and aluminum imports—from 25% to 50%—effective June 4. The move came just days ahead of a highly anticipated call between Trump and Chinese President Xi Jinping, further fueling concerns over escalating trade frictions.
⭐️Personal comments NOVA:
Buying power is continuing, will break out strongly in the US trading session
⭐️SET UP GOLD PRICE:
🔥SELL GOLD zone : 3435- 3437 SL 3442
TP1: $3420
TP2: $3410
TP3: $3400
🔥BUY GOLD zone: $3344- $3346 SL $3339
TP1: $3355
TP2: $3368
TP3: $3382
⭐️Technical analysis:
Based on technical indicators EMA 34, EMA89 and support resistance areas to set up a reasonable BUY order.
⭐️NOTE:
Note: Nova wishes traders to manage their capital well
- take the number of lots that match your capital
- Takeprofit equal to 4-6% of capital account
- Stoplose equal to 2-3% of capital account

The long strategy has been successful, pullback and go long📰 Impact of news:
1. European Central Bank deposit facility rate in the eurozone as of June 5
2. Initial jobless claims data
3. Non-farm payroll data
4. Worsening geopolitical situation
📈 Market analysis:
At present, the gold price has broken through the previous highs of 3392 and 3395. There is no obvious peak signal in the short term. At the same time, as the gold price continues to rise, the lower support will also move up in the short term, and the 4HMACD has a golden cross trend. In the short term, pay attention to the 3385 support below and the 3410 resistance above. The 1H indicator is close to the overbought area. We still need to be vigilant about the risk of rising and falling. If the gold price retreats to 3390-3385, we can consider going long with a light position.
🏅 Trading strategies:
BUY 3390-3385-3375
TP 3400-3410
If you agree with this view, or have a better idea, please leave a message in the comment area. I look forward to hearing different voices.
OANDA:XAUUSD FX:XAUUSD FOREXCOM:XAUUSD FXOPEN:XAUUSD TVC:GOLD

As long as gold falls, you can continue to buyNow we continue to pay attention to the short-term support of 3353-60. Today, we focus on the important support position of 3338-45. The trend is still mainly to do more after stepping back. We must operate under the premise of following the general trend. Only in this way can we achieve stable operation. If your current gold operation is not ideal, I hope I can help you avoid detours in your investment. You are welcome to communicate with me!
From the 4-hour analysis, the short-term support below focuses on the 3354-62 line. The daily level stabilizes at this position and continues to see the strong upward rhythm of bulls. Focus on the support of 3338-45. Pay attention to the suppression of 3395-3400. Keep the main tone of low-multiple participation around this range during the day. In the middle position, watch more and move less and be cautious in chasing orders, and wait patiently for key points to enter the market. I will remind you of the specific operation strategy during the trading session, and pay attention to it in time.
Gold operation strategy:
1. Buy when gold falls back to 3353-3362, and buy when it falls back to 3340-45, stop loss at 3336, target at 3395-3400;

Gold is expected to continue to 3410-3420At present, gold has risen to around 3395 in the short term, breaking through the short-term high of around 3392, and there is no clear peak signal; and after breaking through the previous high of around 3392, there is no need to worry about the suppression of the technical double top structure for the time being. From this point of view, gold still has the potential to continue to rebound in the short term, and is even expected to reach the 3410-3420 area; this morning, gold has not fallen below 3360 during the adjustment process. As gold rises, the lower support area gradually moves up. The current short-term support area is in the 3385-3375 area.
Today's trading strategy:
1. Consider shorting gold when it first touches the 3410-3420 area, TP: 3395-3385
2. Consider trying to go long gold in small batches when gold falls back to the 3385-3375 area, TP: 3395-3405
Gold bulls are strong and clear, go long on pullbacksFrom the 4-hour analysis, the short-term support below is around 3354-62. If the daily level stabilizes at this position, the bulls will continue to fluctuate upward. Focus on the support of 3338-45. Pay attention to the suppression of 3395-3400. Keep the main tone of low-long participation around this range during the day. In the middle position, watch more and do less, be cautious and wait patiently for key points to enter the market. I will remind you of the specific operation strategy during the trading session, and pay attention to it in time.
Gold operation strategy:
1. Go long when gold falls back to 3353-3362, and cover long when it falls back to 3340-45, stop loss at 3336, and target 3395-3400;

XAUUSDThe trend of XAUUSD is fluctuating.
Wednesday: XAUUSD in the Asian market rose sharply to 3372 and then quickly dropped to 3348. The current quotation is 3360.
It is a good trading opportunity for traders who bought low yesterday. The lowest yesterday fell to 3333. The operating space fluctuates by about $40/ounce. Many people have no idea. The profit of trading 1 lot of buy orders is 4. The profit of trading 5 lots is 20k.
This week is the monthly data news week. Including ADP. ECB interest rate decision, big non-agricultural data that have a significant impact on the economy.
Trend observation. There is still an intention to continue to rise. In terms of operation, you can focus on buying at low levels.
Pressure range: 3400-3390
Support range: 3340-3350
Under the influence of news. Many trends will be distorted due to the influence of data news. So I have been reminding you not to trade alone. If you want to follow good swing trading instructions to make reasonable trades and expand your profits, please leave us a message.

gold on bullish#XAUUSD price have breakout the 3403, now we expect new formation before any possible move. Between 3390-3392 shows rejection on sell.
Buy on multiple breakout Between 3390-3392, TP 3415-3420, SL 3380.
If possible the next H1 drops and close below 3380 then bearish retracment will occur till 3370-3355.

Trade Idea: XAUUSD Long (BUY LIMIT)Entry Type: Buy Limit
Timeframe Alignment: H4 bullish continuation → M15 demand zone retest → M3 structure forming base at support
Session Timing: Aligned with London–New York overlap (between 4:30 AM and 6:30 AM PST)
⸻
🔹 Trade Setup
• Entry: 3376.10 (Buy Limit)
• Stop Loss: 3361.00
• Take Profit: 3412.00
⸻
🔹 Trade Logic
• Price is pulling back into a clear M15 demand zone around 3376, which aligns with prior consolidation and breakout zone.
• Trend remains bullish on the H4 and M15 with higher lows and sustained closes above the 50 EMA.
• 3376 area also marks a low-volume imbalance fill on lower timeframes (M3), suggesting institutions may defend this level.
• TP is just below prior H4 swing highs (~3415)
⸻
🚫 Invalidation Window
• cancel the trade entirely if not activated by 6:30 AM PST to maintain session alignment and volatility edge.
FUSIONMARKETS:XAUUSD

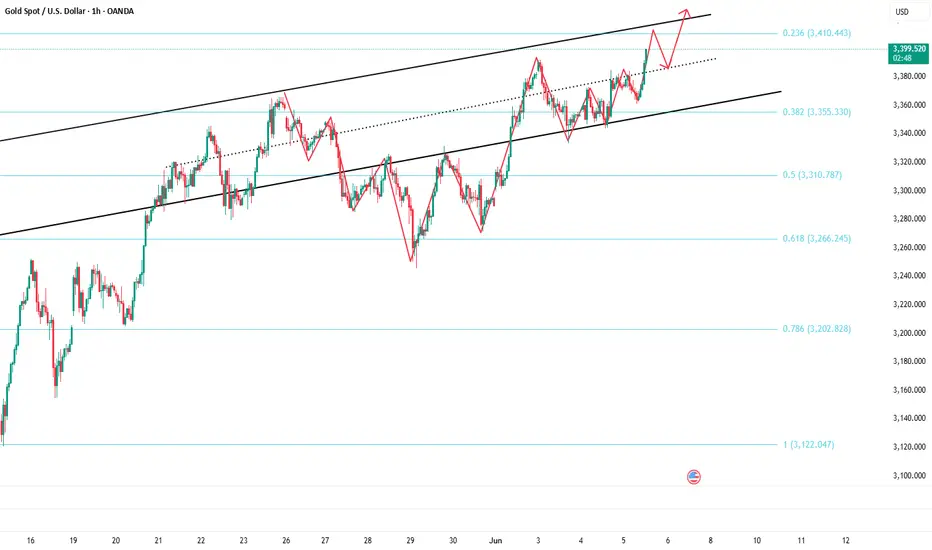
XAUUSD ON TRIANGLE 📌 XAUUSD – 1H Chart Update | June 5th, 2025
Gold is consolidating within a triangle pattern, with price respecting key structure levels and showing signs of potential breakout. Despite a bullish bias, the Stochastic oscillator remains in the overbought area, signaling a possible short-term pullback before continuation.
🟧 Key Technical Highlights:
Price is consolidating near the triangle’s apex — a breakout is imminent.
Bullish breakout target: 3,392–3,410 Supply Zone.
Breakdown potential: revisit to Demand Zone at 3,340 or deeper to 3,306–3,246.
Overbought Stochastic supports the scenario of a pullback before bullish continuation.
📊 Upcoming Fundamental Catalyst:
🔥 NFP Data – Friday, June 7th (High Impact)
Strong NFP → USD strengthens → Gold may drop
Weak NFP → USD weakens → Gold may rally
Traders are likely to remain cautious ahead of the release, potentially leading to choppy or range-bound price action until the data is out.
🧠 Trading Strategy:
Wait for breakout confirmation with volume.
If price rejects the upper triangle, prepare for a retest toward Buyer Zone.
If breakout occurs after NFP with bullish momentum, target 3,392 and above.
Stay sharp, trade smart, and manage your risk — especially heading into NFP!
Disclaimer ON
Gold:Go short before you go long
Gold is currently volatile upward trend, here can not avoid repeated retracement. Now the performance is relatively strong break 3884 short - term high, then the United States is expected to attack twice, then can participate in the long again. Note: long is the main, short is the auxiliary
You can go short now, and then go long. Below is support around the 3365-70 zone
Trading Strategy:
SELL@3385-90
TP:3370-65
BUY@3365-70
TP:3390-3400
↓↓↓ More detailed strategies and trading will be notified here ↗↗↗
↓↓↓ Keep updated, come to "get" ↗↗↗

Bull market returns? Aiming at 3400?📰 Impact of news:
1. New uncertainty in Russia-Ukraine negotiations
📈 Market analysis:
The current trend of gold prices is erratic and discontinuous, and only swing trading can be adopted during the day. In the short term, there is a certain pressure at 3385-3395 above. If this resistance area is broken, the gold price is expected to continue to rise. The short-term support below FOREXCOM:XAUUSD is at 3350-3340. At present, the news has a greater impact on the gold price, coupled with the support of market risk aversion, so in the short term, attention should be paid to the break of the upper resistance.
🏅 Trading strategies:
BUY 3370-3365
TP 3385-3395-3400
SELL 3395-3400
TP 3380-3370
BUY 3350-3340
TP 3370-3380
If you agree with this view, or have a better idea, please leave a message in the comment area. I look forward to hearing different voices.
OANDA:XAUUSD FX:XAUUSD FXOPEN:XAUUSD TVC:GOLD

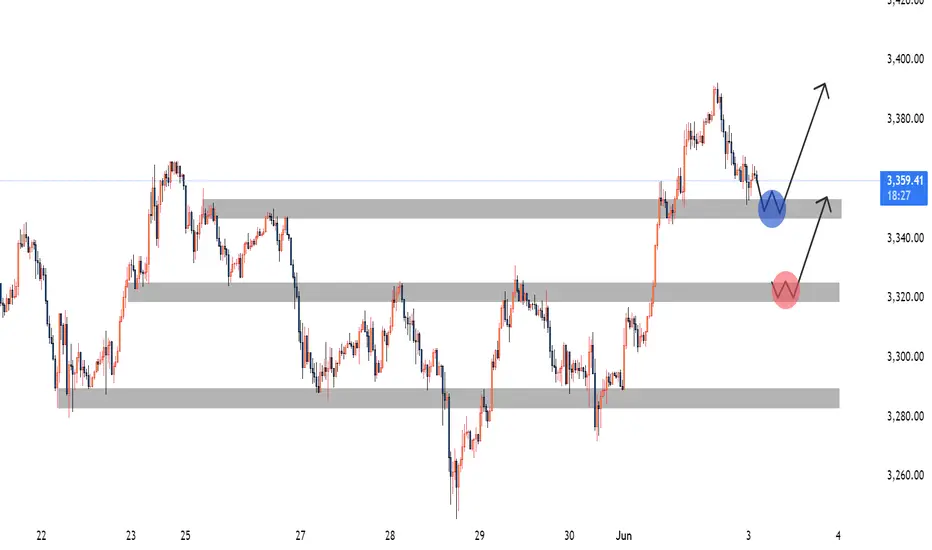
Gold XAUUSD Possible Move 6th May 2025I'm watching two key demand zones today for potential buy opportunities:
📍 Zone 1: 3348–3352 (Blue Zone)
Reasoning: This area aligns with a previous demand zone that has already shown strong bullish reaction. Price is currently retracing into this area.
Signal to Enter: Look for:
A liquidity sweep below the zone (e.g., a quick wick down grabbing stop-losses).
Followed by a bullish engulfing candle or a break of minor structure to the upside on lower timeframes (e.g., M1–M5).
Expectation: If confirmed, this could trigger the next leg up toward the recent highs (approx. 3385+).
📍 Zone 2: 3320–3325 (Red Zone)
Reasoning: A deeper zone of interest where price last consolidated before a strong rally. Ideal for deeper pullback entries if the first zone fails.
Signal to Enter:
Look for a retest and bullish rejection with strong wick rejections or a CHoCH (Change of Character) on LTF.
A clean break of minor bearish structure can serve as confirmation.
Expectation: If this level holds, a bounce back toward the mid/high 3300s is likely.
✅ Trade Setup Summary:
Buy Zone 1: 3348–3352
Signal: Liquidity grab + Bullish engulfing / BOS (low timeframes)
Target: 3365–3375-85
Invalidation: Clean break and close below 3345
Buy Zone 2: 3320–3325
Signal: Rejection wicks + CHoCH or FVG entry
Target: 3335–3355-3375
Invalidation: Break below 3315
Gold 100% Trading SignalsJudging from the trend of the gold 1-hour chart, the daily level maintains a strong bullish upward pattern. It is recommended to continue to focus on the range low-multiple strategy during the day. The current market is in a stage of shock consolidation, and there is a technical pressure to rise and fall in the short term. In terms of operation, it is recommended to focus on short-term long orders, and focus on the trading logic of following the trend and low-multiple. It is necessary to focus on the upper 3390-3400 resistance range and the lower 3340-3330 support range. Specific strategy Weng Fuhao suggested that you can try long orders when it falls back to the 3348-3353 area.
Operation strategy:
1. It is recommended to go long in the 3348-3353 area of gold, with a stop loss at 3340, and look at 3365-3375 in the short term, with a target of 3400

XAUUSD FREE DAYTRADE SIGNAL!!!hello everyone i want share my free signal at XAUUSD.
Price tested well 30 FVG, we have bullish trend at all at gold and after consolidation golf found buyer + Dollar is bearish.
Here is my setup:
Open long position at 3368
Stop loss at 3364
Profit target 1 at 3377 profit target 2 at 3384
ALWAYS MAKE YOUR OWN RESEARCH !!!!

Gold 100% Trading SignalsOn the monthly chart, gold price closed in a cross pattern, which is the first time after a sharp rise, suggesting a fierce confrontation between long and short forces, and a strong wait-and-see sentiment in the market. This pattern may indicate that the market has entered an adjustment or relay stage. Given the large increase in the previous period, a correction is possible, but it cannot be asserted that the trend has reversed. In the daily chart, the Bollinger Bands slightly opened, the moving average golden cross, and the short moving average continued to move up after the big sun, indicating that the long adjustment may have been completed and the unilateral market is about to start. The four-hour chart shows a perfect long arrangement, with the bulls in the lead. The MACD indicator is waiting for an effective golden cross, and the market outlook is expected to continue to rise. At present, the upper resistance is 3388-3392, and the lower support is 3351-3347. In terms of operation, Xu Gucheng recommends rebounding shorts as the main, and callbacks as the auxiliary.
Operation strategy 1: It is recommended to rebound 3388-3394 shorts, stop loss 3400, and the target is 3360-3350.
Operation strategy 2: It is recommended to buy on the pullback to 3353-3347, with a stop loss at 3344, and the target is 3380-3400.

Gold's Bullish Comeback Inverted Head & Shoulders Pattern📊 Chart Analysis
This is a 1-hour chart of XAU/USD (Gold Spot vs. USD) showing a classic Inverted Head and Shoulders pattern — a bullish reversal formation.
🔍 Pattern Breakdown:
Left Shoulder: Formed in early May.
Head: Deep dip mid-May.
Right Shoulder: Developed in late May.
Neckline Breakout: Price has broken above the neckline with strong bullish momentum.
📈 Key Levels:
🔵 Bullish Confirmation: 3,278.395 (breakout level, neckline)
🔼 First Target: 3,410.372 🔴
🎯 Final Target: 3,495.774 🚀
📉 EMA 70 (3,316.651) is acting as dynamic support, aligning with the bullish scenario.
🧠 Interpretation:
As long as price stays above the bullish zone (3,278), the bias remains strongly bullish.
Traders might consider entering on pullbacks or breakouts with stops below the right shoulder or neckline.
📌 Summary:
✨ Bullish Reversal Unfolding
💹 Breakout confirmed
🎯 Targeting higher highs

Although the market fluctuates, the rhythm is not chaotic.Today's public strategy suggested shorting gold at 3365, and accurately predicted the retracement of the resistance level again. The brothers who followed up again reaped good rewards. Then arranged long orders in the 3344-3345 range, and exited the market at 3360 after the market fell and rebounded; then arranged short orders at 3360-3361, and fell again under pressure, and successfully took profits at the target of 3350. Although the short-term fluctuations were large, we finally managed to grasp the rhythm steadily and reaped ideal profits.
Judging from the current trend, as long as the short-term gold market is above 3330, gold will still be in a strong bullish trend. On the contrary, if it falls below the closing line near 3330, it will break the trend line, and the subsequent market will most likely form a weak shock pattern. Therefore, the current operation is actually very simple. As long as the 3330 position is not broken, you can rely on the 3330 area to enter the market and do more. Pay attention to the support near yesterday's low point of 3333 below, and pay attention to the resistance near 3380-3390 above.
Gold operation suggestions: It is recommended to short gold with a light position near 3380-3385, with a target of 3370-3360, and go long near 3345-3350 when gold falls back, with a target of 3360-3370.

Safe-Haven Demand May Drive Gold Prices Higher✅ Today’s ADP report came in bullish for gold,
✅ Meanwhile, the Federal Reserve’s Beige Book reveals:
A slight slowdown in economic activity
Increased policy uncertainty and price pressures for businesses and consumers
An overall pessimistic economic outlook
📌 Combined with ongoing geopolitical tensions, this creates a supportive backdrop for safe-haven buying in gold.
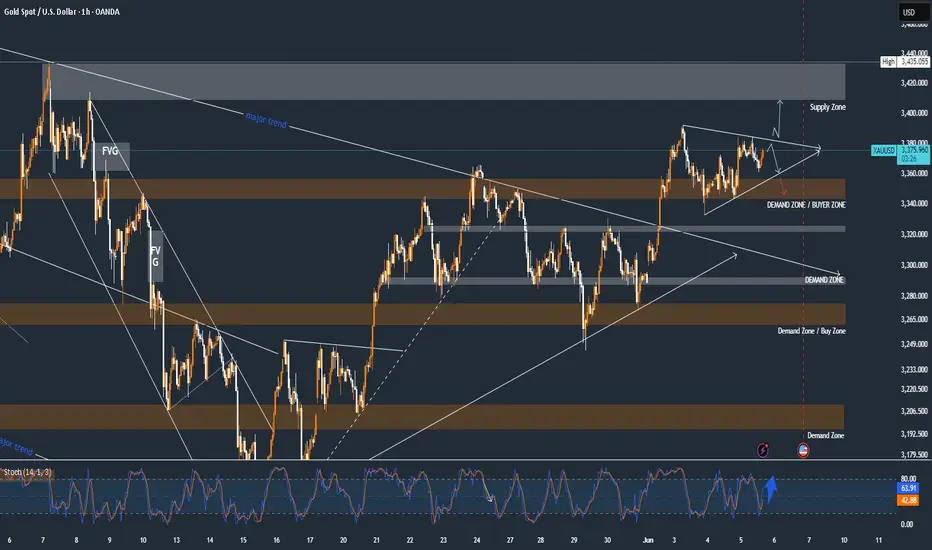
🔍 Technical Outlook (1D Chart):
Gold is still facing a bearish divergence on the daily chart. For this to resolve, the market must choose between:
1️⃣ A strong breakout with volume, pushing toward 3430–3450
2️⃣ A pullback to repair structure, including filling the gap below 3300, which may later fuel a rally toward 3500+ if bullish catalysts arise
📅 Key Events to Watch This Week:
Thursday: Initial Jobless Claims
Friday: NFP (Nonfarm Payrolls)
⚠️ Also monitor developments on trade tariffs, which may affect market sentiment
📊 Short-Term Trade Plan (Range Strategy):
🎯 Key levels to watch:
Resistance: around 3400
Support: near 3366
📌 Consider range trading between 3408–3358, selling highs and buying dips with strict risk control.

XAUUSD🟡 XAUUSD Bullish Trade Plan – 4H Timeframe
📊 Market Structure: Higher Highs & Higher Lows (HH-HL) following Dow Theory
📐 Trendline Breakout confirmed by strong bullish candle
🕓 Timeframe: 4H
🟢 Entry Price (EP): 3379.052
🔴 Stop Loss (SL): 3269
🎯 Take Profit 1 (TP1): 3486.163 – 🟰 Risk:Reward 1:1
🥇 Take Profit 2 (TP2): 3607 – 🟰 Risk:Reward 1:2
📌 Open Two Trades:
🔸 Trade 1: Target TP1 to secure quick 1:1 profits
🔸 Trade 2: Target TP2 for extended 1:2 gains
🔄 Once TP1 is hit, shift SL of Trade 2 to Entry 🔁
📈 Continue trailing SL upward if momentum persists beyond TP2
⚡ Clean structure, trend alignment, and solid risk control – strong long setup! 🚀

Gold bulls are marching forward.The near-term outlook depends on Friday's release of U.S. labor data. A strong nonfarm payrolls report could reinforce the Federal Reserve's current policy of maintaining interest rates, putting pressure on silver by boosting the U.S. dollar and U.S. Treasury yields. On Wednesday, the 10-year Treasury yield held at 4.456%, while the 2-year yield stabilized at 3.964%, reflecting a market in a wait-and-see state. At the same time, the Federal Reserve's Beige Book and recent official comments continue to reflect a cautious stance, particularly on trade risks. Gold oscillated at low levels today before breaking upward, achieving a bullish breakout. Combined with the bullish impact of the ADP Nonfarm Employment Change data, gold bulls are expected to continue their momentum.
Humans need to breathe, and perfect trading is like breathing—maintaining flexibility without needing to trade every market swing. The secret to profitable trading lies in implementing simple rules: repeating simple tasks consistently and enforcing them strictly over the long term.
Trading Strategy:
buy@3340-3350
TP:3380-3390
