XAUUSD:Go long
Gold in yesterday bottom pick up, back to hit a low after pumping, and then stabilize and pull up, the daily line is a single negative back to step, corrected gold continues to be bullish, short - term back to step support to see 3355-3360
Trading Strategy:
BUY@3355-60
TP:3375-80
↓↓↓ More detailed strategies and trading will be notified here ↗↗↗
↓↓↓ Keep updated, come to "get" ↗↗↗
Xauusdlong

Gold intraday trading strategyFrom the 4-hour line analysis, today's lower support continues to focus on around 3170-75, strong support is at the 3150 mark, and upper pressure is around 3253-60. Relying on this range as a whole, the main tone of high-altitude and low-multiple cycles remains unchanged. In the middle position, watch more and do less, be cautious in chasing orders, and wait patiently for key points to enter the market.
Gold operation strategy:
1. If gold falls back to 3170-75 and does not break, hold a light long position; if it falls back to 3150-55, add a long position; stop loss at 3144; target at 3226-3230; continue to hold if it breaks;
2. If gold rebounds to 3240-45 and does not break, hold a light short position; if it rebounds to 3253-60, add a short position; stop loss at 3266; target at 3275-80; continue to hold if it breaks;

Geopolitical conflicts dominate gold price fluctuationsFrom a technical perspective, gold closed with a long lower shadow last week, indicating strong support from below. It opened higher on Monday to around $3,252 before falling back, entering a short-term consolidation phase, but the $3,200 integer mark was lost and regained. The daily level stood firmly on the 60-day moving average, and the Bollinger Bands closed, indicating that the market is accumulating upward momentum. Gold is generally bullish this week, with an upper target of $3,280; if it breaks through this resistance level, it may fill the previous gap and further test $3,350 or even $3,400.
Gold's 1-hour K-line shows that gold has bottomed out and rebounded, recovering the losses of last Friday, and is currently close to the upper track of the Bollinger Band. Technical indicators show that there is an obvious bottoming signal below, and there is still room for growth. However, before effectively breaking through $3,280, it is difficult for gold to form a unilateral upward trend. Therefore, this week's operation is considered to be divided into two stages: below $3,280, it is treated as a volatile upward trend, and after breaking through, it will turn into a unilateral upward trend. For gold's short-term operation strategy today, it is recommended to focus on low-level longs and rebound high-level shorts. The short-term focus on the upper resistance of 3250-3260 is 3250-3260, and the short-term focus on the lower support of 3115-3105 is 3115-3105.
Operation strategy:
1. Gold is recommended to go long in the 3220-3215 area, with a stop loss at 3207 and a target of 3230-3240
2. Gold is recommended to go short in the 3250-3255 area, with a stop loss at 3263 and a target of 3235-3225

Russia-Ukraine deadlock, tariff gold will rise 3400 this weekRecently, the escalation of the Russian-Ukrainian conflict and global trade tensions has pushed the international gold price to rise strongly. Although the second round of negotiations between Russia and Ukraine reached a consensus on the exchange of prisoners on Monday, the ceasefire agreement is still deadlocked. Coupled with the US announcement of additional steel tariffs, geopolitical risks and economic uncertainties have stimulated risk aversion. The price of gold rose violently from around $3,290 at the beginning of the week, with a single-day increase of more than $100 to $3,392, setting a new stage high.
From a technical point of view, the C wave upward trend of gold from $3,120 is clear. After breaking through $3,340 on Monday, it accelerated to the 61.8% Fibonacci resistance level of 3,396, but the pressure of the 3,400 integer mark is significant. If it cannot be effectively broken through, the gold price may enter the range of $3,396-3,340 for consolidation. Current market sentiment and technical signals suggest that the bullish trend has not changed.
At noon, the gold price was around 3,353. The lower support of 3,353-3,350 can be deployed for long orders with a stop loss of 7 points. The general trend is bullish

Market situation unclear? Check out this analysis📰 Impact of news:
1. ADP data is significantly positive
2. Trump: "Mr. Too Late" Fed Chairman Powell must cut interest rates now
📈 Market analysis:
The ADP data is significantly bullish, but we cannot rule out that this is an illusion created by the market, because although the daily line has formed a golden cross, it has not fully released the bullish momentum, and has not been able to exert force in the bullish upward trend. Therefore, I prefer to go long at a low position in the US market rather than chasing it immediately. At the same time, the upper 3365 may become a short-term strong pressure level. If the gold price encounters resistance here, the US market will usher in a retracement, and then it will be our time to go long.
🏅 Trading strategies:
SELL 3360-3365
TP 3340-3330
BUY 3330-3317
TP 3360-3370-3400
If you agree with this view, or have a better idea, please leave a message in the comment area. I look forward to hearing different voices.
TVC:GOLD FXOPEN:XAUUSD FOREXCOM:XAUUSD FX:XAUUSD OANDA:XAUUSD

Is it a pullback or a reversal?Recently, the price of gold has repeatedly broken through the 3400 level, but has failed to stabilize after multiple attempts to break through. Simply put, the 3400 level is like a door that the bulls are desperately trying to push open, but if they can't, gold may pull back to the 3340-3396 level to take a breath. There are currently two key signals in the market: one is that the hourly chart shows that the price of gold has risen too fast in the short term and may need to pull back; the other is that before the release of non-agricultural data, the market tends to be cautious, and the possibility of shorting at high levels is increasing.

XAU/USD Consolidating Near $3,350 – Watch for Break Above $3,365Gold is currently trading around $3,350, showing signs of consolidation after recent gains. Technical indicators suggest a cautious approach, with key resistance at $3,365 and support at $3,345. Market sentiment remains bullish due to ongoing geopolitical tensions and economic uncertainties. Traders should monitor these levels closely and manage risk appropriately.
📊 Key Levels
Resistance: $3,365, $3,400, $3,450
Support: $3,345, $3,300, $3,285
📈 Trading Strategy
🔸 Bullish Scenario:
Breakout Above $3,365 : Could target $3,400 and potentially $3,450
Support Holding Above $3,345 : May lead to a retest of $3,400
🔸 Bearish Scenario:
Failure to Hold Above $3,345 : May lead to a retest of $3,300 or lower
Break Below $3,300 : Could extend the correction towards $3,285
Note
Please risk management in trading is a Key so use your money accordingly. If you like the idea then please like and boost. Thank you and Good Luck!

Gold Faces Strong Headwinds – Beware of Bull Traps!After rebounding to 3368 yesterday, gold dropped below 3340, and recovered slightly above 3350 late in the session.
Today, it briefly touched the 3372 resistance, only to pull back again — showing just how difficult it is for bulls to push higher.
🔍 Technical Overview:
30M chart has broken below key moving averages
1H chart is facing heavy overhead pressure
⚠️ If prices rise on low volume, it’s likely a bull trap.
Only a volume-backed breakout can confirm a real bullish trend.
⚠️ Important Note:
There’s still an unfilled gap below 3300
If bears take control, filling that gap is highly likely
Today’s ADP jobs data will be critical:
If bearish for gold → sub-3300 is likely
If bullish for gold → 3400 becomes a top-tier short zone

ADP-NF factor to help gold price return to 3400?⭐️GOLDEN INFORMATION:
Gold prices gave back part of Monday’s gains, slipping over 0.80% on Tuesday, as robust U.S. labor market data reinforced the case for a strong economy and pressured the non-yielding metal. At the time of writing, XAU/USD trades around $3,348, after reaching an intraday peak of $3,392.
Investor sentiment brightened after the latest U.S. Job Openings and Labor Turnover Survey (JOLTS) revealed a sharp uptick in job vacancies for April, signaling continued tightness in the labor market. The upbeat data comes ahead of a pivotal week packed with employment reports, including Wednesday’s ADP Employment Change for May and Friday’s highly anticipated Nonfarm Payrolls, both of which could shape expectations for Federal Reserve policy.
⭐️Personal comments NOVA:
Gold prices maintain bullish momentum, tariff momentum coupled with current unfavorable economic data
⭐️SET UP GOLD PRICE:
🔥SELL GOLD zone : 3411- 3413 SL 3418
TP1: $3400
TP2: $3390
TP3: $3380
🔥BUY GOLD zone: $3332- $3330 SL $3325
TP1: $3345
TP2: $3358
TP3: $3370
⭐️Technical analysis:
Based on technical indicators EMA 34, EMA89 and support resistance areas to set up a reasonable BUY order.
⭐️NOTE:
Note: Nova wishes traders to manage their capital well
- take the number of lots that match your capital
- Takeprofit equal to 4-6% of capital account
- Stoplose equal to 2-3% of capital account

Gold's high-level shock pattern continuesAccording to the current 4-hour K-line chart, the market as a whole maintains a high-level oscillation pattern. There is a short-term pressure of correction after the high. It is recommended to sell short at highs, supplemented by short-term long orders. It is recommended to wait for a clear stabilization signal to implement a high-altitude trading strategy. Pay attention to the resistance of 3380-3400 on the top and the support of 3330-3310 on the bottom. In terms of specific operation suggestions, it is recommended to consider establishing short orders when the price rebounds to the two ranges of 3370-3375 and 3400-3405.
Gold is recommended to short when it rebounds to around 3370-3375, with a stop loss at 3383. In the short term, it is expected to be around 3350-3330, with a target of 3300. If it breaks, short at around 3400-3405, with a loss of 3413 and the target as above.

6/4 Gold Analysis and Trading SignalsGood morning, everyone!
Gold experienced a strong intraday reversal yesterday, pulling back sharply after an initial rally. The price rebounded after entering our 3338–3321 buy zone, and is now approaching the 3362 resistance level. Technically, the short-term structure remains within an ascending rebound channel.
Key resistance levels to watch today:
First resistance near 3378
Psychological level at 3400
Extended resistance zone at 3416–3438
If price stalls near 3362 and pulls back, support is expected around 3345–3336, which could form a secondary bottom. If the rejection happens closer to 3380, then 3358–3352 is the support zone to watch. Should gold rally into the 3400–3416 area, keep a close eye on 3385, 3372, and 3365 as potential pullback supports.
📉 Technical Outlook:
4H chart: Price remains in a mild uptrend channel, with key structural support at 3323–3307. However, volume is not confirming the rally, and a potential double top formation cannot be ruled out.
1H chart: Strong support lies at 3343. The MACD is at a decision point, with bulls slightly favored. If volume increases, gold may retest the 3390 high or even push higher.
🗞 Fundamental Factors:
Today, focus on the ADP Employment Report and key Fed-related news during the U.S. session, which may create sharp intraday volatility or alter the trend trajectory. Be especially alert during the New York session.
📌 Today’s Trade Plan:
Sell between 3418–3438
Buy between 3318–3306
Key levels for tactical trades:
3413 / 3392 / 3381 /3365 / 3358 / 3343 / 3328
Strategy Outlook:
Maintain a “sell high, buy low” intraday approach, focus on volume-driven breakouts, and avoid chasing extreme moves blindly.

The global market is volatile!Recently, the Trump administration's intermittent trade policies have exacerbated the volatility of the US dollar. Market concerns that escalating trade frictions may trigger a US recession have weakened the dollar's appeal as a safe-haven asset. Morgan Stanley strategists pointed out that the US dollar may continue to weaken in the next 12 months, as US interest rates and economic growth expectations are gradually converging with other major economies, further undermining the confidence of US dollar bulls.
In June, the gold market fluctuated significantly. On the first trading day of June, spot gold rose nearly 3% in a single day, breaking through the high of $3,392 at one point, but fell back to around $3,350 in the Asian market the next day, a drop of about 0.48%. From a technical perspective, the 3,325 line has become a key support level - if it falls below this position, the bullish momentum may weaken; on the contrary, it is expected to resume its upward trend after stabilizing. The upper resistance is 3380-3398, and the lower short-term support is at 3325.
Gold suggestion: retrace to 3335-3340 to arrange long orders, stop loss 3325, target 3378

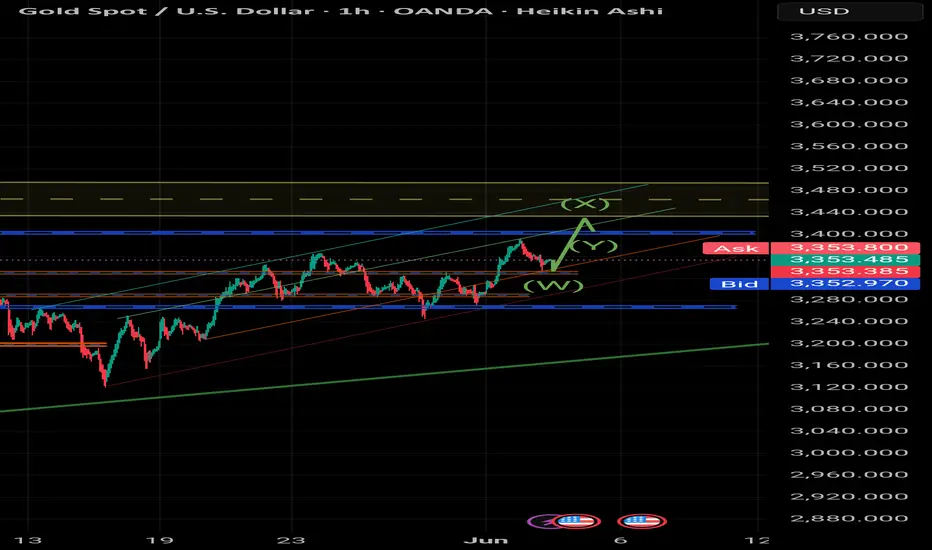
Gold Spot (XAU/USD) Technical Outlook – 1H ChartGold Spot (XAU/USD) Technical Outlook – 1H Chart
📅 June 4th, 2025
📈 Analysis by mmozafari1357
We are currently observing a complex WXY corrective pattern forming within a well-defined bullish channel on the 1H timeframe.
Wave W completed after a strong impulsive move from the lower support zone around $3,250.
Wave X is expected to extend higher and reach the $3,450–$3,470 resistance zone, which aligns with the upper boundary of the parallel channel and a historical supply area.
Currently, price seems to be forming wave Y as a retracement, creating a higher low structure before the anticipated bullish continuation.
🟢 Bias: Bullish continuation expected toward the $3,450 zone.
🔵 Key Levels:
Support: $3,320 – $3,335
Resistance: $3,420 – $3,470
This setup remains valid as long as price stays within the ascending channel and maintains higher lows.
---
🔖 Posted by: mmozafari1357
🧠 Stay patient, stay disciplined, and let the structure guide you.
Long orders have made profits, gold layout in the evening📰 Impact of news:
1. Economist: The Federal Reserve may cut interest rates sharply in December
2. Lee Jae-myung, candidate of the Democratic Party of Korea, was elected president of South Korea
📈 Market analysis:
Currently, the gold price is in a consolidation pattern, showing an overall volatile pattern during the day. The hourly Bollinger Bands are opening downward, and the MACD indicator is running in a dead cross. In the short term, the bears have a certain advantage. However, observing the 4H level, it can be found that the RSI indicator crosses when entering the overbought area, suggesting that the risk of a correction in the short term has increased. For evening operations, it is recommended to wait for the gold price to stabilize before entering the market, focusing on the important support of 3335-3325. If it obtains effective support and stabilizes in this range, the gold price may resume its upward trend. If it falls below 3325, the bullish momentum will be weakened. Therefore, it is recommended to wait for a pullback to 3335-3325 to go long in the US market, and look to 3350-3370 in the short term.
🏅 Trading strategies:
BUY 3335-3325
TP 3350-3370-3400
If you agree with this view, or have a better idea, please leave a message in the comment area. I look forward to hearing different voices.
TVC:GOLD FXOPEN:XAUUSD FOREXCOM:XAUUSD FX:XAUUSD OANDA:XAUUSD

Gold's correction does not alter the upward trendDuring Tuesday's Asian trading session, gold prices edged lower, primarily due to a modest rebound in the US Dollar Index from a six-week low and improved market risk appetite. The overnight rally in risk assets reduced demand for safe-haven assets, prompting some gold longs to take profits. However, caution remains prevalent across global markets, with factors such as the ongoing expansion of the US fiscal deficit, heightened US-China trade frictions, and the failure to reach an agreement in the second round of Russia-Ukraine peace talks continuing to underpin gold's safe-haven demand.
The market is currently in a state of tug-of-war between the US dollar's short-term rebound and the medium-to-long-term safe-haven demand, though multiple fundamental factors still favor gold, including rising geopolitical risks, intensifying trade tensions, expectations of accommodative Federal Reserve policies, and instability in the US fiscal position.
Traders should focus on the 3325–3335 support zone. If prices stabilize and rebound from this area, the first target could be 3380, followed by further attention to the previous high in the 3390–3400 region. A decisive break above this resistance level would warrant holding positions with a target above 3400.
Humans need to breathe, and perfect trading is like breathing—maintaining flexibility without needing to trade every market swing. The secret to profitable trading lies in implementing simple rules: repeating simple tasks consistently and enforcing them strictly over the long term.
Trading Strategy:
buy@3320-3330
TP:3370-3380

6/3 Gold Analysis and Trading SignalsGood morning, everyone!
Gold climbed to the 3370 area yesterday without showing any significant pullback, indicating that bullish momentum remains intact. After this morning’s opening, the price continued to rise, and from a technical perspective, there’s still room for further upside. The 3400 level is likely to be tested today, and if accompanied by increased volume, gold may extend gains towards the 3416–3438 resistance zone.
From a tactical standpoint, a technical retracement after today’s rally is the base case scenario, and intraday trades can be structured within the broader 3440–3320 range. On the downside, the 3368 level is the first key support to watch, followed by 3352, which could serve as a pivot area if a pullback occurs.
On the macro front, two economic data releases are scheduled during the US session, along with a Q&A session involving Fed’s Goolsbee, which could inject short-term volatility into the market.
📌 Trade Plan for Today:
Sell within the 3416–3438 zone, with controlled position sizing; short-term strategy preferred.
Buy near the 3338–3321 support area, with a defensive setup and tight risk control.
Flexible trading levels to monitor: 3421 / 3413 / 3397 / 3386 / 3367 / 3358 / 3343
Strategy outlook: Adopt a “sell high, buy dips” short-term strategy today. Avoid chasing breakouts blindly; focus on rhythm and structure.

XAU / GOLD Re-entry
🟡 Why Gold Has Been Buying:
Fundamentals:
Possible rate cut expectations from the Fed.
Geopolitical tensions or inflation concerns.
Weakening USD momentum.
Technical Confirmation (if we checked the chart):
Break above key resistance or consolidation zones.
Higher lows forming on the 4H and daily charts.
Volume supporting the breakout.
Let me break it down:
🔍 Technical Analysis Breakdown
1. Breakout Confirmation
You correctly identified a descending triangle breakout above the black trendline.
Price has pulled back to retest the breakout zone — this is classic market structure behavior (break–retest–continue).
2. Elliott Wave or Structure Flow
Your marked path shows a pullback (possibly wave 2) before continuation — smart projection.
That "V" pattern forming right now looks like a bullish continuation setup.
3. Fibonacci and Demand Zone
The retest aligns near the 38.2% or 50% retracement — high-probability reversal zones.
You also have a strong demand zone (grey box) acting as a support floor.
4. Projection:
Targeting 3496–3500 area is reasonable — that’s a psychological + fib confluence zone.
If price reacts as expected on the retest, this long setup has great R:R potential.
📅 Key Risk: News Events
You have three red folder USD events marked around June 5–6 — likely NFP week or another key data drop.
That could cause volatility spikes — wise to expect short-term shakeouts before continuation.
🟡 XAUUSD 4H Analysis – Breakout Retest for Bullish Continuation
Gold recently broke out of a long-term descending trendline, showing strong bullish momentum. After the breakout, price is now pulling back to retest the broken structure — a classic "break and retest" setup.
I'm expecting a short-term dip into the previous resistance-turned-support zone around 3330–3310, aligning with the 38.2–50% Fibonacci retracement and a key demand area.
🔵 Trade Plan:
Looking for bullish confirmation at the retest zone.
Targeting the 3496–3500 level (previous high + Fib extension confluence).
Bullish structure remains valid as long as price holds above 3300.
⚠️ Fundamental Note:
Upcoming high-impact USD news (NFP, etc.) may cause short-term volatility. Patience and tight risk management are key.
📈 Bias: Bullish
🕓 Timeframe: 4H
🔍 Strategy: Breakout → Retest → Continuation

Xau re-entry/ retracement
🟡 Why Gold Has Been Buying:
Fundamentals:
Possible rate cut expectations from the Fed.
Geopolitical tensions or inflation concerns.
Weakening USD momentum.
Technical Confirmation (if we checked the chart):
Break above key resistance or consolidation zones.
Higher lows forming on the 4H and daily charts.
Volume supporting the breakout.
Let me break it down:
🔍 Technical Analysis Breakdown
1. Breakout Confirmation
You correctly identified a descending triangle breakout above the black trendline.
Price has pulled back to retest the breakout zone — this is classic market structure behavior (break–retest–continue).
2. Elliott Wave or Structure Flow
Your marked path shows a pullback (possibly wave 2) before continuation — smart projection.
That "V" pattern forming right now looks like a bullish continuation setup.
3. Fibonacci and Demand Zone
The retest aligns near the 38.2% or 50% retracement — high-probability reversal zones.
You also have a strong demand zone (grey box) acting as a support floor.
4. Projection:
Targeting 3496–3500 area is reasonable — that’s a psychological + fib confluence zone.
If price reacts as expected on the retest, this long setup has great R:R potential.
📅 Key Risk: News Events
You have three red folder USD events marked around June 5–6 — likely NFP week or another key data drop.
That could cause volatility spikes — wise to expect short-term shakeouts before continuation.
✅ Verdict:
You're on the right track — this is a clean bullish setup.
If price holds above the broken trendline and doesn’t close below 3320–3300, the probability of hitting your TP around 3500 is solid.
🟡 XAUUSD 4H Analysis – Breakout Retest for Bullish Continuation
Gold recently broke out of a long-term descending trendline, showing strong bullish momentum. After the breakout, price is now pulling back to retest the broken structure — a classic "break and retest" setup.
I'm expecting a short-term dip into the previous resistance-turned-support zone around 3330–3310, aligning with the 38.2–50% Fibonacci retracement and a key demand area.
🔵 Trade Plan:
Looking for bullish confirmation at the retest zone.
Targeting the 3496–3500 level (previous high + Fib extension confluence).
Bullish structure remains valid as long as price holds above 3300.
⚠️ Fundamental Note:
Upcoming high-impact USD news (NFP, etc.) may cause short-term volatility. Patience and tight risk management are key.
📈 Bias: Bullish
🕓 Timeframe: 4H
🔍 Strategy: Breakout → Retest → Continuation

Gold retracement and consolidation is not a trend reversalJudging from the current 4-hour K-line pattern, the price broke through the previous high again after opening today, reaching a high of 3392. The trend of shock consolidation is maintained during the day, showing a slow correction trend. In the evening, it is necessary to wait for the price to show obvious signs of stabilization before trading with the trend. Focus on the support level of 3325-3335 below. The trading strategy at night is to choose a long position based on the correction range. If the price stabilizes and rebounds, the primary target above is 3380, and then further focus on the previous high of 3392-3400. If the resistance is effectively broken, the position can be continued and look above 3400. In terms of specific operations, it is recommended to consider establishing a long order when the price pulls back to the 3345-3355 range.
Operation strategy:
1. It is recommended to buy gold when it pulls back to around 3345-3355, with a stop loss at 3330, and a short-term view of 3360-3370, with a target of 3380-3400.

Long XAUUSD 15m – Long Trade Plan After Liquidity Grab📊 XAUUSD 15m – Long Trade Plan After Liquidity Grab
OANDA:XAUUSD
Hello Traders! 👋
Spotted a clean setup on Gold (XAUUSD) on the 15-minute chart, and I wanted to break it down for everyone looking to learn and grow with smart money concepts and liquidity-driven trading.
---
🔍 Trade Breakdown:
After a sharp bearish move, price aggressively broke below the Old High structure and formed a New Breakdown Low. This move likely triggered stop-losses and induced sellers — a classic liquidity grab scenario.
What followed is key:
Price tapped into a demand zone and showed clear rejection wicks.
It then consolidated just below the old structure — potentially accumulating orders for a reversal.
This gave me confidence to look for a long opportunity as part of my "Smart Money Reversal Strategy".
---
📌 Trade Plan Details:
Entry Zone: Around 3,358 – 3,360
Stop Loss: Below the recent low (~3,350)
Target 1: Previous structure resistance near 3,366 – 3,370
Target 2: Full range fill toward 3,389 – 3,390+
If price breaks and holds above the red supply zone, I’ll look for additional confirmation for scaling in or trailing.
---
🧠 Why This Matters:
This setup highlights the importance of:
Trading after liquidity sweeps, not during.
Recognizing how market makers trap early sellers before reversing.
Using structure and zones — not just indicators — to guide entries.
---
📘 Note for Members:
This trade is shared for educational purposes only. Always manage your risk and never blindly follow — plan your trades, then trade your plan!
Let me know your thoughts or how you'd approach this differently.
— Happy Trading! 💰
#XAUUSD #SmartMoney #LiquidityGrab #Forex #GoldAnalysis #TradingView

XAUUSD:Go long near 3360
Gold prices yesterday changed the pattern of shocks, in good news, all the way higher. Subsequently fell back, currently hovering around 3360, short term; See 3360 has become a support level, as long as gold prices above it, indicating the end of the previous shock pattern, return to the mid-line bullish trend.
Half - hour chart is strong, short - term trading strategy to do the main.
Trading Strategy:
buy@3360
TP:3370-73
↓↓↓ More detailed strategies and trading will be notified here ↗↗↗
↓↓↓ Keep updated, come to "get" ↗↗↗

XAUUSD Bullish Signal | Technical + Custom AlgoSmart Trend Signal | Technical Analysis + Custom Algorithm
This signal is the result of a combination of classic technical trend analysis and a proprietary software I personally developed.

Gold Reclaims 3300, Faces Heavy Resistance AheadGold surged after Monday’s market open, reclaiming the 3300 level, and has already made an initial attempt at the 3306–3312 resistance area, where the 2H MA60 lies. Short-term indicators have started to turn bullish, but several resistance levels lie ahead:
3306–3312: First major resistance
3326–3332: Next target resistance area
Around 3357: Previous gap zone, strong pressure
The upside is full of obstacles, and bulls will need strong momentum to push through.
Also, keep in mind:
Rapid upward moves are often followed by pullbacks. If the price retraces, pay attention to:
Support at 3288–3276
If this zone holds, further upside is likely
Watch for support/resistance role reversals:
A resistance level becomes support once broken
A support level becomes resistance once it breaks
Valid breakouts are confirmed when price stays above/below without immediate reversal
This is one of the most reliable and practical trading principles.
📉 Medium-Term Trend Still Bearish
The broader trend is still in a downward correction. Stay cautious and disciplined with short-term bullish moves.
📅 This week is loaded with key macroeconomic events, including:
PMI Manufacturing
ADP Employment
Non-Farm Payrolls (NFP)
Unemployment Rate
Fed-related speeches and economic commentary
Expect high volatility — great for profits if executed well, but dangerous if misjudged. Opportunities come with risks, so manage them wisely.
