The latest gold operation strategyFrom a technical perspective, gold has been strong recently. Spot gold closed at $3,289.54 per ounce on Tuesday, and further broke through $3,300 in early trading on Wednesday, reaching a high of $3,304.06, a new high in more than a week. In the short term, gold prices need to break through the key resistance level of $3,370 to open up further upside space; $3,150 has formed a solid support below. If there are new variables in the geopolitical situation or economic data, gold prices may even challenge the $3,400 mark. Based on the current trend, the trading idea on Wednesday is clear: wait for the price to fall back and continue to intervene in long orders around 3,300, and maintain a bullish strategy.
Gold is recommended to go long in the 3300-3305 area, stop loss at 3292, target at 3315-3330
Xauusdlong

Gold surges and then falls back to repair the divergenceMainly due to the tense global geopolitical situation and the weak performance of the US dollar, the attractiveness of gold as a safe-haven asset has been strengthened, and the gold price has risen driven by safe-haven buying. According to CNN reports, the United States and Iran are negotiating on the uranium enrichment plan, and Israel may be ready to attack Iran's uranium enrichment plant, which has rapidly heated up the market's risk aversion sentiment; the US sovereign rating has been downgraded to AA1, and the dollar hegemony may loosen. At the same time, Trump's tax reform bill may lead to a significant increase in the fiscal deficit in the near future. Concerns about the US fiscal situation also provide support for gold prices. On the daily chart, gold rebounded continuously, setting a new high for the week, but the gold price rose and fell during the day, and it is necessary to pay attention to the risk of short-term correction. For the support below gold, pay attention to the low point of $3285, which is the middle track position of the daily Bollinger band and the main pressure position after the gold rose on Tuesday. The second is the gold rise and breakthrough position of $3250 on Tuesday; for the pressure above gold, pay attention to the high point of gold on Wednesday at $3325, which is the upper track position of the monthly Bollinger band, and the second is the high point of gold on the day at $3345. The increase this week should not be so large, there should be short pressure. But the bullish sentiment is particularly optimistic at present. The 4-hour and 1-hour Bollinger Bands are both running upward, and the moving average is in a bullish arrangement; the daily line has risen strongly for 4 consecutive days. It should be noted that there will be a lot of short pressure near 3350, and if you want to continue to move forward, you must stabilize the 3350 mark.

Is gold going up or down?Gold is showing the characteristics of a fluctuating upward trend. In terms of support, first pay attention to the vicinity of 3290, which is the low point touched by the gold price in the early stage of yesterday. Secondly, pay attention to the support near 3270, which is the current corresponding support position of the rising channel formed by connecting high and low points since the gold started to rise at 3120. As for the upper resistance near 3350-3370, it is the area that needs to be paid attention to at present. From a technical point of view, the next wave of rise may go to the daily Bollinger upper rail suppression point near 3400, so there is still good room for rise. The technical points of the unilateral rise in the H4 cycle are quite obvious. The Bollinger opening and the moving average system diverge upwards. The upward momentum is sufficient. The upward trend does not guess the top. The support point of the decline is on the moving average support. The expected support point is 3305. In principle, a trend long order is made at this point. It is believed that as long as the 3290 position is maintained, it is still bullish. The long defense position is the 3250 mark. This position is the key watershed for the pull-up and retracement. The key point of the rise is 3350. Here we see whether there can be an effective short-term decline. Gold rose directly in the morning. It is recommended not to chase the long in the Asian and European sessions, but to go long after the decline. Pay attention to the gains and losses of the resistance of 3350-3370 during the day.

gold on sideways#XAUUSD have retest below 3283 which reverse back above 3314, now we expect bullish to take place from 3317.44.
Above the zone 3317.44 shows a bullish breakout which will target 3346 back. Stop loss 3307
Below 3307 have bearish formation which will continue selling till 3284 next bearish zone-3260.

Bulls push price to 3360, prepare for PMI⭐️GOLDEN INFORMATION:
Gold prices climbed over 0.50% on renewed safe-haven demand, holding firm above the $3,300 threshold as investor anxiety grows ahead of the U.S. tax bill vote and mounting geopolitical tensions in the Middle East. At the time of writing, XAU/USD trades around $3,317, rebounding from an intraday low of $3,285.
Sentiment remains fragile, with U.S. equity markets slipping into negative territory and Treasury yields ticking higher. All eyes are on the impending vote on President Trump’s tax reform proposal, which the Congressional Budget Office (CBO) estimates could inflate the national debt by approximately $3.8 trillion. Uncertainty around the fiscal outlook continues to fuel demand for gold as a defensive asset.
⭐️Personal comments NOVA:
Gold price recovered well, pay attention to the price zone 3358. Adjusted down, continued to accumulate around 3300
⭐️SET UP GOLD PRICE:
🔥SELL GOLD zone : 3358- 3360 SL 3365
TP1: $3350
TP2: $3337
TP3: $3322
🔥BUY GOLD zone: $3264- $3266 SL $3259
TP1: $3275
TP2: $3288
TP3: $3300
⭐️Technical analysis:
Based on technical indicators EMA 34, EMA89 and support resistance areas to set up a reasonable BUY order.
⭐️NOTE:
Note: Nova wishes traders to manage their capital well
- take the number of lots that match your capital
- Takeprofit equal to 4-6% of capital account
- Stoplose equal to 2-3% of capital account

XAU/USD GOLD Long Buy TradeEntry 3295.70
SL 3290.50
TGT 3366.20
My Signature W Pattern Trade
1:13.5 Risk Reward Ratio

5/22 Gold Trading SignalsGood afternoon everyone!
Yesterday's trading session was a bit bumpy, but in the end, we achieved considerable profits.
Today, gold rose to around 3346 and then began to pull back. It is now approaching the 3300 support level.
🔍 From a technical perspective, the candlestick structure and several indicators suggest that bears may still attempt further downside:
Primary support area: 3288–3276 — if this holds, a rebound is expected, with resistance around 3309–3316.
Secondary support area: 3263–3248 — if it breaks lower, watch for a short-term bounce around 3276-3282.
📰 On the news front, Initial Jobless Claims and PMI data will be released today. These could trigger short-term volatility.
📌 Trading strategy for today includes two key scenarios:
If the data is bearish for the dollar and gold drops to 3253, look for buy opportunities.
If the data is bullish and gold rises to 3358, it's a good spot to sell into strength.
📈 Today’s Trading Recommendations:
📉 Sell near 3358–3372 (Resistance zone)
📈 Buy near 3263–3248 (Support zone)
🔁 Flexible intraday levels: 3253 / 3268 / 3277 / 3286 / 3298 / 3309 / 3316 / 3328 / 3348
Wishing everyone a smooth trading day. Feel free to leave a comment if you have any questions—I’ll get back to you as soon as possible.

XAUUSD✅ Second Trade of the Day – XAUUSD
The second trade of the day comes from Gold (XAUUSD).
Just like BTC, gold has shown strong bullish momentum in recent days. I’m looking to take advantage of this minor pullback within the broader uptrend — a classic continuation setup on the 15-minute chart.
🔍 Trade Details:
✔️ Timeframe: 15-Minute
✔️ Risk-to-Reward Ratio: 1:2
✔️ Trade Direction: Buy
✔️ Entry Price: 3330.72
✔️ Take Profit: 3341.37
✔️ Stop Loss: 3325.42
🔔 Disclaimer: This is not financial advice. I'm simply sharing a trade I'm personally taking based on my own system, strictly for educational and illustrative purposes.
📌 If you're interested in a more systematic and data-driven trading approach:
💡 Follow the page and enable notifications to stay updated on future trade setups and advanced market insights.

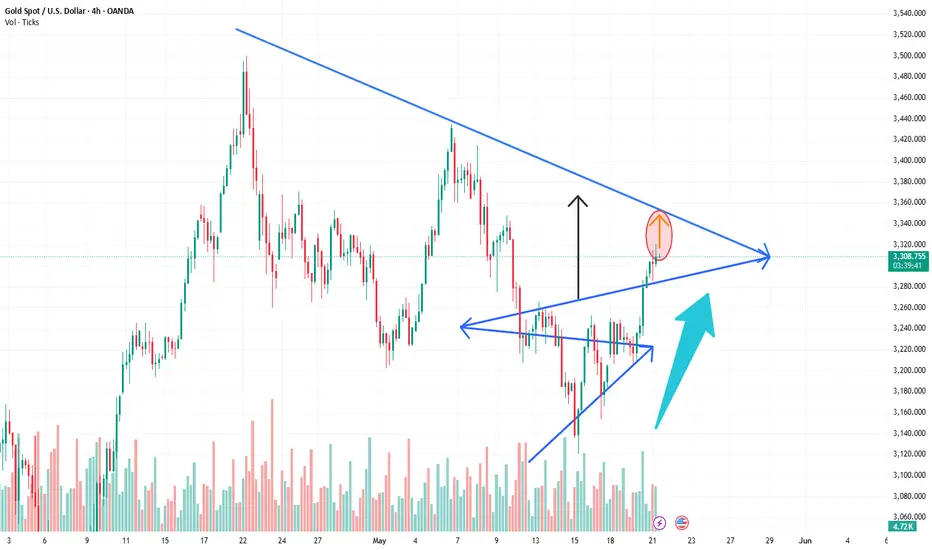
Gold XAUUSD Intraday Move 21.05.2025Gold is currently trading within a well-respected ascending channel, approaching a significant resistance zone around 3315–3320, where previous supply caused a sharp sell-off. This resistance zone has been tested again and shows signs of rejection with consolidation and wicks to the upside.
If price fails to break above this resistance, we may see a corrective drop toward the 3285–3290 zone, which aligns with:
The channel midline
Previous minor structure support
A potential bullish order block/demand zone
This level present a high-probability buy opportunity within the bullish structure.
Preferred Scenario:
Wait for a retracement to 3285–3290 (buy zone)
If bullish price action forms (e.g., bullish engulfing, rejection wicks), enter long position
Trading Signal – Buy Setup
Buy Limit: 3287
Stop Loss: 3275 (below demand and channel)
TP1: 3315
TP2: 3335 (channel top)
Risk/Reward: ~1:2+
Alternative Bearish Scenario:
If price breaks below 3280 with momentum and closes below the ascending channel, avoid buying and reassess for a possible bearish trend shift.

The unilateral offensive is fierce: the bulls have clear goalsGold is performing strongly sideways. We are in the same rhythm as yesterday and continue to maintain bullishness. Gold broke through the key resistance of 3280 on Tuesday and then rose strongly. It is currently above the area near 3330. The technical side shows that the bullish trend continues. The next target may point to the high of 3400. After rising continuously on Monday and Tuesday, it slightly adjusted back to around 3285 on Wednesday and stabilized before rising again. The daily line closed positive and stood firmly on the middle track. The Bollinger band opened upward, and the upper track pressure was at 3400, suggesting that the medium-term upward space is open. The Bollinger band opened significantly, the moving average was arranged in a bullish pattern, and the upward momentum was strong. Short-term support focuses on the moving average at 3315. If the correction does not break this position, the trend long order can follow up. If the key resistance of 3350 is effectively broken, it will further open up the upward space.
Gold operation suggestions: continue to go long after stepping back to 3320-3315, with a target of 3350. If it rises to around 3350 without breaking, you can arrange short-term short orders, with a target of 3330.


How to arrange after gold falls into consolidation🗞News side:
1. US officials said Trump's statement was related to the Golden Dome Project, which may affect the flow of funds
2. The tension in the Middle East has intensified, and the risk aversion sentiment has increased, which is good for gold
3. Although the withdrawal of Indian and Pakistani troops has eased the regional situation, geopolitical risks still exist
4. Trump mentioned the tax bill, which affected economic expectations and affected gold investment sentiment to a certain extent.
📈Technical aspects:
At present, gold is in consolidation, and the upward trend is slightly stagnant. From the hourly chart, there are signs of downward correction after the upward test of 3320. In the short term, the upper 3320 line has a certain suppression, so gold may test the support again and then rise after stabilizing. Then the first support below is the 3292 line, followed by the 3285 line. If it falls below, it may test the two key support points of 3273 and 3265. The current trend is not clear. In the future trading, we will wait patiently for the gold price to stabilize before entering the market.
If you agree with this view, or have a better idea, please leave a message in the comment area. I look forward to hearing different voices.
OANDA:XAUUSD FX:XAUUSD TVC:GOLD FXOPEN:XAUUSD FOREXCOM:XAUUSD

Will spot gold prices continue to rise?Spot gold prices extended their upward trend ahead of the U.S. market open, briefly touching the $3,320 level intraday. According to foreign media reports, U.S. House Speaker Johnson stated that Republicans have reached an agreement to raise the state and local tax (SALT) deduction to $40,000, resolving one of the final issues impeding Trump's economic bill. Following the release of the April trade statement, investors' "unconventional shift" away from traditional safe havens like the U.S. dollar and Treasury bonds may signal a "fundamental institutional change," increasing the risk of "broad-based shifts in global capital flows" that "could have far-reaching implications for the global financial system."
After opening higher today, gold traded within a volatile range. Following a second retracement near $3,290, gold is again likely to test upward resistance. Overall, gold remains in a bullish channel, and barring a break below key support, the probability of continued upside remains high. For today's trading, consider prioritizing long positions on pullbacks as the primary strategy, with short positions at highs as a secondary approach. Monitor resistance at the $3,325-$3,350 level and support at the $3,290-$3,280 level.
Trading Strategy:
buy@3280-3290
TP:3310-3320
In the market, there are no absolutes, and neither upward nor downward trends are set in stone. Therefore, the ability to judge the balance between market gains and losses is your key to success. Let money become our loyal servant.

Grasp the core strategy of trend tradingGold continues to be bullish and will go to the area near the gap of 3325. At that time, the short-term may be blocked and fall back. If it breaks, look at the area near 3340-3345. In the 4H cycle, relying on the moving average to support the rising stage, and the Bollinger is in an open state, there is still room to see above. The support for the fall back is to pay attention to the top and bottom of the small cycle of 3285, followed by the low point of 3274, but there will not be too much retracement in the strong position. In terms of operation, the main fall back is long, and gradually look at 3325 and 3345. Shorting can only be entered at key points, and fast in and out without fighting.
Operation suggestion: Go long on gold near 3285-74, look at 3315 and 3325! If it is extremely strong, go long on the support of 3298-3295!

7 Gold Trades That Banked Over $2,500 LAST WEEK – Steal My StratMy strategy is straightforward: I trade order blocks, target premium/discount zones, and capitalize on liquidity sweeps. When these three signals align on the chart, I enter without hesitation.
Gold triggered a strong reaction off a bullish order block at $3192-3120 after forming it on May 15th( also can be seen as STB), confirming a robust uptrend and a global reversal from a deep discount zone( can be seen on 4h time frame). For the bullish momentum to solidify, price must break and close above $3250
So i will keep an eye on GOLD chart and prefer long trader to shorts

recovery, gold price traded above 3300 mark⭐️GOLDEN INFORMATION:
Beth Hammack of the Cleveland Federal Reserve emphasized that current U.S. government policies have made it increasingly challenging for the Fed to steer the economy effectively and fulfill its dual mandate of price stability and full employment. She also warned that the risk of a stagflationary environment—marked by stagnant growth and persistent inflation—is on the rise. In contrast, St. Louis Fed President Alberto Musalem recently argued that the current monetary policy stance remains appropriately calibrated.
Despite elevated U.S. Treasury yields, gold has struggled to gain traction, suggesting that higher yields alone are not enough to drive safe-haven demand under current conditions.
However, global monetary easing could provide a tailwind for the precious metal. In the latest moves during the Asian session, the People’s Bank of China (PBoC) cut its benchmark rate, followed by the Reserve Bank of Australia (RBA), which unexpectedly reduced its Cash Rate from 4.10% to 3.85%—actions that typically support non-yielding assets like gold.
⭐️Personal comments NOVA:
Gold prices recover due to military instability in the Middle East, growth momentum above 3300
⭐️SET UP GOLD PRICE:
🔥SELL GOLD zone : 3354- 3356 SL 3361
TP1: $3345
TP2: $3332
TP3: $3320
🔥BUY GOLD zone: $3252 - $3250 SL $3245
TP1: $3260
TP2: $3270
TP3: $3280
⭐️Technical analysis:
Based on technical indicators EMA 34, EMA89 and support resistance areas to set up a reasonable BUY order.
⭐️NOTE:
Note: Nova wishes traders to manage their capital well
- take the number of lots that match your capital
- Takeprofit equal to 4-6% of capital account
- Stoplose equal to 2-3% of capital account

Gold is rising strongly, can it retreat and go long today?🗞News side:
1. US officials said Trump's statement was related to the Golden Dome Project, which may affect the flow of funds
2. The tension in the Middle East has intensified, and the risk aversion sentiment has increased, which is good for gold
3. Although the withdrawal of Indian and Pakistani troops has eased the regional situation, geopolitical risks still exist
4. Trump mentioned the tax bill, which affected economic expectations and affected gold investment sentiment to a certain extent.
📈Technical aspects:
Yesterday we gave the view that there would be suppression at the 3290 level above, but affected by geopolitics, risk aversion sentiment rose again. Today, the moving average spread upward, and the Bollinger Bands opened and expanded, and the situation is still bullish. At present, we need to pay attention to the key short-term support level, focusing on the 3280-3285 support line. If the price retreats to this level and does not weaken, it can be considered as an opportunity for us to go long. If the resistance of 3320 is broken through strongly, the upper target will move up, and the lower support will also move up accordingly. 3300 will be converted into an entry opportunity for bulls to pull back. Therefore, we need to observe the price continuity in the European session. If the European session continues to break highs, the US session's correction will still be mainly based on long positions. During the day, it is recommended to wait for gold to retreat to 3290-3280 and try to arrange long positions, looking upward to 3320-3330.
If you agree with this view, or have a better idea, please leave a message in the comment area. I look forward to hearing different voices.
FOREXCOM:XAUUSD FXOPEN:XAUUSD TVC:GOLD FX:XAUUSD OANDA:XAUUSD

5/21 Gold Trading SignalsGood afternoon, everyone!
In yesterday’s trading, our buy-side positions performed well, but unfortunately, sell orders around 3280 weren't closed in time, resulting in a partial loss of profit.
Today, gold has shown impressive strength, breaking above the 3300 level and forming an irregular inverse head-and-shoulders pattern. Technically, this implies further upside potential.
🔍 Based on price action and technical patterns, this rally could extend beyond 3330, and even test 3350+. However, the 3346–3369 zone marks a strong resistance band, making it an ideal zone for medium-term selling opportunities.
📉 On the downside, we identify the first major support at 3278, followed by the 3261–3246 zone.
📰 On the news front, several Fed officials expressed economic concerns in speeches early this morning. Meanwhile, reports of Israel preparing to strike Iran’s nuclear facilities fueled safe-haven demand, pushing gold strongly back above the 3300 mark.
📌 Today's Trading Strategy:
Sell between 3346–3373 (consider scaling in)
Buy between 3260–3243
Flexible trading in the zones: 3338 - 3326 - 3318 -3309 -3298 - 3288 - 3272
Lastly, a heartfelt thought:
Living in a peaceful country like China, it's truly heartbreaking to see so many innocent children suffering or even losing their lives due to war. Let us hope for peace soon—so all people may live safely, freely, and happily.

gold on buy#XAUUSD have regain the pivot support which shows bullish continuation can follow. Multiple entry's shows buy, 3294.7,3304 and 3314.6
Below 3294.7 will kick start bullish target 3346, stop loss 3282.
Below the 3273 have a strong bearish breakout which will drop the price. But depending on H4 if prices closes above 3307 then possible sell can follow from there unless price is above 3314.6

How to grasp the bottoming out and rebound of gold prices?Gold rebounded from 3229 today and then retreated from 3232. It rebounded from 3204. Gold fluctuated upward in the European session. So far, it has fluctuated from 3237. Our short position was successfully closed this morning. At present, we will focus on the short-term suppression at 3240-45 and the important suppression at 3253-60. If the rebound does not break, we will go short.
From the 4-hour line analysis, the support below continues to focus on 3170-75, with strong support at 3150. The short-term pressure above is at 3240-45, and the key pressure is around 3253-60. The overall support range is to maintain the main tone of high-altitude and low-multiple cycles. For the middle position, watch more and do less, and be cautious in chasing orders.
Gold operation strategy:
1. If gold rebounds to 3240-45, short it; if it rebounds to 3253-60, cover short position; stop loss 3266; target 3205-10; if it breaks, continue to hold;
2. If gold falls back to 3170-75, long it will be lightly long; if it falls back to 3150-55, cover long position; stop loss 3144; target 3226-3230; if it breaks, continue to hold

The latest gold operation strategyFrom a technical perspective, gold has been strong recently. Spot gold closed at $3,289.54 per ounce on Tuesday, and further broke through $3,300 in early trading on Wednesday, reaching a high of $3,304.06, a new high in more than a week. In the short term, gold prices need to break through the key resistance level of $3,370 to open up further upside space; $3,150 has formed a solid support below. If there are new variables in the geopolitical situation or economic data, gold prices may even challenge the $3,400 mark. Based on the current trend, the trading idea on Wednesday is clear: wait for the price to fall back and continue to intervene in long orders around 3,300, and maintain a bullish strategy.
Gold is recommended to go long in the 3300-3305 area, stop loss at 3292, target at 3315-3330
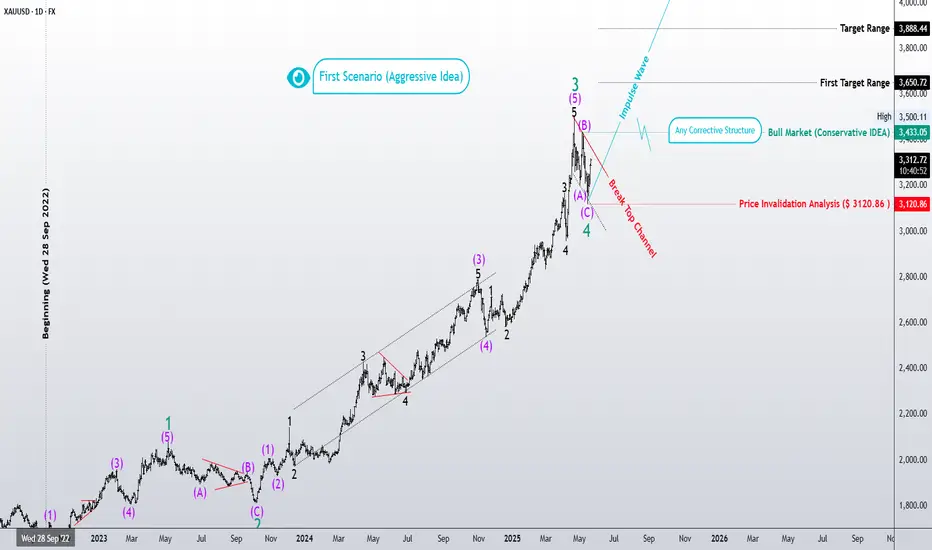
“Gold Surfer – Is Wave 5 About to Begin?”📈 This daily Elliott Wave analysis of the gold market (XAUUSD) tracks the impulsive advance from the September 2022 low ($1614). We now stand at a critical juncture: has Wave 4 completed, opening the path for Wave 5?
🔹 **Aggressive Scenario:** If the correction (ABC) is over, a new bullish Wave 5 could take gold first toward the $3884 zone, and potentially to expanded targets of $4126–$4275.
🔹 **Conservative Scenario:** If the correction continues, alternate patterns (flat, triangle, or complex correction) may still unfold. However, as long as price holds **above $3120**, the bullish wave structure remains valid.
🔻 **Invalidation Level:** $3120.86
🟢 The wave structure so far aligns with Elliott’s classic principles, and the bullish momentum still has room to unfold.
– Patterns whisper. I listen.
– Mr. Nobody 🎧📊
Trend trading is the core strategyGold opened at 3290 and rebounded, reaching 3314 and retreating. Last night, gold broke through the box and oscillated, so it is reasonable to continue to move up. The gold moving average continues to cross upward and diverge. The strength of gold bulls is still there. The decline of gold is an opportunity to continue to go long. Gold is now at the top and bottom conversion position of 3275-85. Gold falls back to 3275-3285 and continues to go long. Gold has repaired the gap of the previous gap. In the short term, pay attention to the suppression of 3315-21. Try not to chase the high position. We will intervene in the long position when it falls back.
Today, the support below is around 3275-85, and the upper short-term focus is on the 3315-21 line. If it does not break, you can short. The important resistance is 3340-45. The short-term long-short strength and weakness watershed is 3253-60. The daily level stabilizes above this position and continues to maintain the same low-long rhythm. Shorting can only enter the market at key points, and enter and exit quickly, and do not fight.
Gold operation strategy:
1. Go long when gold falls back to around 3275-85, with a target of 3300-3320.
2. Go short when gold rebounds around 3340-45, with a target of 3320-3300.
