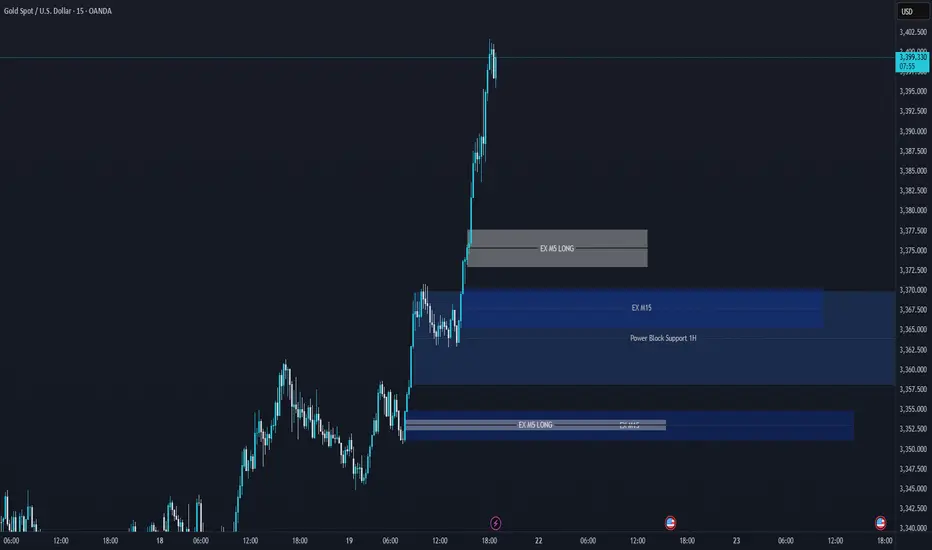
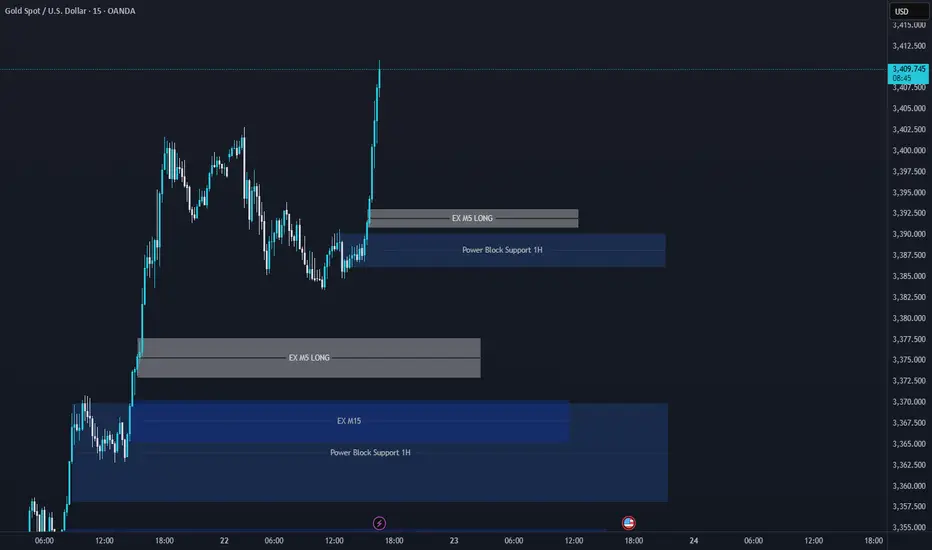
XAUUSD Support & Resistance Levels🚀 Here are some key zones I've identified on the H1/M15/M5 timeframe.
These zones are based on real-time data analysis performed by a custom software I personally developed.
The tool is designed to scan the market continuously and highlight potential areas of interest based on price action behavior and volume dynamics.
Your feedback is welcome!
Xauusdlong
gold on bullish#XAUUSD price expect bullish range between 3430, breakout there will take the price above 3450-3453.
Entry on buy 3430, target 3453, stop loss 3419.
Below 3416 holds a strong bearish continuation, target 3400.

Whether gold can hold low is the key.Yesterday, the market fluctuated in a narrow range and corrected around 3402 and then went up to 3383. After repeated sideways movement, the market realized a sprint to 3400 and further accelerated to 3420. The daily line continued to close positively. Pay attention to the following points in the intraday layout;
First of all, from the perspective of the market pattern: after breaking through the wide sweeping space of 3300 as support and 3375 as suppression, the daily line structure showed a continuous rise and stabilized above 3400, and the space gradually moved upward. In the daily line structure, the Bollinger Bands have shown signs of opening upward, which means that the current wind direction is biased towards the bullish direction; under the premise of a biased direction, the operation is to follow the main low and long; the problem that needs to be considered in the short term is how the rhythm shows the switching relationship between direction and adjustment and the reverse The rebound pace (strong rise or more sweeping) are all points that need to be considered in the short term;
Price:
Pressure: 3438/3440, followed by 3450, then 3470 and above 3500
Support: 3415, followed by 3405/3400, then 3380.
Trend and time point:
Previously, it repeatedly swept widely with 3375 and 3300 as support, and finally achieved an upward breakthrough of the 3375 sweeping barrier this week. The daily line showed three consecutive positive climbs above 3400. From the corresponding daily line structure, the Bollinger band has shown signs of opening upward, and the moving average is also slowly rising, that is, the current trend is more bullish; under the premise of a slight tendency in the direction, the oscillation is mainly bullish and is confirmed.

Don't chase gold at high levels, buy more when it falls back to From the 4-hour analysis, today's support is around 3400-10. If the intraday retracement relies on this position, the main bullish trend remains unchanged. The short-term bullish strong dividing line focuses on the 3380 mark. If the daily level stabilizes above this position, the rhythm of retracement will continue. Short positions against the trend should be cautious.
Gold operation strategy:
Gold retracement to 3400-10 line to go long, retracement to 3390-95 line to cover long positions, stop loss 3379, target 3435-3440 line, continue to hold if it breaks;
CFD XAU/USD - 5m Buy Setup# 🟦 CFD XAU/USD - 5m Buy Setup
**Market:** CFD XAU/USD
**Timeframe:** 5 Minutes (M5)
**Direction:** 🔵 BUY
---
## 📌 Setup Details
- **Entry Zone:** Inside the blue arrow structure (curved shape detected)
- **Pattern:** Bullish curve + upward break of micro-structure
- **Bias:** Buy after confirmation of support on blue arrow structure
- **Context:** Momentum pickup after prior liquidity sweep
---
## ✅ Trade Levels
- **Entry:** At the retest of the curved zone (preferably lower wick tap)
- **Stop Loss (SL):** Below the curve base – approx. `SL: XX.XX`
- **Take Profit 1 (TP1):** Reaction to intraday high – approx. `TP1: XX.XX`
- **Take Profit 2 (TP2):** Next visible supply / FVG zone – approx. `TP2: XX.XX`
- **Take Profit 3 (TP3):** Breakout continuation target / 1:3 RR level – approx. `TP3: XX.XX`
---
## 📈 Notes:
- Ensure confirmation via bullish engulfing / momentum candle before entry.
- Avoid chasing — wait for price to tap into demand with low volume.
- Align with overall bias (check higher timeframe 15m or 1h).
---
*Posted by @Persiaux_King 👑*

People don't like the truth! Let's be honest, people don't like honesty. They prefer ideas that affirm their own beliefs.
When I read articles and posts from newer traders, it's often from a place of "all in" diamond hands and the notion that things go up forever.
I've been a trader for over 25 years now, and the game isn't about making a quick buck, it's about making money over and over again. This got me thinking, the issue is when you deal with a small account you require leverage, small timeframes and of course the "shit" or bust mindset. If you lose a thousand dollars, $10,000 even $100,000 - what does it matter? That's no different than a game of poker in Vegas.
The idea of being 80% in drawdown, is alien to me. The idea of one trade and one win is also a crazy notion.
Instead of playing with the future, there is an easier way to work. This isn't about slow and boring, it's about psychology and discipline. 10% returns on a million-dollar account isn't all that difficult. Instead of aiming for 300x returns on an alt coin (due to the account size being tiny) You can make less of a percentage gain with a larger account size.
In terms of psychology - the word " HOPE " is used, way too often, it's used when you hope a stock or the price of Bitcoin goes up, it's used when you hope the position comes back in your favour, it's used when you want your 10,000 bucks to double.
This isn't trading, it's gambling.
The truth is, it's not the winners that make you a good trader. It's the way you deal with the losses.
Once you learn proper risk management, a downtrend in a market move is a 1-2% loss coupled with a new opportunity to reverse the bias.
As a disciplined trader, the game is played differently.
Let's assume you don't have $100k spare - prop firms are a great option, OPM = other people's money.
Remove the risk and increase the leverage, all whilst trading with discipline.
The market goes through many phases, cycles and crashes.
You don't always need something as catastrophic to take place, but if you are all in on a position. You need to understand that losses can be severe and long-lasting.
When everyone sees an oasis in the desert, it's often a mirage.
You only have to look at the Japanese lesson in 1989, when the Nikkei was unstoppable-until it wasn't. For that short space in time, everyone was a day trader, housewives to taxi drivers.
Everyone's a genius in a Bull market.
Then comes the crash. The recovery time on that crash?
34-years!!!
I have covered several aspects of psychology here on TradingView;
When it comes to trading, if you are able to keep playing. It's a worthwhile game. If you are gambling, it's a game whereby the house often wins.
Right now, stocks are worth more than their earnings. Gold is up near all-time highs, crypto, indices the same.
All I am saying is if you are all in. Be careful!
Disclaimer
This idea does not constitute as financial advice. It is for educational purposes only, our principal trader has over 25 years' experience in stocks, ETF's, and Forex. Hence each trade setup might have different hold times, entry or exit conditions, and will vary from the post/idea shared here. You can use the information from this post to make your own trading plan for the instrument discussed. Trading carries a risk; a high percentage of retail traders lose money. Please keep this in mind when entering any trade. Stay safe.
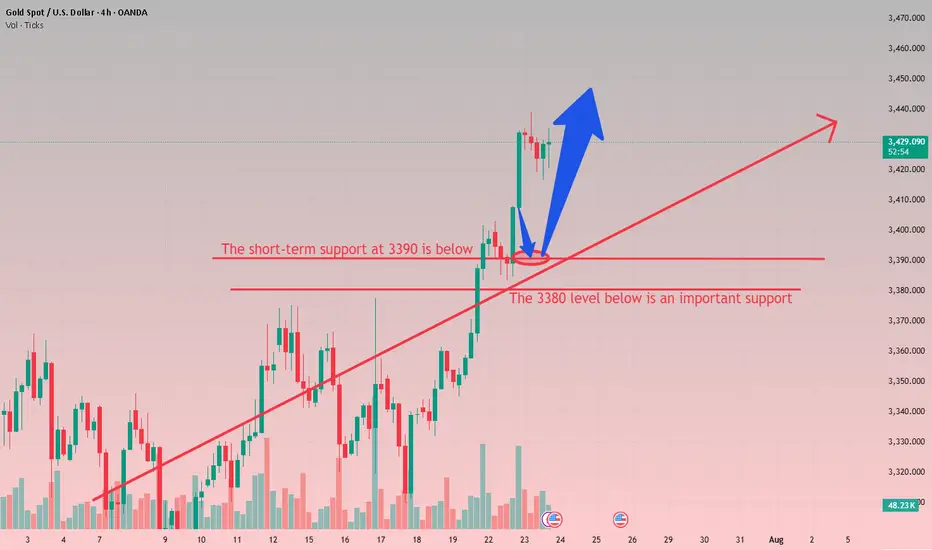
XAUUSD scenario for 7/22/25 This is what I'm looking at today.
Market is overextended after the sharp run—I'm expecting a range or retrace before another strong push.

XAUUSD: Mid-Term Analysis🪙 XAUUSD Analysis
You don’t need to guess. You can join from the blue box or the movement I’ve drawn on the chart.
📈 Context (The Story)
Treasury yields just fell for the 5th session, boosting the bullish case for XAUUSD as investors look for safety and positioning ahead of next week’s Fed meeting.
🚦 The Plan
✅ If price returns to the blue box, I will look for:
Footprint absorption (buyers defending the level)
CDV support or divergence
Structure reclaim to confirm entry
✅ If momentum continues along the drawn movement, I will join with risk-managed entries on clear reclaim setups.
⚡ Why It Matters
“People don’t like to be sold, but they love to buy.” – Jeffrey Gitomer
Today’s bullish backdrop is clear, but you only benefit if you enter with clarity, not FOMO.
🎯 Action Point
No predictions. No chasing. Let the setup align with:
Today’s bullish news as a backdrop
Technical confirmation in the blue box or reclaim areas
If it aligns, execute decisively with clear risk. If not, let it go.
The market rewards those who wait for the right price and the right moment. This may be that moment if the setup confirms.
📌I keep my charts clean and simple because I believe clarity leads to better decisions.
📌My approach is built on years of experience and a solid track record. I don’t claim to know it all but I’m confident in my ability to spot high-probability setups.
📌If you would like to learn how to use the heatmap, cumulative volume delta and volume footprint techniques that I use below to determine very accurate demand regions, you can send me a private message. I help anyone who wants it completely free of charge.
🔑I have a long list of my proven technique below:
🎯 ZENUSDT.P: Patience & Profitability | %230 Reaction from the Sniper Entry
🐶 DOGEUSDT.P: Next Move
🎨 RENDERUSDT.P: Opportunity of the Month
💎 ETHUSDT.P: Where to Retrace
🟢 BNBUSDT.P: Potential Surge
📊 BTC Dominance: Reaction Zone
🌊 WAVESUSDT.P: Demand Zone Potential
🟣 UNIUSDT.P: Long-Term Trade
🔵 XRPUSDT.P: Entry Zones
🔗 LINKUSDT.P: Follow The River
📈 BTCUSDT.P: Two Key Demand Zones
🟩 POLUSDT: Bullish Momentum
🌟 PENDLEUSDT.P: Where Opportunity Meets Precision
🔥 BTCUSDT.P: Liquidation of Highly Leveraged Longs
🌊 SOLUSDT.P: SOL's Dip - Your Opportunity
🐸 1000PEPEUSDT.P: Prime Bounce Zone Unlocked
🚀 ETHUSDT.P: Set to Explode - Don't Miss This Game Changer
🤖 IQUSDT: Smart Plan
⚡️ PONDUSDT: A Trade Not Taken Is Better Than a Losing One
💼 STMXUSDT: 2 Buying Areas
🐢 TURBOUSDT: Buy Zones and Buyer Presence
🌍 ICPUSDT.P: Massive Upside Potential | Check the Trade Update For Seeing Results
🟠 IDEXUSDT: Spot Buy Area | %26 Profit if You Trade with MSB
📌 USUALUSDT: Buyers Are Active + %70 Profit in Total
🌟 FORTHUSDT: Sniper Entry +%26 Reaction
🐳 QKCUSDT: Sniper Entry +%57 Reaction
📊 BTC.D: Retest of Key Area Highly Likely
📊 XNOUSDT %80 Reaction with a Simple Blue Box!
📊 BELUSDT Amazing %120 Reaction!
📊 Simple Red Box, Extraordinary Results
📊 TIAUSDT | Still No Buyers—Maintaining a Bearish Outlook
📊 OGNUSDT | One of Today’s Highest Volume Gainers – +32.44%
📊 TRXUSDT - I Do My Thing Again
📊 FLOKIUSDT - +%100 From Blue Box!
📊 SFP/USDT - Perfect Entry %80 Profit!
📊 AAVEUSDT - WE DID IT AGAIN!
I stopped adding to the list because it's kinda tiring to add 5-10 charts in every move but you can check my profile and see that it goes on..

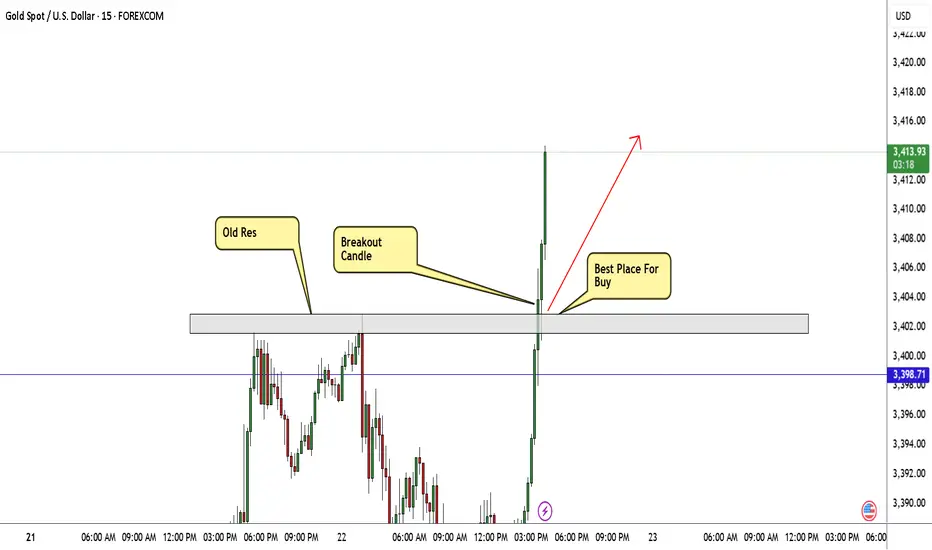
XAUUSD Technical Analysis – Resistance Turned Support, 📈 XAUUSD Technical Analysis – Resistance Turned Support, Bullish Continuation Expected
Gold (XAUUSD) has shown strong bullish momentum after breaking above the key resistance zone around $3,400, which now appears to be acting as a new support level. This structure shift signals a classic break-and-retest scenario, commonly observed in bullish continuations.
🔍 Key Observations:
Structure Shift: Previous resistance near $3,400 has been broken with strong bullish candles, suggesting buyer dominance. This level is now expected to serve as support.
Bullish Momentum: The move from the $3,320 support zone to above $3,430 was accompanied by clear trend formation and clean market structure, indicating sustained momentum.
Retest in Progress: Price is currently pulling back toward the new support zone ($3,400). If this area holds, a bullish reaction is expected.
Next Target: If support at $3,400 holds as expected, price could rally back toward the next resistance and projected target of $3,460.
📚 Educational Insight:
This setup illustrates the principle of resistance becoming support (RBS)—a foundational concept in technical analysis. After a breakout, a successful retest of former resistance often provides a high-probability entry point for trend continuation trades.

Gold Bulls Back in Control as Trump Pressures Fed for Rate CutsHey Realistic Traders!
President Trump is ramping up pressure on the Fed to cut interest rates , saying the U.S. is falling behind countries with looser policies. As several Fed officials begin to shift their stance, expectations for rate cuts are growing. That’s putting pressure on the dollar and giving gold a fresh boost.
We’ll take a closer look at what this means for OANDA:XAUUSD (Gold) through technical analysis and explore its upside potential.
Technical Analysis
On the 4-hour chart, Gold has moved above the EMA-200, signaling a shift in momentum to the upside. Price has also broken out of a Descending Broadening Wedge (DBW) pattern, which often indicates the start of a bullish trend.
The breakout was confirmed by a Bullish Marubozu candle, reflecting strong buying pressure. To add further confirmation, the MACD has formed a bullish crossover, reinforcing the upward momentum.
Looking ahead, the first target is seen at 3417. If reached, a minor pullback toward the historical resistance zone (green area) may occur, with a potential continuation toward the second target at 3500.
This bullish outlook remains valid as long as the price stays above the stop-loss level at 3271 . A break below this level would invalidate the setup and shift the outlook back to neutral.
Support the channel by engaging with the content, using the rocket button, and sharing your opinions in the comments below.
Disclaimer: "Please note that this analysis is solely for educational purposes and should not be considered a recommendation to take a long or short position on XAUUSD.

GOLD to the MoonHiper Clear Structure and the beginning of a new impulse towards 3.600 and 3.700
Hope everybody had a chance to got in
gg

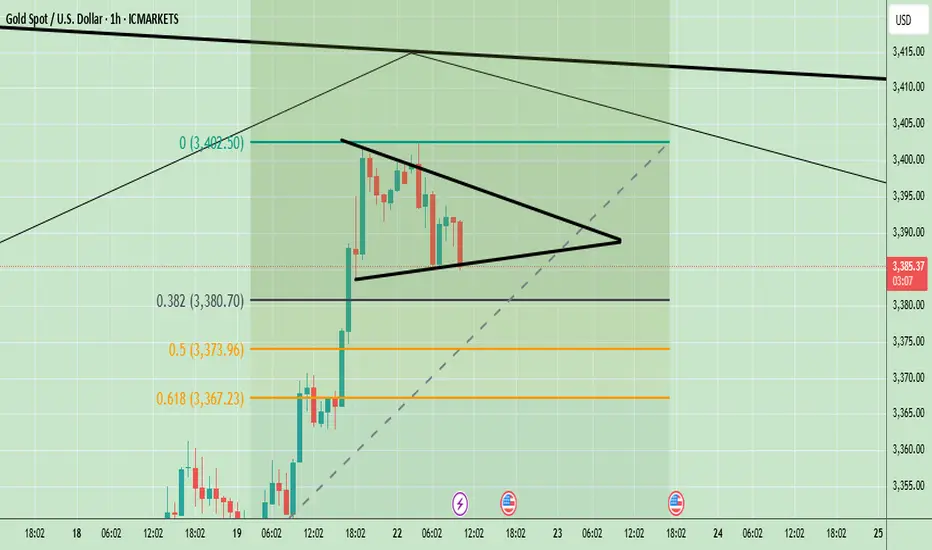
XAUUSD Technical Analysis – Triangle Breakout Ahead?Gold is currently consolidating in a symmetrical triangle pattern around $3,389. If it breaks above $3,402, we can expect a bullish continuation toward $3,420 and beyond. Key support lies at $3,367; a breakdown below this level would turn the trend bearish. The overall trend is still bullish, but a breakout is needed for confirmation.
📈 Potential Scenarios:
✅ Bullish Breakout Scenario:
- Break above $3,392–$3,402 zone.
- Targets: $3,420 > $3,450 > $3,480
- Supported by strong upward BOS (Break of Structure) and higher lows.
❌ Bearish Breakdown Scenario:
- Breakdown below $3,373–$3,367 zone.
- Targets: $3,355 > $3,345
- Would invalidate current bullish structure and form a lower low.
🔮 Trend Bias:
Bullish Bias remains intact as long as price stays above $3,367 and maintains higher lows. However, consolidation suggests waiting for breakout confirmation from the triangle before entering new trades.
🧭 Trend Outlook:
Gold is currently consolidating in a symmetrical triangle pattern, which typically precedes a breakout — either upward or downward. The price is holding above the key Fibonacci support levels and the overall market structure is bullish, suggesting an upward continuation is more likely if buyers maintain momentum.
Note
Please risk management in trading is a Key so use your money accordingly. If you like the idea then please like and boost. Thank you and Good Luck!
GOLD Still Bullish , Are You Ready For New Wave ? 200 Pips ValidHere is My 15Mins Gold Chart , and here is my opinion , we finally above 3400.00 and we have a 30 Mins Candle closure above this strong res , so i`m waiting the price to go back and retest this res and new support and give me a good bullish price action to can enter a buy trade and we can targeting 200 pips , and if we have a 4H Closure Above This res this will increase the reasons for buyers , just wait the price to back a little to retest it and then we can buy it . if we have a daily closure below it this idea will not be valid anymore .
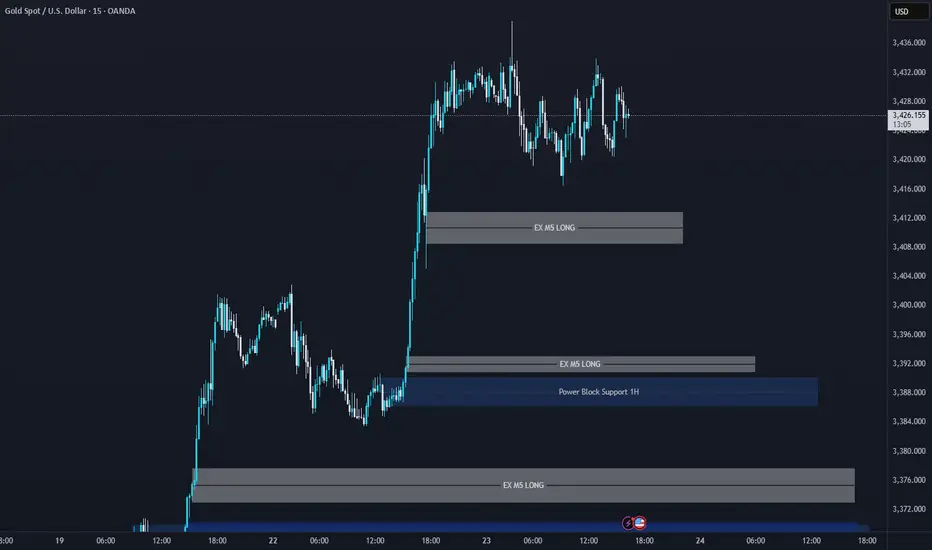
XAUUSD Support & Resistance Levels🚀 Here are some key zones I've identified on the H1/M15/M5 timeframe.
These zones are based on real-time data analysis performed by a custom software I personally developed.
The tool is designed to scan the market continuously and highlight potential areas of interest based on price action behavior and volume dynamics.
Your feedback is welcome!
gold still strong on buyinggold still taking the bullish stand, possible we expect price to keep buying if the H1 closes above 3405 area, then followed by M30 close below 3395 for selling.
the bullish is still strong depending on how the H1 react

The bulls rise and fall back to continue.Yesterday, gold technically held high and rose strongly in the Asian session relying on the 3350 mark. Both the European and American sessions formed a strong bullish rise and accelerated to break through the 3370 mark before the US session and continued to rise to the vicinity of the 3400 mark and fell back slightly to close strongly. The daily K-line closed with a shock break of the high-middle positive. The overall gold price broke through the recent rebound high of 3377 to form a bullish strong attack pattern. In the short term, 3377-80 became a new key support area.
From the 4-hour analysis, today's retracement relies on this position to continue to follow the trend of the main bullish bullish trend. The short-term bullish strong dividing line focuses on the 3350 mark. The daily level stabilizes above this position and continues to maintain the rhythm of retracement and bullish bullish trend. Short selling can only enter the market at key points, and enter and exit quickly without fighting.

gold on bulish reverse#XAUUSD await multiple breakout above 3389, possible target will reach new Day high 3305.
Entry at 3389 on 2 times breakout, target 3405 stop loss 3381.
Below 3380. on m15 closure will drop the price

Gold trend analysis: bullish but not chasing the rise.Gold, last Thursday's daily line closed with a long lower shadow, bottomed out and stabilized, and once again stabilized at the lower track support point of the large convergence triangle. Combined with the cyclical movement after the two stabilizations at 3247 and 3282, it was three consecutive positive rises; therefore, last Friday, and at least these two days on Monday this week, there will be consecutive positive rises; today gold rose as expected, the Asian and European sessions continued to be strong, and there was a second rise in the U.S. session. Since the U.S. session went directly higher before and after, the current support below has moved up to the 3377-75 area, where a top and bottom conversion position will be formed. Therefore, if it falls back to 3375-77 in the evening, you can continue to go long and look to above 3400. If it falls below 3370, it will fluctuate. The upper short-term resistance level is 3387-3393, the previous high. If the market touches here for the first time, you can try to see a double top decline.

Gold opening operation strategy.Gold's trend on Friday was mainly volatile upward. It can be said that gold was in a volatile market on Friday night, closing at 3350. If there is no stimulation from international news over the weekend, we will continue to be bullish next week. If your current gold operation is not ideal, I hope Tian Haoyang can help you avoid detours in your investment. You are welcome to communicate with us!
From the 4-hour analysis, the short-term support below continues to focus on around 3340-45, and the strong support is at the 3310 level. The key pressure above is the 3380 line. We will rely on this range to maintain the main tone of high-altitude and low-multiple cycles. For the middle position, we will watch more and do less, and be cautious in chasing orders, and wait patiently for key points to enter the market.
Investment is not a matter of one day or one night. Losses in the early stage do not mean losses in the later stage; profits in the early stage do not mean profits in the later stage. Therefore, friends who lose money should not be discouraged, and friends who make profits should not be complacent. Let yourself invest rationally with a peaceful mind. In this ever-changing market, the rise and fall of the market is not determined by personal subjective will, but is full of more than empty fights. Victory and failure are always around, but one thing is that the trend of the market will determine the future direction. The three steps of setting the trend, selecting the position, and controlling the position are success. Therefore, choice is far greater than hard work. Choosing a good teacher will benefit a lot, and I have always been there.

Gold opening market trend analysis.Last week, the gold price rebounded after hitting the low of 3310. The 4-hour chart shows that the Bollinger Bands failed to open downward, and the current market still maintains a volatile trend. Although the short-term price is easy to rise and difficult to fall, it should be noted that the three-month adjustment cycle is coming to an end when the fundamentals of the bull market remain unchanged, and the daily level change window is approaching. It is recommended to focus on preventing risks (especially short-term operation risks) at the opening today and wait patiently for the unilateral market start signal. In terms of short-term operations, the hourly chart price broke through the key level of 3344 after stepping back to the support of 3332. Today's overall trend is volatile and bullish. It is recommended to wait for the price to fall back to the 3337-3342 range to arrange long orders in batches at the opening today. Focus on the 3356-3366 resistance band above. If you encounter resistance, you can try short-term operations. Be sure to strictly stop losses to prevent the risk of false breakthroughs.

Gold continues to rise.The gold hourly line fell slightly to 3346 this morning and stabilized. It bottomed out and pulled up again to stand on the middle track of the hourly line, which means that the short-term stabilized and the overnight 3361 suppression adjustment ended. Looking at the second pull-up, this should have happened in the US market last Friday, but it was delayed until today. Finally, it successfully reached the 3366 target and hit the 3370 line;So today's Asian market rose, the European market continued to break high, and the US market still had a second pull-up; but because it is in a period of shock, wait patiently for a wave of stabilization before taking action. The reference point to choose is to pay attention to the 3382 split support, that is, 3361-60, which happens to be the top and bottom conversion support point, followed by 3358-56, 50 split support and the middle track, the limit is here, and then the starting point of 3350 cannot and should not break, otherwise it will encounter shocks and washes back and forth; the upper resistance level is concentrated at 3390-3395. It is expected that 3390 will not be able to break through in one breath for the time being. You can try to see a decline when you approach it for the first time;

The general trend is to go long after the retracementFrom the 4-hour analysis, the short-term support below is 3370, the important support is 3350-55, and the upper resistance is 3400-05. The overall support range is maintained in this period to maintain the main tone of high-altitude low-multiple cycle participation. In the middle position, watch more and do less, be cautious in chasing orders, and wait patiently for key points to enter the market. I will provide specific operation strategies in the link prompts, please pay attention in time.
Gold operation strategy:
1. Go long on gold when it falls back to 3370, and add more positions when it falls back to 3350-55, stop loss 3344, target 3395-3400, and continue to hold if it breaks;

XAUUSD Bullish Signal | Technical + Custom AlgoSmart Trend Signal | Technical Analysis + Custom Algorithm
This signal is the result of a combination of classic technical trend analysis and a proprietary software I personally developed.