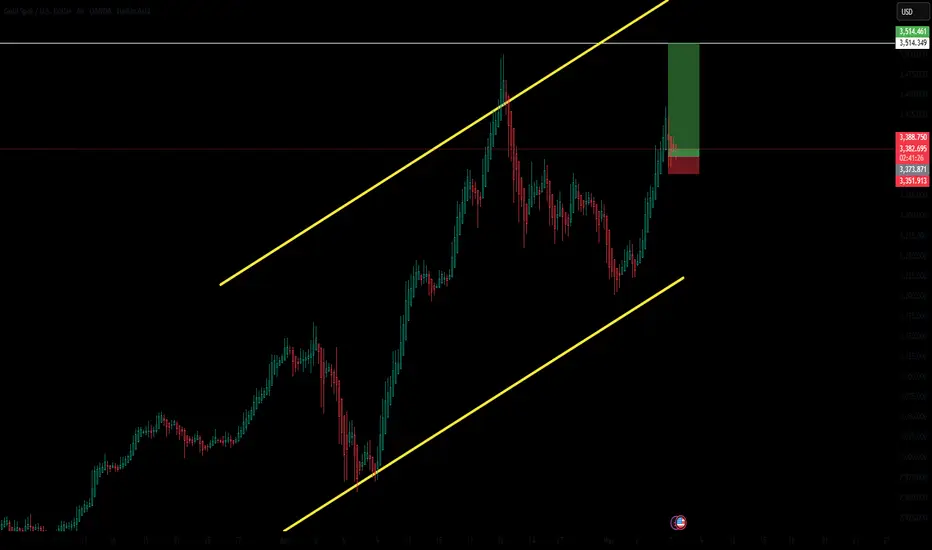
Gold to 3510 ?There is a possible bulllish move on the 4 hour chart.
Fed meeting will give gold a boost.
Stop loss: 3350
Take profit: Around 3510
Xauusdlong
XAUUSD Market NewsThe international geopolitical situation has suddenly escalated, fueling market risk aversion and pushing up gold prices. But today's Fed interest rate decision and Powell's speech will be crucial in the bull-bear battle. Technically, gold saw violent fluctuations in the Asian session. Be cautious of a deep pullback after a sustained moderate rise, which may signal weakening bullish buying power. If the key resistance level of 3400 isn't broken today, the likelihood of a short-term top will rise significantly.
In terms of strategy, avoid chasing prices at highs. Focus on the Fed's interest rate meeting's impact on the real interest rate curve and the dollar index. If the policy tone is dovish, precious metals may keep rebounding technically; if hawkish, watch out for a pullback. The current upper pressure range is 3397-3407, and the lower support is 3360-3350. Operationally, opt for buying on dips, and use short selling at rebound highs for risk hedging.
Trading is not gambling. Do not trade impulsively. It is wrong to bring any emotions into trading. I share my trading strategies every day. I hope to help as many people as possible. If you happen to need it, you can come and have a look. There is no loss for you. Believe me, the result will satisfy you.

GOLD Bullish Breakout!
HI,Traders !
GOLD is trading in an uptrend
And the price made a bullish
Breakout of the key horizontal
Level of 3350.56$ and the brekaout
Is confirmed so we are bullish
Biased and we will be expecting
A further bullish continuation !
Comment and subscribe to help us grow !

Crazy trading opportunity. XAUUSD/goldSupplement the deficiencies in the previous article.
News from the New York market once again stimulated the rise of XAUUSD/gold, which is a sustained rise. Data news once again ignited the XAUUSD market, and the swing trading target is 3440. The current price is 3410, and there is still about 30 US dollars/ounce of fluctuation space for trading.
For details, please pay attention to the real-time trading opportunities announced by the swing trading center later.

New York market XAUUSD trading opportunities.The 3400 position has been broken. Short-term bulls are still strong. The swing buying we executed all day today has made continuous profits. Such one-sided market conditions in trading have good profits. But the premise needs to be executed. This requires execution and courage.
Teacher Ludvig pointed out that the probability of reaching the target 3440 before tomorrow's London market is more than 90.36%. So this is a good buying opportunity for traders who don't know how to trade now.
The precise trading points are released in the Swing Trading Center. If you don't know what to trade now. Then you can refer to it.
Control trading risks according to the capital situation when trading.

Gold price fell after a high? Trend reversal?Analysis of Asian morning session:
The recent high point of gold price reached 3437 US dollars, and it fell sharply after the Asian morning session opened. The gold market opened after the Asian holiday, and the bulls rose strongly; the Asian morning session was volatile, and the current lowest reached around 3360, a drop of 77 US dollars.
Then it adjusted back and reached a high of around 3404; this position can be used as an important resistance level at the opening time of the Asian session. Between the sharp rise in the morning of the past two days, and the upward continuity of the European and American sessions, coupled with the recent continuous rise and fall, the rapid fall in the Asian morning session.
Quaid believes that in this continuous upward pattern, once there is a sharp fall, it is also likely to be a signal of insufficient bullish power in the short term; then we need to consider whether the bears can reverse, and the current upper pressure position is at 3395 US dollars, and the lower support level is at 3360 US dollars, which is equivalent to the previous top and bottom conversion.
Operation strategy:
Short when the price returns to 3390, take profit at 3370-3360, stop loss at 3400.
Good luck to everyone.

Gold is once again experiencing its extreme take-off trend!📌Fundamentals:
1. There are signs of escalation in the India-Pakistan conflict
2. The Fed's interest rate decision dominates this week's market
3. The international trade situation disturbs market sentiment
4. Market sentiment and capital flows
📊Technical aspects:
The 4-hour cycle still needs a wave of strength, and it needs to go out of a wave of big rises before it can open the Bollinger upper track to form an absolute unilateral strength. Therefore, although it is temporarily bullish, there is also a certain possibility of adjustment. The current 4-hour cycle support is around 3310, and the small cycle performance support is around 3350, so don't chase more.
🎯Practical strategy:
Gold pulls back to around 3365-3375 to go long, and the target is around 3400-3420.

Gold is rising strongly. When can the bull market stop?🗞News side:
1. Trump announces renegotiation of USMCA
2. Pay attention to the Fed interest rate
📈Technical aspects:
Looking at the daily chart, gold prices are breaking through important resistance levels and forming a strong upward trend. The price is currently trading around 3410, with strong suppression at 3420-3430 above the short-term. If the gold price encounters resistance and pressure, gold may once again experience a correction. Therefore, when the gold price touches the 325-3435 line, you can try to place a short position. In terms of operation, after two consecutive positive days on the technical front, the bulls will continue further. The current short-term support has moved up to the 3386 line. 3386 is the early resistance that turned into support after breaking through. This will be an important support level. At the same time, the 3270-3260 line support below is still strong. Continue to look at the 3430-3450 line. Therefore, in terms of operation, we mainly do long positions on callbacks and supplementary short positions on rebounds.
If you agree with this view, or have a better idea, please leave a message in the comment area. I look forward to hearing different voices.
OANDA:XAUUSD FX:XAUUSD FXOPEN:XAUUSD FOREXCOM:XAUUSD TVC:GOLD

Wed 7th May 2025 XAU/USD Daily Forex Chart Buy SetupGood morning fellow traders. On my Daily Forex charts using the High Probability & Divergence trading methods from my books, I have identified a new trade setup this morning. As usual, you can read my notes on the chart for my thoughts on this setup. The trade being a XAU/USD Buy. Enjoy the day all. Cheers. Jim
Note: This isn’t a great setup as price is already at the previous high and the MACD is just below the zero level. But I had to take it because I am committed to my MSH (multi sequence hedging) strategy. So if you are a traditional type trader, then standing aside on this trade would probably be the smart thing to do.

The most important golden strategy📌Fundamentals:
Focus on the Federal Reserve's interest rate decision
📊Technological aspects:
From the golden hour chart, the Asian market is in line with a wave of continued gains and the subsequent adjustment to the 10 moving average of 3350 has stabilized. The European market has slowly moved higher and is approaching the Asian market high. This pattern is still very strong, and there is a high probability of a second rise tonight; The 10 EMA is above 3370 as the primary support and continues to be bullish. As each line closes, the moving support will slowly move up. As long as it does not effectively break, the short squeeze will continue. A breakthrough of 3410 will also happen at any time. If it breaks through, it will be easy to continue to storm above 3420. If it rushes higher and falls back in the evening and falls below the 10 EMA, then If it adjusts to the middle track for the first time, there will still be good support, just continue to be bullish; comprehensively speaking, today's short-term gold operation ideas suggest that the callback is mainly long, and the rebound is supplementary.
🎯 Practical Strategy:
Short strategy: short gold when it rebounds around 3425-3430, target around 3400-3380.
Long strategy: long gold when it pulls back around 3365-3370, target around 3400-3420.

Gold is back on strong footing, follow me and make moneyFrom the daily chart, the gold price is breaking through the important resistance level and forming a strong upward trend. The price is currently trading around $3,400 and has successfully broken through the key resistance area of $3,330. The Bollinger Band indicator shows that the middle track is at 3231.01, the upper track is at 3485.06, and the lower track is at 2976.97, indicating that the current price is near the upper track of the Bollinger Band, showing strong upward momentum.
The RSI indicator shows that the current value is 64.07, which is in the neutral to strong area. It has not yet reached the overbought level and still has room to rise.
The gold price has maintained a steady upward channel since 2025, and has recently formed a short-term rising flag consolidation, which is usually regarded as a bullish continuation pattern. The key support is at $3,300 and $3,230 (corresponding to the rising trend line), while the resistance is at the psychological level of $3,400 and $3,500. If it can stand firm at $3,400 in the short term, it is expected to hit the historical high of $3,499.83, and once it breaks through, it will open up the possibility of higher prices.
To sum up, gold is still mainly based on falling back and going long

GOD BUY GREAT TUESDAY
Greetings traders this is my analysis on gold and its a long for buy
Technical analysis of gold
informatoin ; Head and Shoulders
this pattern is now even more clearly presented with.
Head_ a higher peak (higher high)
Left shoulder_a weaker atempt recover , which confirms the loss of bullish strength
Usually, such a pattern is followed by a corrective move downwards (which has already been partially see)
potential trend change zone
Highlighted support in zone
3345_3325 usd _very imortant for confirming the bullish scenario.
the shown ''bounce zone'' suggests a possible purchase if the price bounces from this area
predicted path expected
fall to support (around 3345_3325 USD
Conclusion and strategy
Scenario 1(main) buy zone between 3357 3335 if price action signal is seen (pin bar engulfing
TARGET 3500+
Stoploss: Bellow 3300 support
Scenario2 (riskier) : If price does not bounce from that zone possible further deepening towards 3250 3215
Dear Traders like comment let me know what do you think

There's still a little more left to sip from gold’s cup
Weekly Outlook on Gold (XAUUSD)
Gold has formed a classic cup pattern on the weekly timeframe, indicating a strong bullish continuation setup. If the pattern completes successfully, we could see a move toward the top of the channel, targeting the 4039 – 4100 zone.
The recent pullback to 3208 was a retest of the previously broken daily structure, acting as a healthy correction before the next potential leg up.
For those looking to enter this move, an ideal strategy would be to place a buy stop order above the last high, as a breakout confirmation.
⚠️ Important note: If the black trendline on the daily chart (which represents the current bullish structure) gets broken to the downside, the trade setup would become invalid and a reassessment would be required.
✅ The best approach is to wait for a clean breakout above the 3495 resistance, then look for a pullback entry on lower timeframes with proper risk management.
📉 In the longer term, we still expect a potential retracement all the way back to the 2199.661 level — so be aware of the bigger picture and adapt as the structure evolves.

XAU/USD (GOLD) TRADE PLAN 6/5/2025XAU/USD (Gold) Trading Outlook
The current price of XAU/USD around 3380 to 3375. We are anticipating a pullback towards the 3300 level, at which point we will look for long (buy) entry opportunities.
Key Resistance/Target Level:
TARGET 1: 3400
TARGET 2: 3450
TARGET 3: 3480
Key Support Levels:
SUPPORT 1: 3200
SUPPORT 2: 3150
This Strategy is based on the expectation of a price retracement, providing a more favorable risk-reward setup for long positions.

Gold XAUUSD Move 06.05.2025🔹 BUY-1: 3350–3355 Zone
Conditions to Enter:
Support must hold at the 3350–3355 zone.
Wait for a clear bullish M15 candle close above the support area to confirm strength.
Rationale:
This zone overlaps with a Fresh Demand Zone identified on your chart.
Entry here takes advantage of potential accumulation and demand absorption.
It's an early entry with a tighter stop loss (just below 3346–3350).
Ideal Setup:
Stop Loss: Below 3346.
Target: Near 3380–3400 zone or higher depending on momentum.
🔹 BUY-2: 3380–3385 Zone
Conditions to Enter:
Price must break above the 3380–3385 resistance zone.
Wait for a successful retest and bullish confirmation (engulfing/imbalance/M15 close above).
Rationale:
This is the breakout and retest trade mentioned on the chart.
Entering after confirmation reduces risk of a fakeout.
Aligns with institutional breakout behaviors.
Ideal Setup:
Stop Loss: Below the retest candle or previous structure (~3370 area).
Target: 3410–3430+ depending on R/R and momentum continuation.
Kindly show your support by follow, comment and share.

XAUUSD (GOLD) | 4H | SWING TRADING Good morning, my friends,
Gold is currently at the 3355.0 level.
Even if gold makes a correction at this point, my target remains 3461.0.
This is a swing trading model, so there may be delays in reaching my target. However, I am confident that I will reach it eventually.
Once we hit that level, I will share an update for you all.
Dear friends, your likes are always my biggest motivation to keep sharing analyses. That’s why I kindly ask each of my followers to show their support—please don’t hold back on the likes.
I sincerely thank everyone who supports me with their likes. It truly means a lot

It is in an upward trend with fluctuations, and the overall viewFrom the perspective of the intraday price action, gold exhibits the typical feature of a rapid rally after a small-cycle correction. On the daily chart, the K-line combination continues to be in a bullish arrangement, and the moving average system shows a divergent upward trend. The technical pattern conforms to the characteristics of a "stepped short squeeze", and there is a relatively high probability that the upward trend will continue in the future.
Taking into account both fundamental and technical factors, the current gold market is still in a strong pattern dominated by the bulls. In terms of the trading strategy, it is recommended to focus on going long on pullbacks. At the same time, be vigilant against the risk of short-term fluctuations triggered by an unexpectedly hawkish tone of the Federal Reserve's policy.
During the US trading session, the price of gold rose to 3,399 and then declined. It is currently quoted at 3,395. The K-line combination pattern on the 4-hour chart is bullish. There is a relatively low probability of a significant trend change on Wednesday, and it is expected to continue to rise in a volatile manner tomorrow.
The short-term support is at 3,374, and the strong support is in the range of 3,370 - 3,366. The short-term resistance is at 3,388, and the strong resistance is at 3,398. If this level is broken, the upward target can be seen at 3,410.
Regarding specific price levels, the area between 3,430 - 3,470 US dollars per ounce (the resonance resistance of the Fibonacci extension level and the previous densely traded area) needs to be closely watched on the upside. On the downside, the support zone between 3,260 - 3,250 US dollars per ounce (the double support of the bullish trend line and the round-number psychological barrier) should be closely monitored.
you are currently struggling with losses, or are unsure which of the numerous trading strategies to follow, at this moment, you can choose to observe the operations within our channel.
Trading Strategy:
buy@3375-3380
TP:3400-3430

Short-term entry can be made at key points.📊Technical aspects:
|Gold showed a clear upward trend today driven by risk aversion, mainly because Trump announced a 100% tariff on films produced overseas, a move that triggered global concerns about trade wars and exacerbated economic uncertainty. In order to avoid risks, investors have turned to traditional safe-haven assets such as gold, resulting in a surge in demand for gold and a subsequent rise in prices. Currently, from the perspective of technical indicators, the 4-hour moving average is in a bullish arrangement, the Bollinger band is in an enlarged form, and the gold price is running close to the upper Bollinger band. Gold is still bullish, but the RSI shows overbought. Don't chase highs and beware of gold's highs and falls. It is recommended to go long again after a pullback.
🎯Practical strategy:
Go long when gold falls back to around 3385-75, with a target of around 3400. If it does not break, you can go short near 3400 and see a fall back near 3384.

Gold has a pressure level of 3397 and a support level of 3368Gold hit a new high, with the high point near 3397. From the gold hourly chart, 3397 is still an obvious pressure, and the support below is around 3368
We can go short around 3397, and then go long when it falls back to 3368

Long positions in the US market remain the main trend🗞News side:
1. The “demand shock” of the Trump administration’s tariffs on the global economy
2. The United States rejected Japan’s request for a comprehensive exemption from 10% reciprocal tariffs and country-specific tariffs in recent negotiations.
3. The conflict between Israel and the Houthis
📈Technical aspects:
The 4H golden moving average spreads upward, the MACD golden cross opens upward, and the 4H overall bullish trend is seen. Gold price encountered resistance at 3386 in the morning of the Asian session. This point can be used as a reference in suppressing the market outlook. If this resistance is effectively broken through, bulls are expected to continue to work towards the 3400 first-line mark above. The daily chart is positive, and the K-line combination is relatively strong. The US market is expected to break through 3386 and reach the space above 3400; the SMA10 moving average of 3370 continues to be bullish as the primary support, with strong resistance to 3400. Even if the price of gold in the US market rises and falls, the middle track of the Bollinger Bands still has good support. On the whole, we mainly focus on long positions in short-term trading. We can consider the 3370-3380 layout to go long, with the target looking towards 3400-3410 above.
If you agree with this view, or have a better idea, please leave a message in the comment area. I look forward to hearing different voices.
TVC:GOLD FOREXCOM:XAUUSD FXOPEN:XAUUSD FX:XAUUSD OANDA:XAUUSD

3419 , gold price can reach today⭐️GOLDEN INFORMATION:
Gold price (XAU/USD) pulls back slightly from its intraday peak near a two-week high reached during Tuesday’s Asian session, but remains firm around the $3,360 mark, extending its winning streak for a second day. Improved US economic data has helped temper recession fears, offering modest support to the US Dollar. Meanwhile, signs of a potential thaw in US-China trade tensions have curbed safe-haven demand for gold, prompting some investors to adopt a wait-and-see approach ahead of the highly anticipated two-day FOMC policy meeting.
⭐️Personal comments NOVA:
Bulls regain the upper hand, uptrend nears 3400 ahead of market interest rate cut expectations
⭐️SET UP GOLD PRICE:
🔥SELL GOLD zone : 3418- 3420 SL 3425
TP1: $3410
TP2: $3400
TP3: $3385
🔥BUY GOLD zone: $3323 - $3321 SL $3316
TP1: $3330
TP2: $3340
TP3: $3358
⭐️Technical analysis:
Based on technical indicators EMA 34, EMA89 and support resistance areas to set up a reasonable BUY order.
⭐️NOTE:
Note: Nova wishes traders to manage their capital well
- take the number of lots that match your capital
- Takeprofit equal to 4-6% of capital account
- Stoplose equal to 2-3% of capital account

GOLD Price Analysis: Key Insights for Next Week Trading DecisionGold ended last week under pressure as investors booked profits following improved risk appetite, driven by easing trade tensions and a strong U.S. labor market report.
📰 NFP came in at +177K in April, with the unemployment rate steady at 4.2%, matching forecasts—possibly keeping the Fed cautious on policy easing.
Technically, Gold remains bullish but is now testing the $3,200 support zone, and sellers are gaining momentum.
As we head into next week, gold price action is at a critical decision point, and whether buyers or sellers will take control is unclear.
In this video, I break down the key technical zones, share my trading plan, and discuss potential opportunities to help navigate the uncertainty ahead.
Disclaimer:
This is my take based on experience and what I see on the charts. It’s not financial advice—always do your research and consult a licensed advisor before trading.
#GoldAnalysis #XAUUSD #GoldPrice #ForexTrading #TechnicalAnalysis #FundamentalAnalysis #GoldOutlook #FedRateDecision #NFP #GoldBreakdown #GoldBulls #GoldBears #USJobsReport #ForexMentor

The Precision Sniper🧱 Market Structure
Recent Bullish BOS (Break of Structure) confirms buyer control.
Price is attempting a range breakout above key consolidation zone.
Next target: 3,488–3,500 (Swing High / Liquidity zone).
📌 Key Zones
Support: 3,320 – 3,340 (top of the box = retest area)
Resistance/Target: 3,488 – 3,500
Demand Zone (4H GZ): 3,120 (marked as deep institutional re-entry point)
📊 Indicators Aligned
EMAs are bullishly stacked (momentum up).
Volume increasing on bullish candles (breakout fuel).
Stoch RSI overbought (watch for short-term cooldown).
⚔️ Strategy at This Moment
Primary Bias: Bullish
Action:
Wait for a 4H candle close above the box
Enter on retest of the box top or small demand wick with confluence (e.g., bullish engulfing)
Protect trade with tight SL (below box or bullish candle low)
🎯 Targets:
TP1: 3,450
TP2: 3,488–3,500 (swing high)
❌ SL: 3,320 or tighter based on entry candle
🎯 Traits & Strengths
✅ Identifies structure early (BOS, CHoCH)
✅ Uses volume and EMAs to confirm breakout momentum
✅ Recognizes institutional footprints (e.g., GZ zones, wicks, liquidity grabs)
✅ Always waits for confirmation before entry — no emotional entries
✅ Backtested strategy and trusts the process
🔐 Trading Creed
“ Price is noise. Structure is signal. I only enter where the weak exit. ”
