XAU/USD 1H Outlook
FVG Fill (3320–3318)
Price is expected to drop into the unfilled Fair Value Gap between 3320 and 3318.
London/NY Liquidity Hunt
After filling the FVG, look for a swift bullish impulse during the London and New York sessions to trigger stop-runs and collect liquidity.
Downward Correction to 3305 & 3298
Once the liquidity grab completes, expect a retracement:
First target: 3305
On a break below 3305, next target is the unfilled FVG at 3298
Summary:
Drop → FVG fill (3320–3318) → Bullish liquidity hunt (London/NY) → Retracement toward 3305 (then 3298)
Xauusdlong

gold on sell#XAUUSD on retest, price on a third pattern which needs to correct below.
Firstly breakout below 3317, target 3310-3303, stop loss 3326
The manipulation in the market is strong, breakout above 3330 can not fully buy but reverse down below.

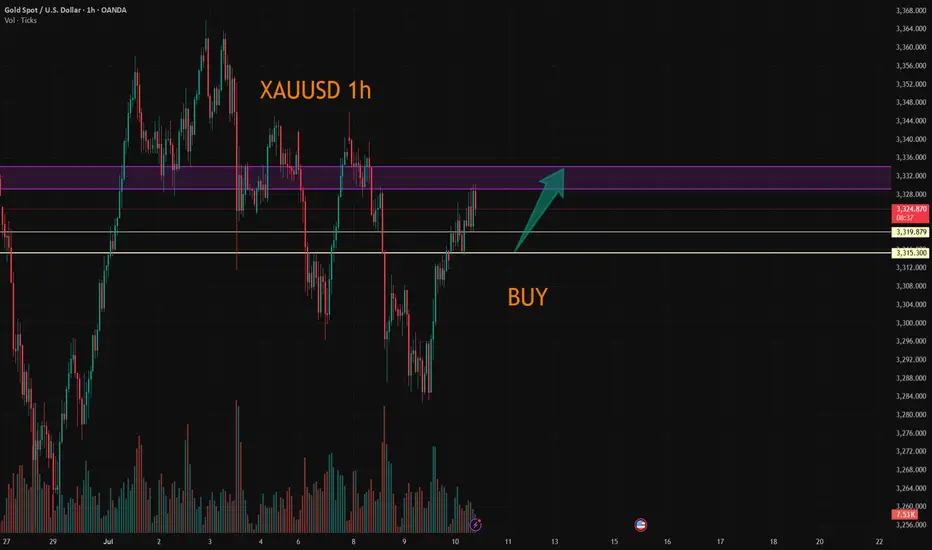
XAUUSD:Wait for 3315-19 to go long.
The market is experiencing short-term narrow-range fluctuations. There is a certain level of pressure at 3330. I tend to view it more positively as a breakthrough.The trading range for today has narrowed.
Trading Strategy:
BUY@3315-19
TP3329-34
I will closely follow up on every trading strategy I develop. If you are unsure about how to conduct a trade, you can simply come to me for help.
More detailed strategies and trading will be notified here ↗↗↗
Keep updated, come to "get" ↗↗↗
Key point layout suggestionsThe current gold market is showing a weak rebound pattern. Although there was a small rebound on Wednesday, if it cannot stand above 3330, the overall trend will still be weak.
From the daily level, the support level is 3300 and the resistance level is 3335. The price is oscillating between the middle and lower tracks of the Bollinger Bands, and there is a possibility of upward or downward breakthrough.
Focus on the H4 cycle trend: if the rebound can stand above 3330, the price may further rise to 3335 US dollars;
Once it stands at 3335, it can be basically confirmed that the callback is over, and the subsequent challenge of 3345 resistance level may be repeated.
It is recommended to adopt a long-on-dip strategy near the support level, focusing on the support strength of the 3310-15 area below; the resistance level of 3335-3340 should be paid attention to above.
In terms of specific operations, if the price rebounds to the 3335-3340 range, short selling can be considered; if it pulls back to the 3310-3315 range, long selling can be considered.

7/9: Focus on Selling Gold on ReboundsGood evening, everyone!
Apologies for the late update today—I had some matters to attend to. I hope your trades are going smoothly.
Yesterday, gold found support around 3284 and continued to rebound during today’s session, reaching as high as 3330. The key resistance at 3321 has now been broken and is currently acting as a short-term support level. However, based on the current price structure, this level is likely to be retested multiple times, and some consolidation may follow.
The next major resistance lies between 3337 and 3343. In the absence of strong bullish momentum, the preferred short-term strategy remains selling on rebounds, especially near resistance zones.
⚠️ Additionally, the U.S. Initial Jobless Claims data will be released during the New York session tonight, which may cause increased volatility and potentially whipsaw price action. Be cautious with position sizing, and avoid emotional trades or chasing price action during news releases. Patience and discipline will be key.

XAUUSD Analysis todayHello traders, this is a complete multiple timeframe analysis of this pair. We see could find significant trading opportunities as per analysis upon price action confirmation we may take this trade. Smash the like button if you find value in this analysis and drop a comment if you have any questions or let me know which pair to cover in my next analysis.

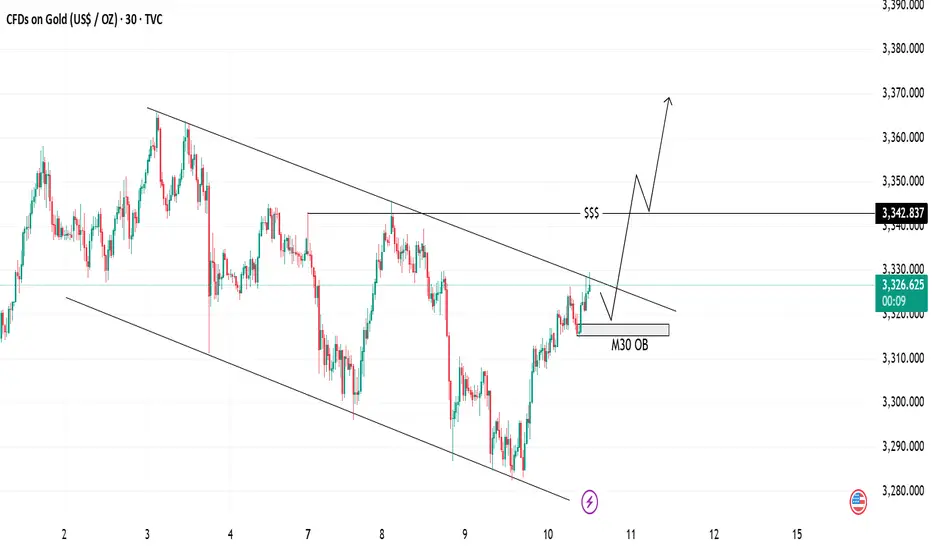
Gold Analysis Bullish Breakout | Trendline & OB Setup📈 Gold Analysis
We are currently seeing price action within a descending channel, testing key support at the M30 OB (Order Block). The price is pushing higher after bouncing off the support level, and the trendlines suggest a potential breakout to the upside.
💡 Key Levels:
Support Zone: 3326
Resistance Zone: 3342
The market is primed for a possible rally, indicated by the upward momentum and price breaking out above the trendline. Watch for confirmation as we approach the liquidity level for further bullish movement.
⚡ Trade Idea: Look for a long entry if price closes above the trendline for a continuation towards the next resistance.
GOLD Intraday Chart Update For 10 July 25Hello Traders,
as you can see that GOLD is stuck in tight range between 3300-3330 all eyes on clear breakout for now
further only market will break clearly 3345 level then we will consider market will move further advance below 3300 GOLD will move towards 3250
Scalping Range 3300 - 3330 for the short time period
Disclaimer: Forex is Risky

XAUUSD:Stay long
Today's Shock Trading strategy:
Day traders can buy long positions at 3318-23 with a target range of 3340-45
Median traders please refer to the previous thinking unchanged.
More detailed strategies and trading will be notified here ↗↗↗
Keep updated, come to "get" ↗↗↗

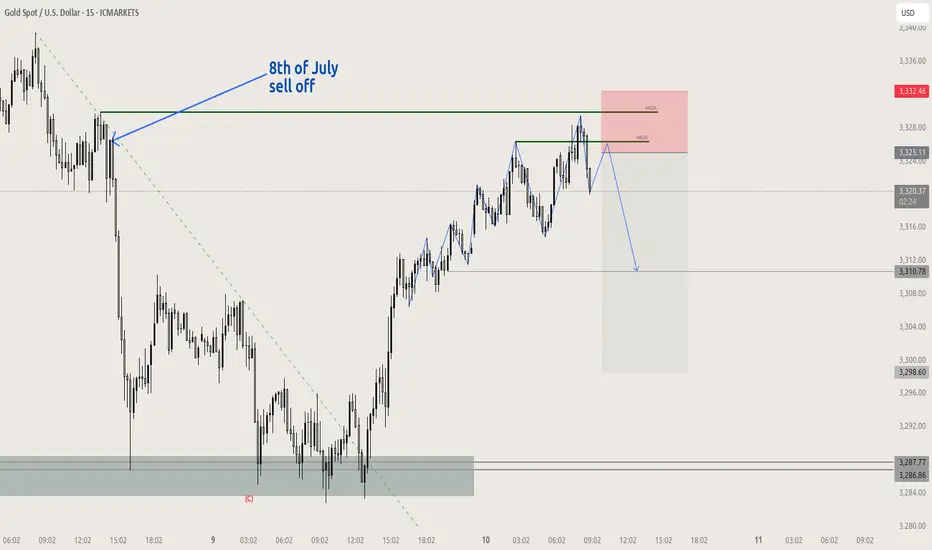
XAUUSD swing failure with FVGpotential short setup, loads of liquidity from 8th of july sell off, if no retest before reaching local new lows ( mid range of target) look for continuation buys
XAUUSD Loses Short-Term Support – Deeper Decline May FollowAt the current moment, gold (XAUUSD) has made a significant breakout, surpassing the key resistance zone at 3,326 USD and is now trading around 3,328.94 USD. This breakout confirms that the short-term bullish trend remains strong.
1. Short-Term Trend: Bullish Momentum Expands
After holding the key support zone around 3,311 – 3,315 USD (aligned with the 0.618 Fibonacci retracement), XAUUSD bounced back and broke above the previous high at 3,326 USD. The current uptrend is confirmed by higher lows and a clear breakout candle from the recent consolidation.
2. Updated Support and Resistance Zones:
Immediate Support: 3,318 – 3,320 USD, near the rising yellow trendline and breakout retest zone.
Next Resistance Target: No clear barrier on the 15-min chart, but psychological levels and Fibonacci extensions suggest 3,332 – 3,335 USD could act as the next upside targets.
3. Price Action Highlights:
The breakout candle closed strongly above the 3.618 Fibonacci extension level (3,326.26 USD), showing solid buying pressure.
A bullish signal ("B") from LuxAlgo was triggered near the minor pullback at 3,318 USD, adding further confirmation.
4. Key Technical Signals:
Price has broken out of the purple rectangle consolidation zone, expanding its trading range.
The 0.618 Fibonacci level at 3,311.78 USD continues to act as firm support.
The ascending yellow trendline remains intact, providing dynamic support to the bullish trend.
5. Suggested Trading Strategy:
Buy on Pullback: Consider long positions around 3,318 – 3,320 USD if price retests this zone with bullish confirmation.
Breakout Continuation Buy: A firm close above 3,330 USD with high volume could signal a move toward 3,335 – 3,340 USD.
If price falls below 3,315 USD and closes weakly, the bullish momentum may begin to fade.
XAUUSD is in an extended bullish phase after breaching the 3,326 USD resistance. As long as price holds above the 3,318 – 3,320 USD zone, there is room for the uptrend to continue.
Do you think gold will break above 3,330 USD? Drop your thoughts in the comments and let’s discuss trading strategies together!

XAUUSD Idea: 4H Trendline First Breakout - Liquidity PlayFOREXCOM:XAUUSD
🔍 Analysis Overview:
Price has just broken above a 4H descending trendline for the first time. However, I remain cautious due to the following key observations:
📌 NOTES:
The broader market sentiment is still bearish due to recent tariff-related news, which often fuels risk-off behavior.
Historically, the first breakout of a strong trendline often fails, trapping early buyers.
This breakout is likely attracting buy-side liquidity, giving institutions an opportunity to hunt stops.
My observation shows buying interest started around the 3308–3313 range, suggesting smart money accumulation and a possible trap.
📉 I'm watching for a fake breakout and potential reversal targeting the liquidity zones marked below around 3307 and possibly lower.
The liquidity sweep below equal lows could offer a better risk-reward setup.
💡 Conclusion:
If price fails to hold above this breakout and shows signs of rejection, I will be anticipating a return towards the previous demand zone for a liquidity grab.
#XAUUSD #GoldAnalysis #SmartMoneyConcepts #LiquidityGrab #ForexTrading #TrendlineBreak #MarketPsychology #TradingSetup #SMC #PriceAction

Start buying gold, a rebound may come at any time!Gold is undoubtedly weak at present, and bears have the upper hand. However, since gold touched the 3290-3280 area, gold bears have made more tentative moves, but have never really fallen below the 3290-3280 area, proving that as gold continues to fall, bears have become more cautious.
From the perspective of gold structure, multiple technical structural supports are concentrated in the 3285-3275 area, which makes it difficult for gold to fall below this area easily. After gold has failed to fall below this area, gold is expected to build a short-term bottom structure with the help of multiple supports in this area, thereby stimulating bulls to exert their strength and a rebound may come at any time.
Therefore, in the short term, I do not advocate chasing short gold; instead, I prefer to try to find the bottom and go long gold in the 3290-3280 area; but we should note that because gold is currently in an obvious short trend, we should appropriately reduce the expectation of gold rebound, so we can appropriately look at the rebound target: 3305-3315 area.

4-Hour Chart Strategy: Sell High, Buy Low Within 3280-3325 RangeBased on the 4-hour analysis 😎, today's short-term resistance above focuses on the hourly top-bottom conversion level around 3318-3324 🚫. If there's an intraday rebound leaning on this zone, first go short to target a pullback ⬇️. The short-term support below is around 3280 🔍. Overall, rely on the 3280-3325 range to maintain the main strategy of "shorting at highs and buying at lows" in cycles ✅. For prices in the middle of the range, always watch more and act less 👀, be cautious of chasing orders 🚫, and wait patiently for key levels to enter positions 🕙
Strategy:
🚀 Buy @3280 - 3285
🚀 TP 3290 - 3295 - 3305
🚀 Sell @3320 - 3315
🚀 TP 3310 - 3305 - 3295
Accurate signals are updated every day 📈 If you encounter any problems during trading, these signals can serve as your reliable guide 🧭 Feel free to refer to them! I sincerely hope they'll be of great help to you 🌟 👇

Gold price drops to 3250Today's daily line is in the negative, rebounding in the morning, and the high point yesterday morning was 3310, and the bearish point is also at this point. It is higher than the 382 line of yesterday's decline and rebound, 3307. After the morning rebound, the current decline formed a morning downward trend. The watershed is 3308-10, today's short stop loss position. The market fell in the morning, and the strength of the rebound should not be strong. The top and bottom conversion position is 3297-98. The European session broke the bottom, and the US session continued to fall. The next double bottom support is around 3275. If the rebound is in place, it is still bearish, and the decline continues. 3258-60 line.

Big day for xauusd (gold)today fed (fomc ) will change the game , so i provide the level on chart. please check that levels . chart say #xauusd touch the level 3264 on negative news that level for buy and positive news for #gold 3296 and 3307 level and next t day 3328 and 3343 . so all thing on fed sir. and i am going for buy . thanks

gold on buy retrace#XAUUSD buy on 2 times breakout above 3300. The bullish needs formation there to start buying.
Buy limit 3300 on 2 times breakout, target 3316-3328, stop loss 3290.
Below 3287 holds bearish continuation if the m30-H1 closes below there target 3267.

GOLD Intraday H2 Chart update for 9 July 2025Hello Traders
as you can see that we have strong resistance on 3310 level only break above that level will consider bullish move
Below 3300 Psychological level market remains Bearish and move towards 3245 level
FOMC Meeting minutes dues today
Disclaimer: Forex is Risky
XAUUSD 15Min – Bullish Reaction from Demand Zone | SMC AnalysisSmart Money Concept (SMC) Analysis
Price has tapped into a clearly defined 4H Demand Zone (highlighted in green) with multiple rejections. Prior liquidity was swept below the 3288 region, trapping early sellers and grabbing institutional interest. This is a classic liquidity grab + demand zone confluence.
🔹 Entry: 3290 – Inside Demand Zone
🔹 SL: 3282 – Below Liquidity Sweep
🔹 TP: 3320 – Targeting Last Broken Structure (Break of Structure)
🧠 Smart Money Clues:
Liquidity grab under the lows ✅
Clean rejection wick ✅
BOS (Break of Structure) above needed for confirmation
Anticipating move back to 3320.57 (blue line) – previous SMC mitigation level
🟢 If price breaks above 3300 with strong volume, more upside is likely.
#XAUUSD #GoldAnalysis #SmartMoney #SMC #DemandZone #LiquidityGrab #TradingView #ForexSignals

Focus on the Fed meeting minutesFrom a technical perspective, the trend of gold is obviously weak. In the morning trading yesterday, the price of gold failed to continue the previous day's rise, and the rebound high kept moving down. After breaking the key support level during the US trading session, it accelerated downward, and the daily line closed with a big negative line, and the short-selling force had the upper hand. Today's closing situation is crucial. If it continues to close with a negative line, the short-term downward trend may be established. The minutes of the Federal Reserve meeting will also bring new variables to the gold market. The policy direction may further affect the trend of gold prices. At present, the upper resistance is 3303-3308, and the lower support is 3284-3278. It is recommended to do more on the callback.
Operation strategy: It is recommended to do more on the callback of 3280-3275, with a target of 3295-3307 and a stop loss of 3370.

Gold (XAU/USD) Technical Analysis : Structural Analysis + TargetGold is currently trading near $3,292 on the 30-minute timeframe, showing classic signs of accumulation and compression within a well-respected descending channel. The current price action is approaching a critical decision zone, and the market is offering potential clues for both short-term and swing traders.
🔎 Detailed Breakdown of Chart Elements:
🔷 1. Descending Channel & Dynamic Support
Gold has been moving inside a falling channel, with price repeatedly reacting to both the upper and lower boundaries.
The lower boundary of the channel, currently acting as support, has been tested multiple times, suggesting a strong buying interest at this level.
This channel also aligns with the broader downtrend structure, giving sellers confidence while also creating interest for counter-trend buyers looking for reversal setups.
📐 2. Trendline Pressure and Compression
A downward sloping trendline, drawn from the recent swing highs, continues to apply bearish pressure.
Price is squeezing between the channel support and this descending trendline — a tight range compression, which often precedes a volatile breakout.
The analysis notes: “We have to wait for a trendline breakout” – this is a crucial technical signal that will determine the next move.
🚧 3. Break of Structure (BOS) Zones
Two potential bullish BOS (Break of Structure) levels have been identified:
Minor BOS (~$3,300):
A break above this level may signal short-term bullish intent and invalidate minor lower highs.
Early confirmation for buyers to enter with tight risk management.
Major BOS (~$3,310):
This is the key swing high which, if broken, would invalidate the current bearish structure and flip market sentiment bullish.
A strong bullish candle closing above this level could signal the start of a larger upward leg.
📍 4. Next Reversal Zone (Supply Area: $3,320 – $3,330)
This zone represents a strong supply area where previous price action saw heavy selling.
If bulls manage to clear the BOS zones, this area becomes the next target/resistance.
Price reaching this level could lead to a pullback, making it an ideal area for partial take-profits or reassessment of continuation trades.
📈 5. Scenario Planning & Strategy
✅ Bullish Bias (If Breakout Occurs):
Wait for a confirmed breakout above the trendline and Minor BOS with volume.
Ideal long entry would be on the retest of the trendline (now acting as support).
First target: Major BOS, then extend to the Reversal Zone.
Stop-loss can be placed below the channel support or latest swing low.
🚫 Bearish Continuation (If No Breakout):
If price fails to break above the trendline and continues to reject at resistance, sellers may look to short the retest of the trendline.
Targets can be set at the channel's lower boundary or previous lows.
Confirmation: Bearish engulfing patterns, rejection wicks, or divergence.
🧠 Technical Summary & Outlook
Gold is currently in a neutral to slightly bullish consolidation, showing early signs of demand at the bottom of the channel. The market is in "wait-and-watch" mode — traders should focus on the trendline breakout, which will serve as the trigger for directional bias.
The structure is clean, zones are well defined, and potential is high for both scalping and intraday setups. Traders are advised to stay patient and follow price action confirmation before entering trades.
📌 Key Levels to Watch:
Support Zone: $3,280 – $3,285 (Channel Base)
Trendline Resistance: ~$3,294–$3,296
Minor BOS: ~$3,300
Major BOS: ~$3,310
Reversal Zone (Supply): $3,320 – $3,330

Gold Recovery Trade As gold moved around 500 pips on last day. The pull back seems good and this trade's possibility will be good and a good Risk Reward ratio. Keep your risk small if you want to take the trade. This isn't an investment advice this is a probability analysis. Which according to market structure seems good.

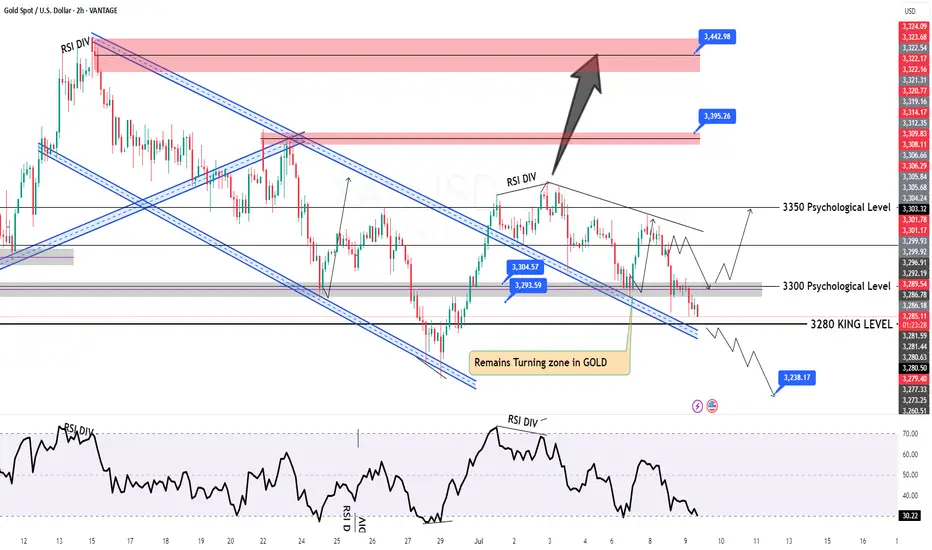
7/9: Failure to Break Above 3321 May Lead to a Drop Toward 3220Good morning, everyone!
Yesterday, gold tested support and attempted a rebound but failed to break through resistance, followed by a second leg down that broke the support zone, invalidating the potential inverse head-and-shoulders pattern and resulting in a drop below the 3300 level.
On the daily (1D) chart, price has now broken below the MA60, signaling a further confirmation of the bearish structure.
However, due to the sharp drop, a double bottom or multi-bottom structure is forming on the 30-minute chart, which may be building momentum for a potential test of the 3321 resistance zone.
📌 Key focus areas:
If 3321 is broken and held, there is room for a short-term rebound to extend;
If 3321 holds as resistance, the current rebound is likely a short-selling opportunity.
Technically speaking, without the support of bullish news, if gold fails to reclaim and sustain above 3321, there is a strong chance of a further move lower—potentially down to 3220, where the weekly MA20 is located. A deeper decline could even test the 3200–3168 support zone.
📉 Therefore, the primary trading bias remains bearish, with sell-on-rebound as the preferred strategy until a stronger bullish signal emerges. Monitor the 3321 zone closely for direction confirmation.
