Gold falls below 3300, will it rebound or continue to fall?Gold opened lower in the morning today and then rebounded and fell again. This kind of jump market fluctuates quickly but is mostly short-term. I usually remind you to avoid chasing orders to prevent being washed. Gold rebounded weakly and failed to touch 3320 and began to fall continuously. This weak signal alerted me - it failed to rebound strongly after the gap and instead remained at a low level, suggesting that the downward momentum was very strong and fully released, and there was a risk of further weakening. In the afternoon, the gold price was still hovering around 3312-3307, confirming its weak pattern. Combined with the repeated pressure on the key support 3300, I judged that the trend has clearly turned to short.
Gold recommendation: short in the 3312-3315 range, stop loss 3320, target 3280
Xauusdlong

Gold shock pattern breaksGold prices rose rapidly at the opening of the morning, reaching a high of 3342 before falling back. This early morning sharp pull-up market needs special attention, because from the perspective of short-term trading, this is the trend pattern that needs the most vigilance. Looking back at the trend of last Thursday, there was also a situation where the early morning surge could not continue. Historical data shows that this kind of morning pull-up often lacks sustained momentum and has limited room for subsequent increases. Combined with the recent trend, although the price rebounded on Monday and Tuesday, it basically maintained a volatile pattern in the following trading days, but the fluctuation range changed. After repeated struggles in the 3345-3322 range on Friday, the gold price rose again in this trading day and fell below the key support level of 3322. This important change means: 1. The original 3322-3345 oscillation range has been broken; 2. After the range moves down, 3322 changes from a support level to a resistance level; 3. The short-term trend weakens, and it is recommended to adopt a high-sell strategy. It is recommended to short at highs near 3322, and focus on the 3295-3293 support area below.

Trade Breakdown: XAUUSD 15-Min | Liquidity Grab + Reversal PlayOANDA:XAUUSD
Psychological Setup
This trade is rooted in the psychology of smart money and retail behavior. After a sharp drop in price, most retail traders expect continuation (trend-following). However, institutions often manipulate liquidity zones — hunting for stop-losses before a true reversal. This trade capitalizes on that behavior.
🔍 Technical Explanation:
🔻 1. Market Structure:
Price was previously in a downtrend, forming lower highs and lower lows.
A falling wedge pattern (red lines) formed after a strong bearish move, signaling potential bullish reversal.
Price broke the wedge to the upside — a classic reversal signal.
🔁 2. Liquidity Concept:
Below the wedge: The market grabbed liquidity by taking out stop losses of buyers who entered too early.
Above the wedge (TP Areas):
TP 1 Area (red box): This is the first logical resistance where previous supply sits — many sellers will enter here, providing buy-side liquidity.
Next Target Liquidity (grey box above): This is a major imbalance zone and likely where stop-losses of early short sellers are stacked.
Price is expected to grab liquidity from that area (marked by the red arrow).
✅ Entry & Trade Logic:
Entry Zone: After liquidity was swept at the bottom of the wedge, a bullish engulfing candle formed near demand — signaling institutional interest.
Risk-Reward Setup:
Targeting 0.80% move (approx. 26.48 points).
Trade is based on reversal from demand zone + wedge breakout + liquidity grab confirmation.
🎯 Target Projections:
TP1 Area: Conservative target, just above recent structure.
Final Target: High-probability liquidity zone where market is drawn to clean up resting orders (grey zone).
🧠 Why This Trade Matters (Trading Psychology Insight):
Most retail traders get trapped in emotional entries — entering shorts after a drop or longs too early in a wedge.
Smart money waits for liquidity sweeps before moving price in the desired direction.
This setup shows the importance of patience, structure, and understanding market psychology rather than reacting emotionally to price action.
📌 Key Takeaways:
📉 Trap: Falling wedge builds false bearish confidence.
🧠 Psychology: Stop hunts create fuel for reversal.
📈 Reaction: Smart money absorbs liquidity, moves price toward next inefficiency.
Hashtags:
#XAUUSD #SmartMoney #LiquidityHunt #TradingPsychology #GoldTrade #PriceAction #WedgeBreakout #FXOpen #TechnicalAnalysis #SupplyDemand

On Swing Traders’ Radar: Gold Pattern Alert on the Daily Chart!Dear Traders,
In my daily gold analysis, I’m observing a Head and Shoulders pattern nearing completion. The neckline is currently positioned around the 3,247.00 level.
If this neckline breaks to the downside, gold could potentially drop toward the 3,150.00 area.
Since this is a one-day analysis—aligned with a swing trading style—it may take some time for the setup to fully play out.
I meticulously prepare these analyses for you, and I sincerely appreciate your support through likes. Every like from you is my biggest motivation to continue sharing my analyses.
I’m truly grateful for each of you—love to all my followers💙💙💙

Where will the price of gold go under such strong pressure?From the 4-hour analysis, the support line of 3295-3301 is concerned below, the short-term resistance above is concerned about 3316, and the suppression line of 3345-50 is focused on. The overall main tone of high-altitude low-multiple cycle participation remains unchanged. In the middle position, watch more and do less, and follow orders cautiously, and maintain the main tone of participation in the trend. Wait patiently for key points to participate.

Gold new ATH soon?🟡 GOLD LONG SETUP: Buying the Fear at Key Support 📈
ICMARKETS:XAUUSD
"Be fearful when others are greedy, and greedy when others are fearful" - Warren Buffett
The oscillator we developed is showing some compelling signals on gold right now, and the market sentiment couldn't be more perfect for a contrarian play. 💎
Technical Analysis:
Our custom oscillator is painting a clear picture at the bottom - we're seeing those beautiful green zones emerging after extended red periods
Price action has found solid support around the 3,300 level, creating a strong foundation for the next leg up
The fear in the market is palpable, which historically has been an excellent buying opportunity for precious metals
Volume profile suggests accumulation is happening at these levels
Why This Setup Works: 🎯
The beauty of this oscillator lies in its ability to identify when institutional money starts flowing back into gold during periods of maximum pessimism. When retail traders are panicking and selling, smart money is quietly accumulating.
Key levels to watch:
• Support: 3,300 (current zone)
• First target: 3,350
• Extended target: 3,400+
Risk Management: ⚠️
• Stop loss below 3,275
• Position sizing: Never risk more than 2% of account
• Trail stops as momentum builds
The oscillator's fear signals have been remarkably accurate in identifying these reversal points. When fear reaches extremes, that's typically when the best opportunities present themselves.
This is not financial advice - always do your own research and manage risk appropriately.
What are your thoughts on this setup? Are you seeing similar signals on your charts? 🤔
#Gold #XAUUSD #TechnicalAnalysis #BuyTheFear #Oscillator

GOLD swing longPlacing bids for potential 1-2 setup to the upside, grey box is ideal target for this setup to trigger however scaling in on spot won't hurt

Monday Outlook on Gold (XAU/USD)My outlook for Monday is bearish at the start of the session, with price likely to drop toward the 3310–3300 area. This level aligns with a key discount zone inside the Gann box, and also overlaps with a 4H Fair Value Gap (FVG), making it a strong area of interest for potential long setups.
From that zone, I expect a bullish reaction, leading to a move back up to the trendline.
If the momentum continues, I anticipate a break of the trendline, followed by a retest, and then the beginning of a bullish trend.
I’ll be looking for confirmations around 3300 to position for the move higher.
Let’s see how Monday opens.

XAUUSD Weekly Chart Buying area📊 XAU/USD (Gold) Price Analysis – 4H Chart
🕒 Date: July 6, 2025
🔍 Technical Overview:
Gold is currently trading around the $3,337 level, showing signs of consolidation after a recent bounce.
🔸 Key Zones:
🟡 Resistance Area 1: $3,295 - $3,310
🟡 Resistance Area 2: $3,250 - $3,270
🟡 Target Zone: $3,390 - $3,410
📈 Possible Scenarios:
Price may retrace to the $3,295 - $3,310 resistance area, hold support, and aim for the $3,390 - $3,410 target zone.
A deeper pullback to the lower $3,250 - $3,270 resistance turned support area may occur before a stronger bullish move.
Breakout confirmation will come on a clean close above the $3,337 level with volume.
📌 Bias: Bullish above the $3,295 level
📌 Watch for: Bullish price action or liquidity grabs near support zones
💡 This setup is based on structure, liquidity zones, and institutional footprints.

Gold lacks downside momentum: Next week's analysis & adviceGold trading is relatively light today due to the U.S. Independence Day holiday. On the downside, we continue to focus on the short-term support at the 3325 level, while the key resistance above remains in the 3345-3350 range, which was yesterday's breakdown point. The market has closed early today, and price action has been stuck in a range-bound consolidation.
After plunging $40 on the back of bearish non-farm payroll data, gold stabilized and rebounded, recouping nearly half of the losses. This performance confirms that the downside space is limited. Currently, the market has returned to a oscillating upward pattern, and the weekly chart is likely to continue range-bound fluctuations. From a technical perspective, the 3325 level has formed a key support. The secondary retest overnight confirmed the bottom structure, and the gradual lifting of early session lows has also released a bullish signal. Looking ahead to next week, gold is expected to continue its bullish trend. If the 3325 support level below remains unbroken, one can look for opportunities to establish long positions.
XAUUSD
buy@3325-3330
tp:3340-3360-3380
Investment itself is not the source of risk; it is only when investment behavior escapes rational control that risks lie in wait. In the trading process, always bear in mind that restraining impulsiveness is the primary criterion for success. I share trading signals daily, and all signals have been accurate without error for a full month. Regardless of your past profits or losses, with my assistance, you have the hope to achieve a breakthrough in your investment.
XAUUSD (Upcoming Plan with 2 Scenarios) Analysis for the upcoming week (InShaaAllah) (2 Scenarios)
Breaking: Trump says tariff letters to 12 countries signed, going out Monday...
GOLD Massive Bullish Breakout!
HI,Traders !
#GOLD is trading in a strong
Uptrend and the price just
Made a massive bullish
Breakout of the falling
Resistance line and the
Breakout is confirmed
So after a potential pullback
We will be expecting a
Further bullish continuation !
Comment and subscribe to help us grow !

Gold - The final resistance breakout!Gold - TVC:GOLD - prepares a final rally:
(click chart above to see the in depth analysis👆🏻)
Over the past 12 months, Gold rallied more than +70%. However the past three months clearly rejected a major horizontal resistance. But price action on the smaller timeframe remains incredibly bullish. Therefore an all time high breakout will most likely follow.
Levels to watch: $3.500
Keep your long term vision!
Philip (BasicTrading)

June Nonfarm Data: Gold PlungesThe US June nonfarm payrolls data is out: 147,000 jobs were added, exceeding the expected 106,000 and the previous 139,000, with slight upward revisions to the prior two months’ figures. The unemployment rate dipped from 4.2% to 4.1%, beating the forecast of 4.3%. While the US economy slows, the job market remains robust. 🌟
Post-data release, market bets on a July rate cut have evaporated, with the probability of a September cut dropping to around 75%. US stock futures extended gains, Treasury yields rose across the board, the US Dollar Index surged, and gold plunged nearly $40 in a short squeeze—signaling an unexpected major bearish hit to gold. Weng Fuhao advises trading with the trend, focusing on shorting on rebounds. 😲
Gold, jolted by the nonfarm data, slid sharply in the short term before a minor rebound, with bearish signals across all timeframes. The data triggered an immediate breakdown, shifting the short-term trend to downward: on the 3-hour chart, moving averages formed a death cross, MACD showed a death cross with expanding volume, and gold prices fell below the Bollinger Band lower track, confirming a clear bearish momentum. 📉
🚀 Sell@3355 - 3345
🚀 TP 3335 - 3325 - 3315
Accurate signals are updated every day 📈 If you encounter any problems during trading, these signals can serve as your reliable guide 🧭 Feel free to refer to them! I sincerely hope they'll be of great help to you 🌟 👇

Gold lacks downward momentum.Today, gold is relatively quiet due to the impact of the US Independence Day holiday. Below, we continue to pay attention to the short-term quality layer of 3324. The key pressure above is maintained at yesterday's opening point of 3345-50. At midnight, gold rebounds near 3345-50 and can be shorted. The target is around 3330-33. It closes early at midnight and maintains a range of fluctuations! If your current gold operation is not ideal, I hope I can help you avoid detours in your investment. Welcome to communicate!
From the 4-hour analysis, pay attention to the support of 3324-30 below, focus on the support position of 3316, and pay attention to the short-term resistance of 3345-50 above. At midnight, the overall high-altitude low-multiple cycle participation remains unchanged. In the middle position, watch more and move less, be cautious in chasing orders, and wait patiently for key points to participate.
Go short before breaking 3350, go long before falling to 3320📰 News information:
1. Geopolitical situation
2. Tariff implementation and interest rate cut bill
📈 Technical Analysis:
As I said, the US stock market closed early today, and the market will lack some momentum. It is difficult to have a large fluctuation. It is expected to fluctuate and consolidate. I also explained in the previous post that the upper pressure in the short term is at 3340-3350. If it is touched, we can try to short and defend 3360. If it falls back to 3323, we can try to go long for the first time. If it continues to fall, it is expected to reach 3315-3305. Therefore, if it first touches 3323, go long, SL 3316, and consider going long if it touches 15-05 below.
🎯 Trading Points:
SELL 3340-33350
TP 3330-3320-3310-3300
BUY 3323
TP 3333-3340-3350
BUY 3315-3305
TP 3325-3333-3340
In addition to investment, life also includes poetry, distant places, and Allen. Facing the market is actually facing yourself, correcting your shortcomings, confronting your mistakes, and strictly disciplining yourself. I hope my analysis can help you🌐.
TVC:GOLD OANDA:XAUUSD FX:XAUUSD FOREXCOM:XAUUSD PEPPERSTONE:XAUUSD FXOPEN:XAUUSD

Gold suffered a heavy blow from non-farm payrolls! Yesterday's decline in gold prices was mainly affected by news, and such declines usually do not last too long. From a technical point of view, gold prices received support near 3322 at night, which is the key support level today. It is worth noting that on Wednesday, gold prices were under pressure in the 3340-3344 area, while on Thursday, prices formed support in this range, indicating that the area is forming a top-bottom conversion, so 3340-3345 has become an important pressure level today. It is expected to fluctuate and consolidate in the 3322-3340/45 range during the day. The impact of news on gold prices is usually short-term. When the fundamentals and technical directions are consistent, price fluctuations will be more obvious; when the two are inconsistent, price fluctuations will weaken, but will not change the technical trend. The rebound pattern established at the beginning of the week is still valid. After a short-term shock, gold prices are expected to re-stand above 3345 and continue to maintain the rebound trend.

Tariff tensions heat up againGold, the price rebounded quickly after the parallel attack and defense at 3245 at the beginning of the week. The article emphasizes that the short-term strength will continue. The high point of the week may appear around Thursday's non-agricultural data. The medium-term top idea of 3500-3452 is still maintained; on Tuesday, it actually hit 3358, and the daily K-line combination showed a long arrangement. In the morning, it was emphasized that it was still possible to follow the trend and wait for the non-agricultural data to break through on Thursday night;
The actual retracement rebounded from 3327 and is now reported at 3343, which is in line with expectations; the short-term support in the evening is 3340-3336, and the strong support is 3330; the short-term resistance is 3348, and the strong resistance is 3352-3358. If it breaks, it will look at 3365-3400;

U.S. stocks are closed, how to operate gold volatility📰 News information:
1. Geopolitical situation
2. Tariff implementation and interest rate cut bill
📈 Technical Analysis:
Gold has maintained a volatile pattern recently, lacking a sustained unilateral trend. The unclear short-term direction of DXY has limited the volatility of gold. The market has repeatedly shown a mixture of high-rise decline and downward recovery. It is unable to effectively break through the previous high and lacks the momentum to break downward. The short-term pressure during the day is concentrated on the 3340-3345 line, and the upper middle track is at 3350. If it fails to effectively break above 3350, then gold may fall further. On the contrary, if it can stand above the middle track 33350, then gold may rise further. The short-term support below is near the 3323 line. If it fluctuates during the day, maintain a high-altitude low-multiple cycle.
🎯 Trading Points:
SELL 3340-3350
TP 3330-3320-3310
BUY 3320-3310
TP 3340-3350
In addition to investment, life also includes poetry, distant places, and Allen. Facing the market is actually facing yourself, correcting your shortcomings, confronting your mistakes, and strictly disciplining yourself. I hope my analysis can help you🌐.
FXOPEN:XAUUSD PEPPERSTONE:XAUUSD FOREXCOM:XAUUSD FX:XAUUSD OANDA:XAUUSD TVC:GOLD

Gold accumulates and moves above 3350⭐️GOLDEN INFORMATION:
Gold prices declined by 0.80% on Thursday after a robust US Nonfarm Payrolls (NFP) report boosted the US Dollar, dampening expectations for a Federal Reserve rate cut at the upcoming July meeting. At the time of writing, XAU/USD is trading at $3,332, after reaching an intraday high of $3,365.
June’s employment data significantly outperformed forecasts and even surpassed May’s figures, reinforcing the resilience of the US labor market. Notably, the Unemployment Rate edged closer to the 4% mark, underscoring continued labor market strength. The upbeat report casts doubt on Wednesday’s softer ADP private-sector jobs data, which had shown a 33,000 drop in hiring.
⭐️Personal comments NOVA:
Gold price accumulates and recovers around 3350. Friday has no important news and bank holiday in US session, short-term recovery
⭐️SET UP GOLD PRICE:
🔥SELL GOLD zone: 3365- 3367 SL 3372
TP1: $3355
TP2: $3342
TP3: $3330
🔥BUY GOLD zone: $3311-$3313 SL $3306
TP1: $3325
TP2: $3338
TP3: $3350
⭐️Technical analysis:
Based on technical indicators EMA 34, EMA89 and support resistance areas to set up a reasonable BUY order.
⭐️NOTE:
Note: Nova wishes traders to manage their capital well
- take the number of lots that match your capital
- Takeprofit equal to 4-6% of capital account
- Stoplose equal to 2-3% of capital account

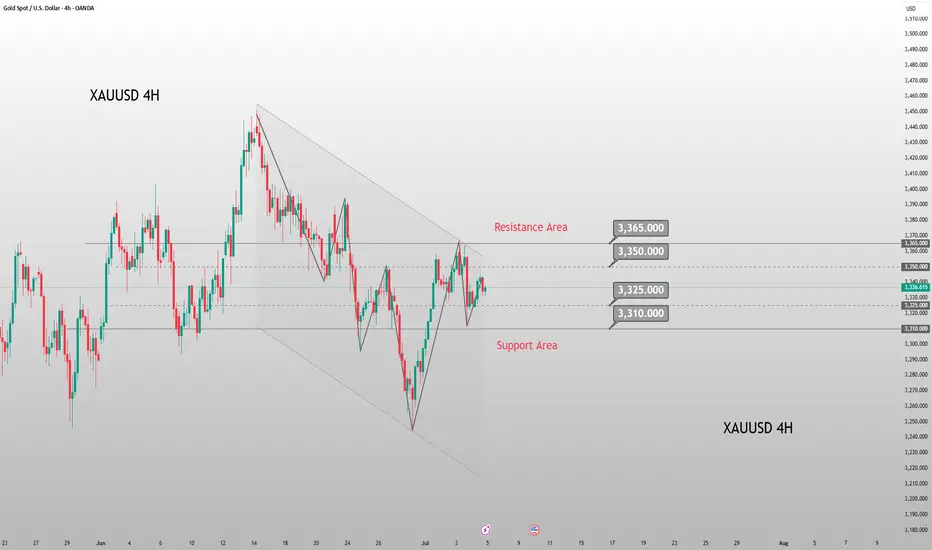
XAUUSD Consolidates Below Resistance – A Breakout Imminent?On the 4-hour timeframe (H4), XAUUSD is clearly consolidating just below the key resistance zone near $3,366, forming higher lows and lower highs within a tightening range highlighted by the shaded area.
1. Key Price Action Highlights
Price has been forming higher lows, suggesting growing bullish momentum.
The $3,366 resistance remains intact – a breakout above this level could confirm bullish continuation.
A visible double bottom (W pattern) formed around June 28 hints at a strong technical rebound after a correction phase.
2. Important Support and Resistance Levels
Price Level
Significance
$3,366 – $3,380
Major resistance zone – likely breakout target
$3,300
Key near-term support where price recently bounced
$3,242
Deeper support – a breakdown here could confirm bearish reversal
3. Suggested Trading Strategy
Buy on breakout above $3,366 with strong volume and clear confirmation (e.g., a large-bodied candle closing above resistance).
Consider buying on a pullback to the $3,320 – $3,300 zone for better risk-reward.
Stay cautious if price breaks below $3,300 – this could signal a bearish shift in momentum.
Gold is currently in a tight consolidation phase under major resistance, with bullish structure still intact. A breakout above $3,366 could trigger a sharp move upward. Until then, traders should monitor the lower boundaries for potential pullbacks or invalidation signals.

GOLD H2 Intraday Chart Update For 4 July 2025As you can see that GOLD is still in consolidation range above 3300 Psychological Level
Currently prices are still standing @ 3340 nearby Psychological Level, only if market breaks 3368 clearly then it will consider Bullish other below 3368 market still in Bearish Move
Reminder: Today is US Bank Holiday
Disclaimer: Forex is Risky

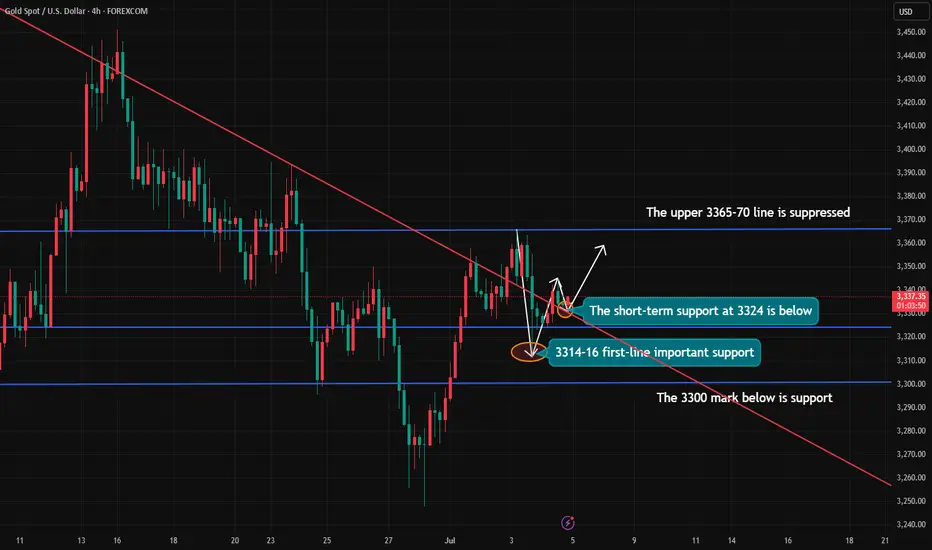
Gold/USD Bullish Breakout Toward Target Zone Gold/USD Bullish Breakout Analysis 🚀🟢
The chart illustrates a strong bullish breakout from a consolidation zone, signaling upward momentum:
🔍 Key Technical Observations:
Support Zone: The price respected the support area around 3,325 – 3,330 USD, forming a solid base for reversal.
Bullish Structure: Series of higher lows and higher highs indicate a bullish trend formation.
Breakout Confirmation: Price broke above short-term resistance with a strong bullish candle, indicating buying pressure.
Trendline Support: The ascending trendline has held well, confirming trend continuation.
Target Point 🎯: Projected target is near 3,365 USD, which aligns with a previous resistance and Fibonacci confluence zone.
✅ Conclusion:
The breakout above resistance, supported by a bullish structure and momentum, suggests further upside potential toward the 3,365 USD target zone. As long as price holds above the breakout level, bullish bias remains valid.
🛑 Watch for invalidation if price falls back
