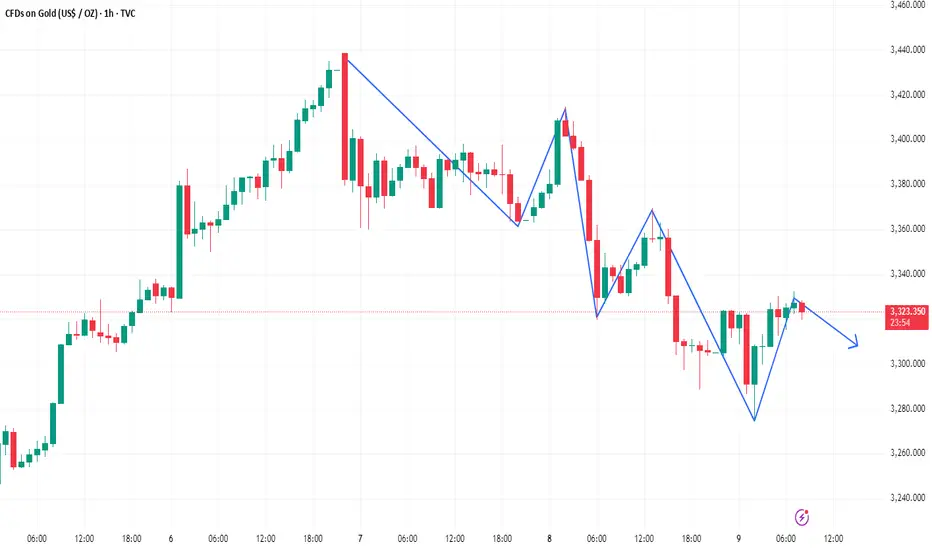
XAUUSD analysis - 1H FVG and OB setupsOn the 1H timeframe, price is reacting as it approaches the HTF high zone (3430-3450) and is currently pulling back.
The 1H FVG zones at:
🔹 3400
🔹 3368
and the 1H OB around 3350 are key areas we are watching for potential long entries.
📌 Plan:
We will wait for price to pull back into one of these 1H FVG/OB zones and look for entry confirmations on the 5M or 3M timeframe to go long.
🎯 Targets: 3430 – 3440 – 3450
❌ No sell setup for now unless a clear structure break happens.
Xauusdlongterm

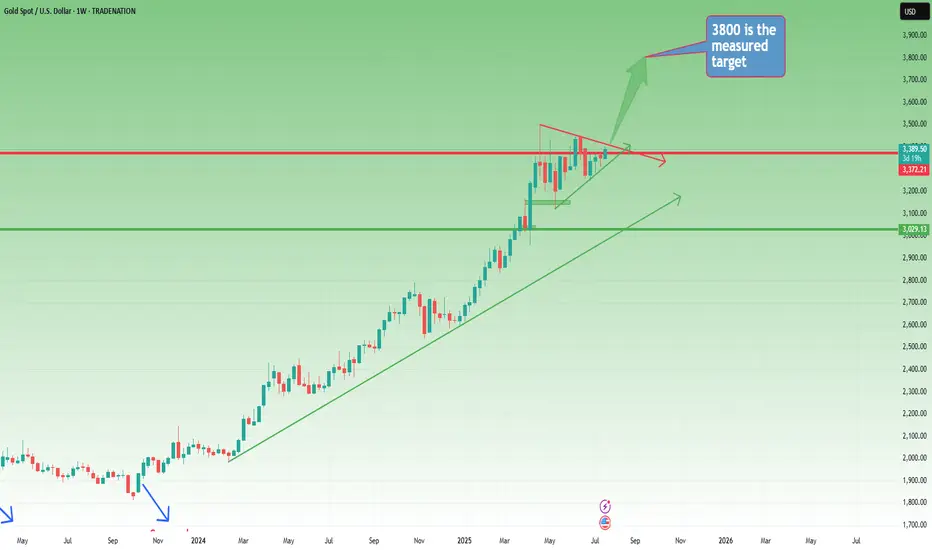
Weekly Outlook: Gold Builds Pressure – Is the Big Move Coming?📆 Big Picture View
Since the start of 2024, Gold has been moving in a well-defined long-term bullish trend.
Yes, there were meaningful pullbacks along the way — but the direction was never in doubt. Step by step, Gold climbed over 15,000 pips in just over a year, reaching a new all-time high in late April.
📉 Post-ATH: A Period of Stabilization
After peaking, Gold shifted into consolidation mode, with price gravitating around the 3300 zone.
This sideways movement has been ongoing for the past three months, but it’s not a sign of weakness — it’s the market catching its breath.
On the weekly chart, this consolidation is now forming a symmetrical triangle, a classic continuation pattern that often appears mid-trend.
📐 The Technical Setup
- The symmetrical triangle shows compression of volatility
- Buyers and sellers are slowly converging toward a decision point
- A breakout is approaching, and when it comes, it could be explosive
🎯 What’s the Trigger?
- A confirmed break above 3450 would validate the triangle breakout
- That opens the door to quickly test the 3500 round figure
- The measured target for the triangle sits at 3800
Given the time Gold has spent consolidating (3+ months), this target could realistically be reached by year’s end
🧭 Strategic Takeaway
- As long as Gold holds above 3300, the bullish structure remains valid
- Breakout above 3450 is the green light for the next leg up
- Until then, the consolidation continues, and smart money prepares
📌 Conclusion:
Gold is building pressure. The weekly triangle is maturing.
This isn’t the end — it’s the pause before the next move.
Stay patient. Stay focused.
Because if 3450 breaks… 3800 is not a dream — it’s a destination. 🚀
Disclosure: I am part of TradeNation's Influencer program and receive a monthly fee for using their TradingView charts in my analyses and educational articles.
P.S: Here you have a short term analysis on Gold
XAUUSD - POSSIBLE BIG LONG MIDTERM TRADESAXO:XAUUSD
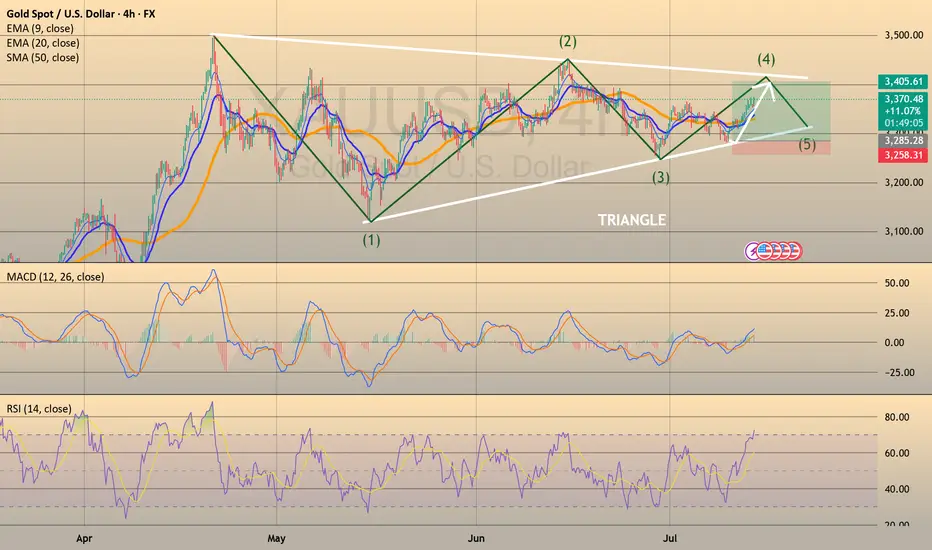
XAUUSD - POSSIBLE BIG LONG MIDTERM TRADE📈
XAUUSD has gone the half of my take profit, so I decided to close 1/2 of my position here and put my stop loss at an entry price. Still, we have good chance to go towards upper border of the triangle, just want to reduce the risk.
XAUUSD has been trading sideways and has formed a Triangle pattern since April 23d. Looks like the price found a balance between supply and demand. Currently the price is sitting on a lower border of a triangle and potentially is forming the Wave D, according to Elliot Triangle Wave formation.
Trade cautiously!
"The Great Gold Heist" – XAU/USD Master Plan🏆 "The Great Gold Heist" – XAU/USD Master Plan (High-Risk, High-Reward Loot!) 🚨💰
🌟 Attention, Market Robbers & Money Makers! 🌟
Hola! Oi! Bonjour! Hallo! Marhaba! 🤑💸
🔥 Based on the legendary Thief Trading Strategy (technical + fundamental heist tactics), here’s our blueprint to STEAL massive profits from the XAU/USD (Gold vs. Dollar) market! 🔥
🎯 The Heist Plan (Long Entry Setup)
Entry Point 📈: *"The vault is UNLOCKED! Swipe bullish loot at any price—but for a cleaner steal, set Buy Limits within 15-30M recent swing lows/highs. ALERT UP! ⏰"*
Stop Loss 🛑: "Thief’s SL hides at the nearest swing low (3H TF: 3250.00) OR below the last daily candle wick. Adjust based on your risk appetite & lot size!"
Target 🏴☠️: 3490.00 (or escape early if the cops—err, bears—show up!)
⚡ Scalper’s Quick Loot Guide:
"Only scalp LONG! Rich? Go all-in. Broke? Join the swing traders & rob slow ‘n’ steady. Use Trailing SL to lock profits!"
📊 Market Status:
XAU/USD (GOLD) – Neutral (But Bullish Sneak Attack Likely! 🐂💥)
"The heist is ON, but watch for traps—overbought zones, consolidation, and bearish robbers lurking!"
🔍 Pro Thief Moves:
✅ Fundamentals Matter! (COT Reports, Geopolitics, Macro Data, Sentiment—check our BIO0 for the full loot list!) 🔗👉🏻☝🏻
✅ News = Danger! Avoid new trades during releases. Trail your SLs to protect stolen cash! 📰🚨
💖 Support the Heist Crew!
"Hit the BOOST BUTTON 💥 to strengthen our robbery squad! More boosts = easier money steals daily!"
🚀 Stay tuned—another heist drops soon! 🐱👤💎

XAUUSD 1H | Harmonic AB=CD | Sentiment Reversal in PlayGold has formed a clean Harmonic AB=CD Pattern, with price currently sitting at the PRZ (Potential Reversal Zone). This aligns with technical expectations for a possible bullish shift.
🗓️ The recent sharp sell-off in Gold was heavily influenced by the ongoing Iran-Israel conflict, triggering fear, panic, and speculative selling. Despite Gold's fundamentally bullish bias as a safe-haven asset, market sentiment overpowered fundamentals in the short term.
🔍 On the 30min LTF, we have a crystal-clear Bullish Divergence on RSI, adding further confluence that downside momentum is weakening, and a corrective reversal may unfold from this area.
Bias:
✅ Harmonic AB=CD complete — PRZ active
✅ LTF Bullish Divergence (30m) confirmed
✅ Price action showing exhaustion at key support
✅ Expecting potential bullish reaction and relief rally
⚠️ As always, waiting for confirmation with proper risk management. Market remains sensitive to geopolitical headlines.
💡 DYOR — Do Your Own Research before executing trades.

XAUUSD: $3100 is the next target, Get Ready For the Big Move!Gold is currently making a small correction and looking at how the price is behaved. We are expecting how the price is likely to develop next. Use accurate risk management.

If the direction is unclear, don’t panic, respond flexibly!Gold has been showing a daily yin-yang alternating pattern since last Wednesday, but the overall rising rhythm has not been broken. The MA5-day moving average and the MA10-day moving average formed a golden cross and continued to extend upward. The arrangement of this moving average system provides a certain support momentum for the gold price. During the day, we need to focus on the support effect of the moving average. The current 5-day moving average is near 3340, and the 10-day moving average is near 3325. These two positions constitute an important support area for the short-term gold price correction. In terms of upper resistance, first pay attention to yesterday's high of 3392. If the gold price can break through this resistance level, it means that the upward momentum is strong, and it is expected to continue to be strong to 3400-3420, further opening up the upward space.
From the 4-hour chart, as long as the short-term gold market is above 3330, then gold is still in a strong bullish trend. On the contrary, if it falls below the closing line near 3330, then it is a broken trend line, and the subsequent market is likely to form a weak shock pattern again, so the current operation is actually very simple. As long as the 3330 position is not broken, you can rely on 3330 to enter the market and do more. Focus on the support near yesterday's low of 3333 below, and focus on the resistance near 3375-3380 above.
Gold operation suggestions: It is recommended to short gold near 3365-3375, with a target of 3350. Go long gold when it falls back to 3335-3345, with a target of 3360-3370.

Gold Strategy Update — Professional Trading InsightGold dipped to around 3290, then rebounded to 3310, followed by another pullback toward the 3290–3280 region and bounced again. This price action perfectly aligned with our forecast and trading plan.
👉 If you followed today's strategy, you should be in solid profit once again!
📍 Current Market Structure Analysis:
🔹 Gold is now hovering near 3300, which is a key resistance zone.
Our previously identified support area at 3306–3318–3324 has been broken and is now acting as resistance.
🔹 Among these levels:
3306 is a weaker resistance,
While the 3316–3323 zone is the main barrier to watch.
📊 Based on the 30-minute chart, bullish momentum appears limited:
If the price rebounds in a single leg, it is likely capped around 3318–3324,
→ With an 80%+ probability of a pullback from that zone. A reasonable short-term target would be 3312;
However, if gold builds a double bottom or multiple bottom structure, it may gather more strength,
→ And a broader rebound could reach 3332–3338.
📉 Bearish Structure Repair (2H Chart):
On the 2-hour chart, the previous bearish structure has been mostly corrected by the recent drop;
The next key factor is whether bulls can break above 3320 to confirm a reversal.
🟥 If bulls fail to break 3320 and price drops below 3280, it may open the door for bears to close the gap around 3259.
→ In that case, levels below 3266 will present excellent buy opportunities.
📊 Trading Summary:
Although market volatility has slightly decreased in recent days, there are still plenty of solid trading opportunities, and we continue to profit steadily.
✅ As long as you stick to a proven strategy, strong discipline, and flexible execution, you’ll find that no matter how the market moves, our profit curve will keep climbing.

Short term is still dominated by short positions!Although the easing of trade tensions in the short term has led to a correction in gold prices, the three core factors supporting the strength of gold still exist: expectations of loose global monetary policy, rising geopolitical risks, and the long-term weakening trend of the US dollar. In particular, the market expectation that the Federal Reserve may maintain loose monetary policy will continue to provide momentum for gold to rise.
From the daily chart, the price of gold has shown a clear upward trend since this year. Although there have been several corrections in the middle, the bulls still control the medium and long-term market. After the previous rise in the H4 cycle, it is not so strong now. Instead, it is a volatile trend. The Bollinger band is closed, and the trend strength still needs market stimulation to rise again.
The 1-hour moving average of gold has begun to turn, so the rising strength of gold bulls has been suppressed. The high point of the 1-hour rebound of gold has been getting lower and lower, and the low point has also begun to fall. The 1-hour gold has begun to fluctuate downward. The downward trend of the gold rebound is suppressed near 3340. Gold rebounds near 3340 and can still be shorted.

XAUUSD:Go long at 3320-3325
Gold rebounded after stepping back near 3200 last week, picking up and rising under the influence of the news. Since 3200 stepping back formed support, coupled with the influence of long news, the day is mainly long.
The 4-hour chart shows the lower rail support at 3320-3325 and the upper rail pressure at 3360-65. You can trade around this range.
So the trading strategy: Buy@3320-3325 TP@3360-3365
↓↓↓ More detailed strategies and trading will be notified here →→→
↓↓↓ Keep updated, come to "get" →→→

GOLD outlook for the weekIn today’s analysis, I’m expecting price to continue its bullish momentum, partially influenced by recent political developments surrounding Donald Trump. This aligns well with the broader higher time frame trend, where we’ve been favouring long setups.
To capitalise, the most immediate and valid point of interest I’ve marked out is the 9H demand zone — the origin of the most recent break of structure. If price retraces, this is where I’ll be watching for bullish confirmation.
However, if price continues to climb without retracing first, we could see a temporary bearish reaction from the nearby 4H supply zone around the 3,400 level. If this happens, I may look for a short-term countertrend sell setup, but only with strong confirmation. Risk will be kept low and I won’t be overly ambitious with targets.
Confluences for GOLD Buys:
Strong bullish momentum following a clear CHoCH on the higher time frame
Recent break of structure left behind a clean 9H demand zone for potential retracement
Trend remains bullish on both the lower and higher time frames
Liquidity resting above still yet to be swept
DXY is currently bearish, supporting a bullish case for gold
P.S. While we could see a minor sell opportunity down to the demand zone, patience is key.
Waiting for a solid pre-trend setup is part of the process — no need to rush entries.
Have a great trading week and stay sharp!

Flexible strategies lead to the best response.📍News:
The continued escalation of the war in the Middle East has increased risk aversion in the gold market.
At the same time, the Russian-Ukrainian negotiations broke down, and Russia launched the largest attack since 2022. Under the double attack, the market's risk aversion is full.
📊Gold technical analysis:
Today's gold price showed a violent fluctuation pattern. During the Asian session, the gold price quickly broke through the 3345 regional resistance and then fell back quickly, indicating that the short-term top pressure was significant. Subsequently, the market fluctuated repeatedly in the 3345-3320 high range and the 3320-3280 low range. After testing the 3350 high point in the Asian session, it retreated sharply, releasing a staged peak signal, indicating that the previous increase has entered the correction and callback stage, but the overall trend is still dominated by wide fluctuations.
Market sentiment reversed, and the price slowly fell and then was pulled up by the positive line. The game between long and short positions was fierce. Although the short position once dominated, the long position counterattacked strongly, and it is expected that it may hit the resistance near 3320 again. The current market has not formed a unilateral trend. The operation is still to deal with the idea of shocks, and maintain the idea of high-altitude and low-multiple. The strong resistance above is at 3350, and the key support below is 3280-3275. The probability of breaking down in the short term is low.
🎯Operational suggestions: Go long on gold when it falls back to around 3280-3275, look at 3300 and 3320, and go short if the rebound pressure of 3320 is not broken.

Gold rebounds weakly, US market ideas for reference!
📌 Driving factors
As Sino-US trade tensions ease, market concerns about a global recession ease, investors' risk appetite rises, and gold's attractiveness as a safe-haven asset declines, gold prices fell on Wednesday (May 14). After the tariff truce announced over the weekend, the stock market rose sharply, weakening gold's safe-haven appeal in the short term, which was an important factor that pushed gold prices to new highs in the previous few months, and it is also the starting point for the current large-scale selling!
📊Commentary Analysis
After gold fell below 3200 in the US market, it rebounded to 3198 at its highest. This rebound was just an oversold rebound, and then continued to fall back. Although it has not refreshed the low for the time being, the pattern has weakened, and it is difficult to get up again in the early morning. Weak shorts can't even get past 3198, and the short-term support below is around 3160.
The daily cycle is constructed based on the M-head pattern. 3200 is the long defensive position. If it fails to close, there will be a fall. The technical side has already experienced a major break. Pay attention to the change of thinking. If the adjustment range is large, it may even reach 2900/3000. It rises fast and falls fast, but the long-term logic of gold's rise remains unchanged. It is also an opportunity to lay out more positions, but the position needs to follow the market observation, which is difficult to predict at present.
💰Strategy Package
In the short term, we will rely on 3198 for defensive short selling. After breaking 3200, please note that even if it rebounds, we should follow the trend and short. If it rebounds upward, we should short at the golden section resistance of 3265.
Good luck to everyone!
Labaron believes that
Guaranteeing the principal is the bottom line for survival, controlling risks is the armor for survival, earning income is a stage medal, and long-term stable and continuous profit is the only certificate to finally stand up from the sea of corpses and blood.

Gold crash alarm is sounding!
Technical aspects:The pressure area of gold is concentrated in the range of 3250-3260. If the market remains weak and under pressure, it will be difficult for gold prices to break through this area. The key support around 3210-3200 should be focused on for gold to go down. If the gold price falls below the support of 3200, it may trigger a waterfall-like decline, and the expected support bottom is in the area of 3100-3050.
In terms of operation, you can wait for the opportunity to rebound and come under pressure after the position is broken, and take advantage of the trend to place short orders. It is important to remember that 3200 is like a key line of defense. Once it falls, it will trigger a chain selling.

5/14 Gold Trading Signals🌇Good afternoon, everyone!
Yesterday, gold only entered the 3218–3252 flexible range , and did not touch the broader buy/sell zones, resulting in limited profits .
Currently, gold remains under resistance , and candlestick formations suggest an irregular double top . With ongoing sideways box-range movement , the market lacks a clear direction, so caution is advised .
📉 If bears take control, gold could drop toward 3169 .
📈 If bulls prevail , a rebound to 3300 is likely.
🔍 Key Technical Zones:
Bullish Resistance : 3246 – 3268
Support Area : 3218 – 3209
🗞 News Focus:
Speeches from Fed members Waller and Jefferson today may trigger directional momentum in the market.
📌 Trading Strategy for Today:
Sell Zone : 3301 – 3327
Buy Zone : 3170 – 3152
Flexible Trading Ranges :
▫️ 3210 – 3243
▫️ 3272 – 3259
▫️ 3247 – 3296
✅ Trade with discipline, manage position sizes carefully, and stay alert during key speeches.

Gold’s 3200 mark is the key!Due to the ceasefire between India and Pakistan and the easing of the Sino-US trade war, gold opened directly and fell below 3280 and 3260 successively, so the decline of gold will continue.
From the gold hourly chart, the focus below is on the 3200 integer mark. If it falls below 3200 and cannot effectively stabilize, then gold will have a big double top here, and the next decline will extend to around the 3000 integer mark. On the contrary, if the 3200 mark is not broken, then the bulls will fight back, at least they will fill the gap again
So in terms of operation, it is not recommended to chase the short now. If you want to go long on gold, you can wait for it to fall back to the 3200-3210 area and stabilize before buying

The golden earthquake storm is coming!In terms of news: Major events over the weekend include the conflict between Russia and Ukraine, the sudden change in the situation between India and Pakistan, and the progress of Sino-US negotiations: Although India and Pakistan announced a truce, India's surprise attack turned the agreement into a joke. The high-level economic and trade talks between China and the United States are still continuing in Geneva, and it is difficult to have clear results in the short term. The war between Russia and Ukraine is still in a stalemate. The superposition of multiple events has injected uncertainty into the market.
Technical aspects:
Pay attention to the pressure in the 3360-3380 area. If it stands firm at 3346, it can fall back to arrange long orders. If it directly breaks below 3300 at the opening, pay attention to the support near 3280 - this position is likely to be lost, and effective support depends on the downward pattern formed after the 3260 break, and the ultimate target is 3200.

Gold opening rise and fall prediction?The current gold market is in a range of fluctuations, maintaining a wide range of fluctuations. Technically, the key support level below is still focused on the 3270 area, while the 3450 price level above constitutes a significant double-top structural resistance level. Although the conclusion of the US-UK tariff agreement has a phased negative effect on precious metals at the geopolitical level and may provide a demonstration effect for other regional trade negotiations, the overall technical structure still maintains a downward trend. At the daily level, the recent K-line combination has completed a deep retracement from the 3500 mark with two long negative lines, directly breaking through an important support platform. The current daily K-line continues to close the adjustment pattern with an upper shadow line, and the alternating yin and yang oscillation rhythm conforms to the technical correction characteristics. It is worth noting that the 50-period moving average continues a clear downward trajectory, forming a resonance suppression with the double-top structure in the 3450 area.
The 1-hour gold chart shows that the short-term price trend presents a clear downward channel feature, and the seller's power continues to dominate the market. Combined with the Fibonacci extension level calculation, the first target below can still focus on the 3300 area. If this support platform is lost, the price will have a technical demand to further explore the 3320 integer mark. The current volume and price coordination shows that the market is brewing a new wave of trending market conditions. It is necessary to pay close attention to the breakthrough direction of the 3300-3380 range, which will determine the continuation or reversal of the medium-term trend. Taken together, the short-term operation of gold is recommended to be mainly longs on callbacks, supplemented by shorts on rebounds. The top short-term focus is on the first-line resistance of 3360-3380, and the bottom short-term focus is on the first-line support of 3320-3300.

Gold is still in a short-term bearish trendGold's 1-hour moving average continues to turn downward. If it crosses below to form a downward death cross, then gold's room for decline may further open up. The short-term short position of gold has not ended yet. Gold has a trend of falling again. The short-term trend of gold is still short.
Trading ideas: short gold near 3325, stop loss 3340, target 3290
After gold falls sharply, how should you trade in the short termAfter gold fell below 3400 today, it ushered in a big decline, falling directly below the key position of 3350. Since gold breaks down, let’s take advantage of the trend and go short
Since the bullish volume of gold market has been released, the bullish trend of gold needs to be repaired in the short term before it can rise further.
Trading idea: short gold near 3347, stop loss 3360, target 3327

Gold is under pressure at 3400, with a short-term decline expectGold is under pressure around 3400. Today we will have the Fed's interest rate decision and Powell's speech. If gold is under pressure at 3400, it is expected to fall. Before the data, we need to be cautious.
In terms of trading ideas, we can short short-term, pay attention to the short near 3393-96, stop loss 3403, take profit 3360/3350

Has the road to gold adjustment begun?Gold has reached a high of around 3404, so this position can be used as an important pressure point. In this continuous upward trend, once there is a sharp decline, it is likely to be a signal that the short-term bulls have peaked. Then we need to consider whether the bears can reverse, and the current upper pressure point is also the high point of the last wave of pullback near 3393, and the lower support is at 3360.
Trading idea: short near 3387, sl: 3400 tp: 3370

There are short-selling opportunities in gold in the short term!
After gold rebounded, there was strong pressure around 3315, so it was a short opportunity, sl: 3325, tp: 3290
