The gold correction continues!On the news:
Gold prices fell for a third day in a row as signs that trade talks between the United States and China may be progressing dampened demand for safe-haven assets. News that the Trump administration is about to announce the first batch of agreements, which will reduce planned tariffs on some countries, also eased concerns about the outlook for global trade.
Technical aspects:
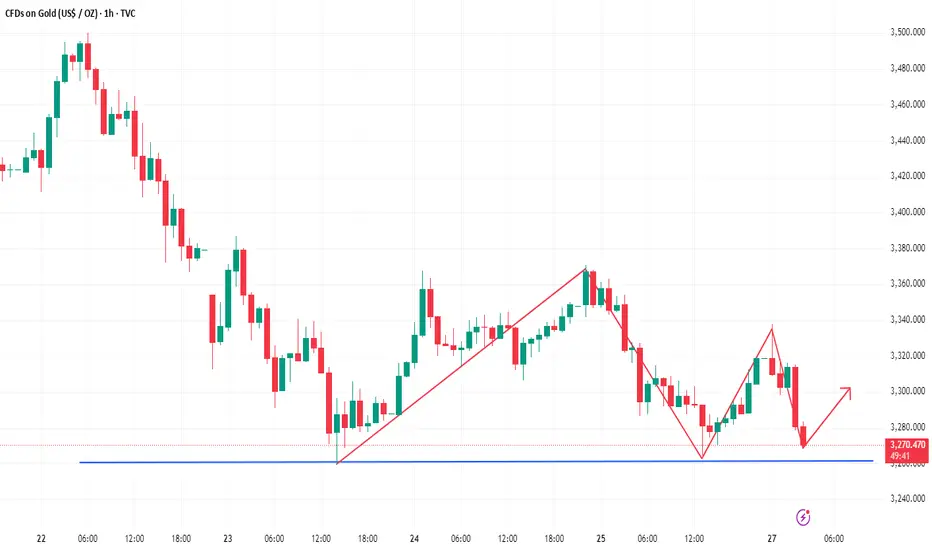
After the current gold market broke down, it started to fall from around 3270, which is also the key position for us to continue to bet on the market falling. At present, the short position of gold is more advantageous. Then in the short term, gold will focus on the support near 3233. If it falls below, then gold will reach the 3200 mark.
Xauusdlongterm

Gold continues to fluctuate widely, mainly long at low levelsAs gold broke below the 3300 mark in the European session, the market once again tested the 3270 first-line support, which is the edge of the lower track of the channel.
rading idea: Go long gold near 3270, with a strict stop loss of 3267 and a target of 3300

Key intervals and trend judgmentKey range and trend judgment:
The current gold price is in a narrow range of 3300-3305 support zone and 3325-3330 pressure zone. Technical analysis:
1. Support logic:
- 3300 is an integer psychological barrier, which coincides with the MA60 moving average (dynamic support) of the 1-hour chart;
- After hitting the bottom of 3300 several times recently, it rebounded and formed a short-term bottom structure.
2. Pressure logic:
- 3330 is the upper rail resistance of the Bollinger band on the 4-hour chart, and it is the previous high-intensive trading area;
- The top divergence signal appears at the MACD daily level, suppressing the upward space.
3. Volume characteristics: Shrinking volume oscillation, need to wait for breakthrough and large volume to confirm the direction.
Trading strategy and operation plan
1. Buy low and sell high within the range (short-term)
Long position strategy:
Entry point: 3300-3305 range (price retracement does not break, and 1-hour chart RSI <30), try long with a light position. Take profit target: 3315 (first target), 3325 (second target) Stop loss 3292 (break through the previous low support).
Short position strategy:
Entry point: 3325-3330 range (price touches pressure and falls back, 15-minute chart MACD dead cross), try short with a light position, take profit target: 3310 (first target), 3300 (second target); Stop loss: 3338 (break through the previous high pressure).
2. Follow the trend after the breakthrough (trend following) Upward breakthrough (stabilizing 3330): Pursue long signal: the price breaks through 3330 with large volume and then falls back without breaking, the target is 3350-3360 (previous high of the daily line);
Stop loss: 3320 (below the breakthrough point).
Downward break (falling below 3300): Pursue short signal: the price falls below 3300 and the pullback confirmation is invalid, the target is 3280-3260 (weekly MA20 support); Stop loss: 3310 (above the break point).
Pattern interpretation:
- The 4-hour chart converges in a symmetrical triangle, and the theoretical target after the breakthrough is the height of the triangle ; If it breaks upward, the target is 3350; if it breaks downward, the target is 3270.
Volume coordination: When breaking through, the trading volume needs to be enlarged by more than 20%, otherwise be alert to false breakthroughs.
Gold is in the stage of oscillating and choosing direction in the short term, and the strategy is mainly to sell high and buy low within the range + follow the breakthrough.

Gold still has a chance to reboundCurrently, gold's bulls and bears are still oscillating within a large range. The key pressure above and the upper edge of the range are maintained near 3365-70, while the lower edge of the large range and the support are maintained near 3260. It is very likely that there will be multiple shocks and choices within this range again.
Gold retreats to around 3302-00 during the day, go long, target around 3330-50, stop loss 3295.

GOLD / XAUUSD: Analysis Daily!🔷 BUY XAUUSD: 3298/3300 (swing)
- Stoploss: 3293
- Target: 3310 / 3320 / 3330 / 3350
*Signals are for reference only, not recommended to be followed!*
Analysis: XAU/USD has a neutral-to-bullish near-term outlook. On the 4-hour chart, it's struggling with a flat 20 SMA, while the 100 and 200 SMAs are risin. Indicators are improving but still weak and in negative territory.
Support levels: 3314 - 3301
Resistance levels: 3344 - 3358

Is gold’s adjustment over? Can we go long?Gold has repeatedly tested the 3260-3270 area to gain support. The short-term gold trend has formed multiple bottom structures, so the short-term gold trend may be over. Currently, gold is mainly long around 3330.
Trading ideas: Buy gold near 3330, stop loss 3320, target 3360

Gold maintains bullish mindsetThere is a fierce game between bulls and bears in gold prices, but we remain bullish in the long term. The intraday layout follows the general trend and focuses on the gains and losses of the 3260 support below. As long as it remains above 3260, we will maintain our bullish outlook and wait for the gold price to fall slightly to around 3275 before we can intervene and go long in batches!
Gold is long near 3275, stop loss 3260, target 3300
Golden three-game winning streak, next week’s market?Gold's 1-hour moving average continues to be short, but after gold bottomed out at first-line support near 3265, gold rebounded to more than 50 US dollars. So is this rebound a reversal? Not sure yet, because the fluctuations are basically around 100 US dollars every day, and a rebound of 50 US dollars can hardly be called a reversal. The strength of next week is the key.
If gold does not rebound very strongly next week, then gold will still fluctuate and be bearish. The resistance of the 1-hour moving average above gold is near 3354, and the top of the negative line of gold on Friday is near 3352. If there is no effective breakthrough of these two positions next week, it will still be a fluctuating and bearish trend.

Short gold directlyGold's 1-hour moving average is still in the form of a dead cross, and gold fell back again after rising high, so gold is now beginning to fluctuate. Although gold broke through the 3367 line, gold did not stand firm after the breakthrough. For the time being, gold is still fluctuating in a wide range.

Gold fluctuates and adjusts, will next week be the key?Gold fell all the way in the US market on Friday, with the lowest falling to the 3283 line. However, gold once again rose as a risk aversion. Will gold return to a large range of shocks, or will the adjustment end? The trend of gold after the opening next week will be critical. If gold continues to rise strongly at the opening next week, then gold may end its adjustment, and gold bulls may continue to exert their strength
If gold is still under pressure at 3332 after the opening next week, then gold may continue to fluctuate downward in the short term, thereby driving the moving average to turn. If it directly breaks through 3332 strongly after the opening, then gold will start to fluctuate in a large range.
The current market is very volatile due to the impact of news, and the next trend of gold will become clear on Monday. I will continue to bring analysis to my friends on Monday

Gold has been crazy recently, how to trade it?
Gold's 1-hour moving average continues to be arranged with golden crosses upward. It is difficult for gold bulls to make a major correction. Gold's US market directly continues to break upward. Then gold's short-term 3317 will once again form a support. If gold falls back near 3320, it can continue to go long.
Although gold is going crazy now, when you are bullish, you should also pay attention to the opportunity for a pullback. Unless the strength is suddenly strong at that time, don't chase the bullish easily. Wait patiently for the chance of a pullback.

Gold Maintains Weekly Bullish Structure Amid PullbackGold Weekly Technical Outlook
Gold (XAU/USD) remains in a clear bullish trend on the weekly chart, currently trading around $3,230. After marking a new high, price action suggests a potential pullback—a healthy retracement that could set the stage for further gains.
Key Levels to Watch:
Current Price: $3,230
Retracement Zone:
First support at $3,100, a recent consolidation level
Deeper support between $2,950 – $2,900, aligned with prior breakout structure and strong demand from earlier in the trend
These levels are key for a potential bounce, as they mark high-probability zones for buyers to re-enter the market.
Upside Targets:
Short-term resistance: $3,280
Primary target (by mid-May): $3,400
This level aligns with the projected extension of the ascending structure and continuation of bullish momentum
Technical Outlook:
As long as gold holds above $2,900, the weekly bullish trend remains intact. A rebound from the retracement zone would likely lead to a renewed rally targeting the $3,400 region.

Today, the short gold position has made a profit of 15 pointsGold's 1-hour moving average continues to show signs of turning downward. If gold once forms a dead cross downward in 1 hour, then gold shorts will have an advantage. The 1-hour downward trend line of gold also suppresses gold's rebound. Gold can still continue to short on the rebound. The gold trend suppression is now down to around 3108

4/2 Gold Trading StrategiesAfter yesterday's upward movement, gold experienced a deeper pullback, testing the 3100 area before rebounding to around 3120. However, based on technical indicators, the bullish outlook remains uncertain.
The key resistance to watch is around 3125—if the price fails to break through, we shouldn't expect higher levels today. In that case, the main trading direction will be short positions, with a possible drop to 3086 before tomorrow’s data release.
However, if 3125 resistance is broken and sustained, bulls may attempt another rally towards 3138-3150. On the bearish side, support in the 3103-3096 region is crucial.
Trading Recommendations:
📌 Main Trades:
Buy in the 3098-3086 range
Sell in the 3138-3148 range
📌 Short-Term Scalping:
Sell in the 3124-3131 range
Buy in the 3109-3103 range

GOLD-Sell in the 3128-3138 rangeThe buy orders placed at 3121-3124 yesterday successfully reached the take-profit zone of 3132-3138 today, after which the price also entered the short-selling zone of 3135-3145, leading to another profitable trade.
As of now, the 3124 support remains intact, but bullish momentum has significantly weakened. Without further fundamental catalysts, a technical-based approach suggests prioritizing short positions, as the recent surge of over $130 makes a technical correction increasingly imminent.
Trading Strategy for Today:
📉 Sell in the 3128-3138 range
📈 Buy in the 3103-3093 range

What reason do we have to go short?Gold hit a high and then fell back to meet the support of the moving average. Can you make money by going long on gold above 3130? In a bullish trend, just do what bulls should do and don’t worry too much about gold peaking. The market will give a signal when gold peaks. At present, we continue to do more in the trend.

Gold is crazy. When will it peak?Gold has experienced a wave of rapid declines and market washouts. It successfully made many people get off the market with one move, and then it continued to rise all the way. It is really strong.
At present, it seems that gold is getting closer and closer to the top, but you can still take advantage of the pullback to make long orders, but you must not stay in the long term.
At present, gold is getting closer and closer to the top, but you can still take advantage of the correction to go long, but don't be a long-term investor. Gold can take advantage of the trend to take long positions above 3100

Last Friday, 3085 was shorted to make a profit, next week?Gold fell back on Friday after rising higher, and gold encountered resistance at 3085. However, gold is still just adjusting for the time being. Gold rebounded after the adjustment, and gold bulls are still relatively strong. You can continue to buy gold after it falls next week. After all, gold bulls are strong now, but don't chase it at high levels, and wait for it to fall before buying more.
The 1-hour chart of gold still shows a golden cross with upward bullish divergence. After the adjustment, the gold bulls did not weaken, but continued to be strong. Therefore, the decline of gold is just an adjustment. Gold can continue to go long after the adjustment next week. Gold rose again after bottoming near 3067 on Friday. The gold moving average support has now moved up to a line near 3072. Therefore, gold is still a support area in this range. Then if gold falls back to support near 3070 next week, it will still be long on dips.

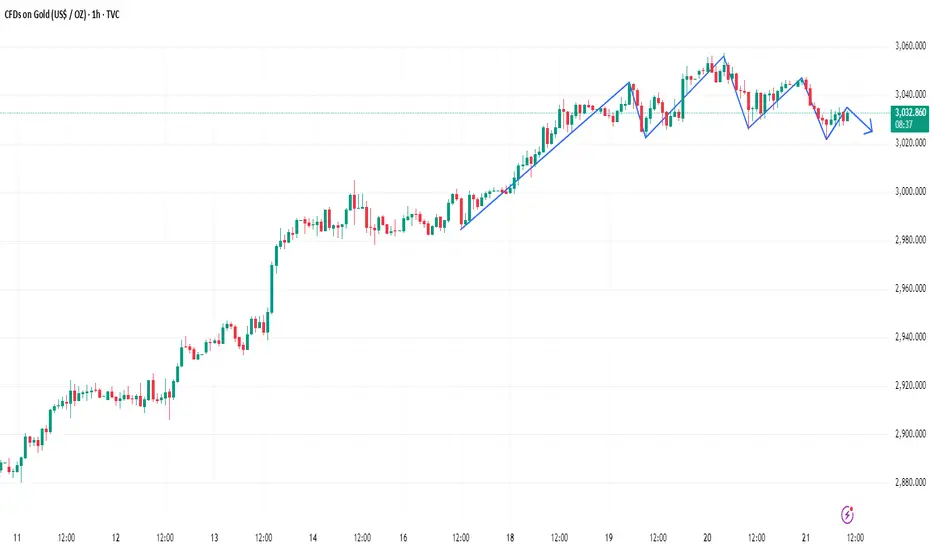
Gold’s rebound is limited, will it continue to fall?Gold rebounded, but the rebound was not large. Today, there is still a trend of continued weakening. Gold encountered 3026 pressure and fell under pressure. Pay attention to shorting opportunities near 3022

Can gold be shorted directly?The 1-hour moving average of gold has begun to turn slightly downward, and the strength of gold bulls has been suppressed. The 1-hour gold has now formed a head and shoulders pattern. If the strength of gold's rebound is limited, then the room for further decline of gold will increase.
Trading idea: short gold around 3032, stop loss 3042, target 3022
Gold Market Forecast: Next Week’s Trading Setup & Key Price ZoneGold remains range-bound near record highs, with bullish potential as traders eye the Fed’s next move. Concerns over U.S. tariffs driving inflation, ongoing geopolitical tensions, and China’s rising gold reserves add to market uncertainty.
In this video, I break down the key technical level, market sentiment, and my personal strategy for positioning ahead of next week’s price action.
🔔 Don’t forget to like, subscribe, and hit the notification bell for more market insights!
#GoldPrice #XAUUSD #GoldForecast #GoldTrading #ForexAnalysis #MarketNews #FederalReserve #InterestRates #SafeHaven #Geopolitics #TradingStrategy
Disclaimer:
Forex and other market trading involve high risk and may not be for everyone. This content is educational only—not financial advice. Always assess your situation and consult a professional before investing. Past performance doesn’t guarantee future results.

Gold weekly View and important levels to play. Gold has broken has ATM, we can see some retracement to the downside then again pullback to the upside as long expected 40k or 50k

Gold (XAU/USD) ForecastXAUUSD (GOLD Update)
Price is trading in the mid-range level, expecting a sell-off in it onto the marked demand zone in the chart.
