Gold Technical Analysis - Bearish Bias Below $3,384Gold is currently trading near $3,373 within an ascending channel but showing signs of weakness. A rejection near the $3,384–$3,390 resistance zone could trigger a downside move toward key supports at $3,350, $3,338, and $3,326. If price breaks below the channel midline, bearish momentum may strengthen. However, a bounce from support could push gold back toward the upper range. Keep an eye on breakout zones for the next move.
🔑 Key Levels to Watch
- Resistance: $3,384 → $3,390: Strong resistance zone
- Support: $3,350 → $3,338 → $3,326
- Breakout Zones: Below $3,338: Opens room to $3,310 and below. Above $3,390: May lead to fresh highs toward $3,410+
🧭 Trend Outlook
- Short-Term: Bearish bias within the ascending channel, especially if price breaks below mid-channel.
- Medium-Term: Neutral to bullish as long as the lower channel trendline holds.
- Momentum: Losing bullish momentum; potential for downside correction.
Price is at a decision point within the ascending channel. A clean break below the mid-channel and $3,365 area can accelerate downside correction. Stay alert to key support zones and any reversal signals.
Note
Please risk management in trading is a Key so use your money accordingly. If you like the idea then please like and boost. Thank you and Good Luck!
Xauusdsell

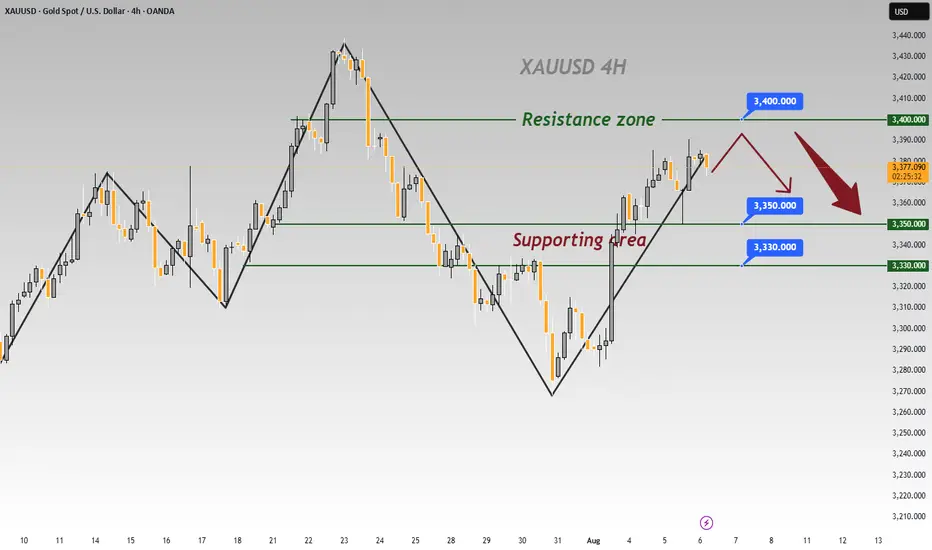
8/8: Continue to Focus on Selling, Watch Support at 3372–3366Good evening, everyone!
Today, after breaking above the 3400 level, gold experienced a pullback. The current structure shows dense support below, with previous resistance levels at 3378, 3372, and 3366 now turning into support.
On the daily chart (1D), price remains above the MA20, and the MA5 (~3382) serves as key short-term support. The candlestick formation still reflects a bullish structure for now.
However, the 4-hour chart (4H) reveals significant upward resistance, and unless the 4H structure is repaired, the market may favor a corrective or consolidation phase in the near term.
🔍 Trading Outlook:
For the remainder of today’s session and early next week, the strategy should primarily focus on selling into strength.
If the 4H chart corrects via a direct price retracement, gold could potentially test the 3348–3337 support zone.
Prior to that, closely monitor the 3372–3366 area as the primary short-term support and pivot zone.

SHORT ON GOLD (XAU/USD)GOLD has a nice rising channel which is a (BEARISH) reversal pattern with plenty of sell side liquidity to be captured to the downside.
I sold GOLD at 3397 and expect Gold to fall over $80-$100 which is 800-1000 pips.

XAUUSD SignalFrom a technical perspective, the commodity has been struggling to capitalize on the recent strength beyond the $3,380-3,385 region. Moreover, mixed oscillators on the daily chart warrant caution for the XAU/USD bulls. That said, this week's bounce from the 200-period Simple Moving Average (SMA) on the 4-hour chart backs the case for a further appreciating move. Some follow-through buying beyond the $3,400 mark will reaffirm the constructive outlook and lift the Gold price to the $3,420-3,422 intermediate hurdle en route to the $3,434-3,435 supply zone. A strength move beyond the latter would set the stage for a move towards retesting the all-time peak, around the $3,500 psychological mark touched in April.
On the flip side, any corrective pullback might continue to find decent support near the $3,350 area. This is closely followed by the 200-period SMA on the 4-hour chart, which, if broken decisively, might prompt some technical selling and drag the Gold price to the $3,315 intermediate support en route to the $3,300 round figure. Acceptance below the latter would expose the $3,268 region, or a one-month low touched last week.

8/7: Continue to Focus on SellingGood afternoon, everyone!
During today’s session, gold successfully moved into the anticipated resistance zone of 3386–3398, and encountered significant selling pressure near 3398, resulting in a retracement to around 3372. While the price action aligned with prior expectations, the delayed timing has led to a bearish shift in the technical structure, which may hinder further upside momentum for the bulls.
That said, important economic data will be released during the US session later today. We’ll need to observe whether bulls can leverage the potential catalyst to break through the current resistance levels.
⚠️ Trading Strategy Recommendation:
Regardless of the data outcome, it is advisable to maintain a bearish bias in subsequent trades.
From a technical standpoint, the higher the price climbs, the greater the probability of a pullback, making short positions relatively less risky.
📌 Reference Range:
Continue to monitor and trade within the key zones outlined yesterday, adjusting entries and exits as per intraday developments.

Gold: Yesterday’s Surge & Today’s Session StrategyDuring yesterday’s U.S. trading session, gold surged to around 3390 🚀, driven by a series of tariff-related remarks from Trump, Fed personnel changes, and market expectations that the probability of a September rate cut has risen to 91% ⚡️. We successfully took profit near 3355 yesterday, locking in close to maximum gains 💰.
Today’s trading strategy:
Go short at highs during the Asian session 📉
Go long at lows during the European session 📈
Go short at highs again during the U.S. session 📉
⚡️⚡️⚡️ XAUUSD ⚡️⚡️⚡️
🚀 Sell@ 3390 - 3380
🚀 TP 3375 - 3366 - 3356
Daily updates bring you precise trading signals 📊 When you hit a snag in trading, these signals stand as your trustworthy compass 🧭 Don’t hesitate to take a look—sincerely hoping they’ll be a huge help to you 🌟 👇
Gold Rejected from Supply - Clean Sell SetupHello traders!
This is a clean, textbook sell setup.
Gold has an overall bearish structure.
It has reached an important supply area and been rejected.
We are aiming for a sell position here upon breaking the upward trendline.
The target is around 3300.
8/6: Watch for a Potential Double Top FormationGood morning, everyone!
Yesterday, gold experienced its first significant supply pressure around the 3386 level, but with support near 3350—helped by positive data—prices rebounded and climbed back toward 3390, resulting in solid overall gains.
From the 1-day chart (1D) perspective, the technical structure remains bullish, with MA20 providing firm support. Although short-term moving averages are currently converging, the overall bias remains towards a bullish divergence, suggesting further upside potential. There's a possibility for price to test the 3400–3420 zone in today’s session.
That said, the 3386–3398 region may still pose minor selling pressure, although it is not expected to be particularly strong. Key intraday support is seen in the 3378/3372–3362 range. If the market encounters another wave of heavy selling that damages the daily bullish setup, then the 3343–3348 area will become a critical battleground between bulls and bears.
📌 Trading Strategy for Today:
Maintain a sell-on-strength approach, especially if prices approach the 3418–3438 resistance area, where short opportunities become more attractive;
If a pullback occurs, monitor the aforementioned support zones for potential buy-on-dip opportunities, contingent on stability.
⚠️ Market Risk Reminder:
There will be key economic speeches during the US session, which could trigger heightened volatility. Ensure proper risk management and stop-loss settings are in place.

GOLD (XAU) SHORT - Double top 30minRisk/reward = 2.8
Entry price = 3382.5
Stop loss price = 3390.5
Take profit level 1 (50%) = 3361.7
Take profit level 2 (50%) = 3356
I am considering a short on gold.
Still need some variables to fall into place before I enter the trade.
There is nice RSI negative divergence showing declining momentum.
Further confluence:
- Potential head and shoulders on higher time frame
- At area of previous diagonal support which could be turned into resistance if the 30min double top plays out
continue to maintain gold purchase, 3400⭐️GOLDEN INFORMATION:
Gold prices edged higher on Monday, supported by growing expectations of a Federal Reserve rate cut following last Friday’s disappointing U.S. Nonfarm Payrolls report. XAU/USD is trading around $3,375, up 0.39% on the day.
Speculation over a potential policy shift has strengthened, with markets now pricing in an 87% chance of a rate cut at the Fed’s September 17 meeting — a boost for the non-yielding yellow metal.
Last week’s labor data revealed early signs of weakness in the job market. The U.S. Bureau of Labor Statistics (BLS) revised May and June payrolls down by a combined 258,000 jobs, reinforcing dovish remarks from Fed Governor Christopher Waller, who downplayed tariff-driven inflation and emphasized concerns about the Fed’s full employment mandate.
⭐️Personal comments NOVA:
Uptrend, gold price is maintaining stability. Heading towards 3400, before the expectation of interest rate cut is becoming more and more obvious.
⭐️SET UP GOLD PRICE:
🔥SELL GOLD zone: 3415- 3417 SL 3422
TP1: $3405
TP2: $3394
TP3: $3380
🔥BUY GOLD zone: $3311-$3313 SL $3306
TP1: $3325
TP2: $3338
TP3: $3350
⭐️Technical analysis:
Based on technical indicators EMA 34, EMA89 and support resistance areas to set up a reasonable BUY order.
⭐️NOTE:
Note: Nova wishes traders to manage their capital well
- take the number of lots that match your capital
- Takeprofit equal to 4-6% of capital account
- Stoplose equal to 2-3% of capital account

8/5: Watch for Short Opportunities Near 3400Good morning, everyone!
On Wednesday, gold held above the key support area at 3343–3337, and subsequently broke through the 3372–3378 resistance zone, leading to a strong bullish move and solid long-side gains.
Today, attention should shift to the major resistance around 3400. If bullish momentum continues, price may approach the secondary resistance near 3420. However, from a technical perspective, signs of bearish divergence have begun to emerge. Should price continue rising while momentum weakens, the risk of a short-term correction increases accordingly.
Key levels to monitor:
Primary resistance zone: 3404–3416
Intermediate supply area: around 3398
Crucial support zone: 3372–3363 (a hold here could support further upside)
⚠️ Cautionary Note:
The US PMI data release during the New York session could introduce volatility. Be sure to maintain strict risk management and stop-loss discipline during periods of increased uncertainty.
🔁 Trading Bias for Today:
Prefer selling into strength near resistance, while cautiously considering buying on dips near support.
The 3343–3337 area continues to serve as the primary support zone, and price action around this level will be critical in determining the next directional move

XAUUSD:BUYThere is no need to worry about holding long orders mentioned last Friday. Gold prices continued to rise this week after a pullback. The price has risen to 3372. According to the research team of our swing trading analysis team, the bullish trend will continue.
Earlier I informed members that some buy orders were closed at high levels. At that time, the short-term high was around 3370. After closing the long orders, the price subsequently fell. This is the advantage of swing trading. You can use accurate trading signals to trade in batches in the short term, thereby creating opportunities for quick profits.
After the pullback, there is still good room for buying and opportunities.

8/4: Watch Support at 3343–3337 and Resistance at 3372–3378Good morning, everyone!
Last Friday, gold rallied strongly, driven by a combination of favorable economic data and bullish technical signals, decisively breaking above the 3337–3343 resistance zone. During the subsequent pullback, price action remained firm above 3337, followed by a secondary upward move.
From a technical standpoint, the structure suggests the potential for continued upward consolidation, with the possibility of filling the gap near 3396. However, significant resistance remains between 3372 and 3378 — failure to break through this zone decisively may result in a short-term pullback before further gains.
Key levels to watch:
Initial support: 3348 and 3337–3343 zone
Major support: 3312–3300 zone (a break below could signal deeper downside risk)
Trading Strategy:
Focus on intraday setups around these critical areas. Look for buy opportunities on dips as long as support holds, while remaining cautious of sharp pullbacks near strong resistance.

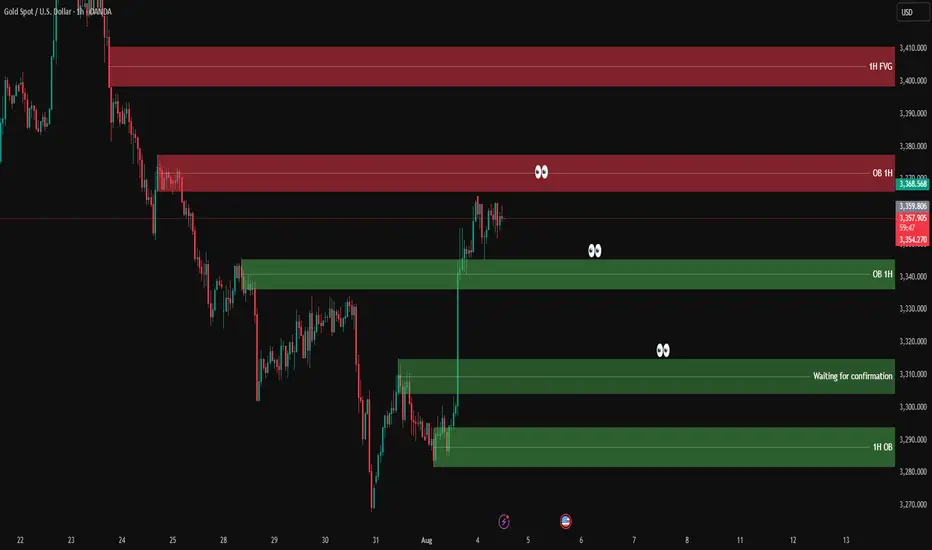
XAUUSD analysis - 1H FVG and OB setupsOn the 1H chart, price has made a sharp bullish move from the lower 1H OB zone (3,275 – 3,285) and is now hovering just below the 1H supply zone.
🔴 1H Supply Zone (OB):
3,354 – 3,368 → Price is consolidating here with no strong rejection yet.
🟢 1H Demand Zone (OB):
3,337 – 3,344 → First area to watch for potential bullish reaction.
👁 Mid-level support zone (waiting for confirmation):
3,310 – 3,320 → If price pulls back here and gives confirmation on lower timeframe, we’ll look for long setups.
📌 Trade scenarios:
1️⃣ Bullish: Wait for a retracement into 3,310 – 3,320, and if confirmed on LTF (3M–5M), go long.
2️⃣ If price drops deeper into the lower OB zone 3,275 – 3,285 and gives strong bullish reaction → potential long setup again.
3️⃣ Bearish: If price rejects the current OB zone (3,354 – 3,368) with confirmation → short entry targeting the green zones below (~3,320 or 3,310).
✅ Entry only after confirmation on lower timeframe
❌ No confirmation = no trade
XAUUSD Possibility of a small correction towards 3330, re-entering the bearish phase and moving towards the specified targets

Gold Surges on Non-Farm Data; 3330 Key Next WeekGold was strongly boosted by the significantly bullish non-farm payroll data, surging sharply like a rocket 🚀, with gains that completely "wiped out" all the weekly losses. The current gold trend, as if injected with super momentum, has completely broken the previous long-short stalemate. Starting from the 3300 level, it has been breaking through obstacles all the way up to 3350. At present, 3330 is like a critical "battleground" ⚔️ fiercely contested by both long and short sides.
This week, when gold was still "lingering" below 3300, I emphasized repeatedly that a rebound was inevitable – we just needed to stay calm and wait for the opportunity. As it turns out, our judgment was spot on, and we successfully took profits around 3340, reaping good gains 💴. Now, gold prices are oscillating back and forth in the 3340-3350 range. Based on a comprehensive analysis of the current trend, I boldly predict that gold is likely to pull back to around 3330 next week, so everyone can prepare in advance 🤗
⚡️⚡️⚡️ XAUUSD ⚡️⚡️⚡️
🚀 Sell@ 3350
🚀 TP 3330 - 3320 - 3310
🚀 Buy@ 3300 -3310
🚀 TP 3320 - 3330 - 3340
Daily updates bring you precise trading signals 📊 When you hit a snag in trading, these signals stand as your trustworthy compass 🧭 Don’t hesitate to take a look—sincerely hoping they’ll be a huge help to you 🌟 👇

GOLD Correction Ahead!
HI,Traders !
#GOLD is growing strongly
And the pair looks locally
Overbought so after it
Hits the horizontal resistance
Area around 3374.56 we will
Be expecting a local bearish
Correction and a move down !
Comment and subscribe to help us grow !

XAUUSD:Swing Sell Is Highly Likely! Get ReadyWe expect a smooth drop in gold prices, with prices potentially dropping around the 3250 area. Use Accurate Risk Management.
Please like and comment!
Team Setupsfx_
XAUUSD ultra-short-term sell trade.The hourly chart still shows a downward trend. Short-term downward pressure will continue. If you want to trade in the London market, consider selling at high levels and pursuing short-term trend trading.
3300-3295 SELL
TP3285-3280

Gold’s Glitter Fades: Why $3,250 Is the Next Big Drop🧠 Fundamental Analysis
Despite recent bullish momentum, several macroeconomic and policy-driven headwinds could pressure gold prices lower toward the $3,250 mark:
1. **Fed Policy Shifts (Higher for Longer):**
The Fed’s persistent “higher-for-longer” stance on interest rates has kept real yields elevated. With the U.S. economy still showing resilience (strong labor market, consumer spending), markets are pricing out aggressive rate cuts. Higher real yields reduce gold’s appeal as a non-yielding asset.
2. **Strengthening U.S. Dollar (DXY):**
Renewed dollar strength, driven by global risk aversion and higher U.S. yields, is acting as a headwind for gold. Since gold is priced in dollars, a rising DXY typically puts downward pressure on bullion.
3. **China & India Demand Weakness:**
Physical gold demand in key markets like China and India has been softening. High local prices, subdued consumer sentiment, and tighter liquidity conditions in China are dampening jewelry and investment demand.
4. **Geopolitical Easing:**
As geopolitical tensions (e.g., Middle East or Ukraine) show signs of stabilization, the fear premium embedded in gold could start to unwind.
---
## 📉 Technical Analysis – Bearish Setup to $3,250
From a chartist’s view, gold shows early signs of technical exhaustion and potential reversal:
1. **Rising Wedge Breakdown:**
Gold recently broke down from a **rising wedge pattern** on the daily timeframe—a classic bearish continuation setup. Price failed to hold the breakout above \$2,450 and is now forming lower highs.
2. **Bearish Divergence (RSI & MACD):**
Both RSI and MACD are flashing **bearish divergence** on the weekly chart. While price made new highs, momentum indicators did not confirm—suggesting weakening buying pressure.
3. **Fibonacci Retracement Targets:**
A pullback toward the **50% retracement** of the March–July rally aligns closely with the \$3,250 level. This would be a logical technical correction zone.
4. **Volume Profile Gaps:**
The VPVR (Volume Profile Visible Range) shows a low-volume node around $3,250, implying weak support. If price breaches the $3,400 psychological level, a swift drop to $3,250 is plausible.
5. **Elliott Wave Perspective:**
If the recent top was wave 5 of a larger impulsive structure, we may now be entering an **ABC corrective wave**, with Wave C potentially targeting the $3,250 area.
---
## 📍 Key Levels to Watch
* **Resistance:** $3,420 $3,500
* **Support:** $3,400 → $3,250 → $3,000
* **Trigger Point:** Break below $3,400 with volume confirmation
---
## 📊 Strategy Notes
* **Short Bias**: Watching for rallies to short near \$3,400–\$3,450 with tight stops.
* **Risk Management**: Be cautious around key macro events (NFP, CPI, FOMC).
* **Confluence is Key**: Look for alignment between macro headwinds and chart setups.
---
📌 **Conclusion:**
While gold’s long-term bull thesis remains intact, a medium-term correction to $3,250 appears increasingly likely due to weakening fundamentals, overbought technical conditions, and waning momentum. Traders should prepare for volatility and focus on disciplined execution around key support zones.


Gold Struggles at Resistance – Indicates Lower Lows AheadGold has been in a clear downtrend after facing a strong rejection around the 3,438 level (main resistance zone). Price is currently moving within a descending channel, confirming the formation of lower highs and lower lows – a classic bearish market structure.
Currently, Gold is trading near 3,306, facing resistance at 3,339 (marked as a possible lower high). If price fails to break above this level and sustain, there is a strong probability of continuation towards 3,249 and even 3,216.
Key Technical Highlights
- Immediate Resistance: 3,339 – 3,353
- Support Levels: 3,301 (short-term), 3,249, and 3,216
A rejection near 3,339 can lead to another leg down targeting 3,249 and 3,216. However, a strong breakout above 3,339–3,353 could temporarily shift momentum towards 3,394.
Note
Please risk management in trading is a Key so use your money accordingly. If you like the idea then please like and boost. Thank you and Good Luck!

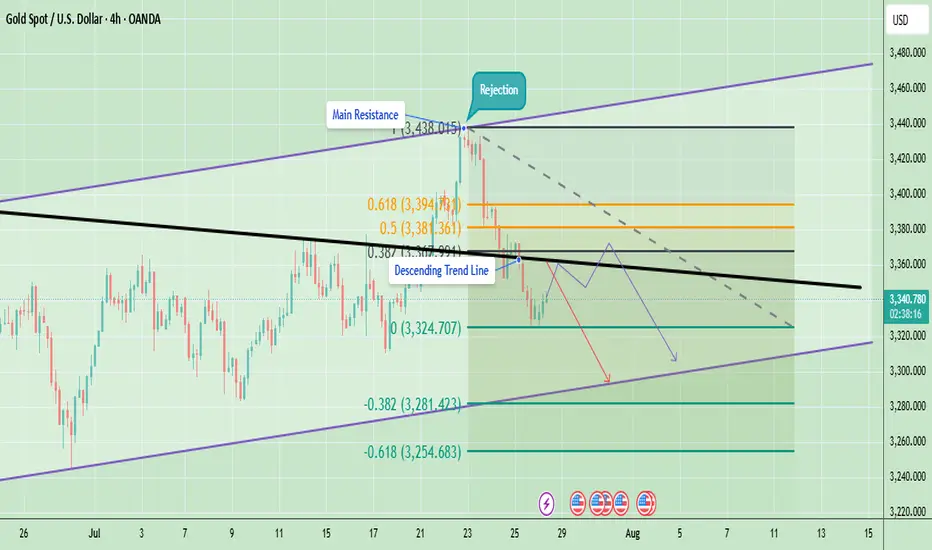
Technical Analysis - Gold Rejected at ResistanceGold is currently trading around $3,341 after facing a strong rejection from the $3,438 resistance area. This rejection coincided with the upper boundary of the trend channel and the main resistance zone, which also aligns with the Fibonacci 0.5–0.618 retracement levels. After the rejection, price fell below the descending trendline, indicating that short-term sellers have taken control.
On the downside, the immediate support sits at $3,324, which has acted as a short-term bounce level. A break below this could push gold lower toward $3,281 and potentially $3,254, which are key Fibonacci extension support levels. On the upside, the immediate hurdle is at $3,355–$3,360 (descending trendline). A breakout above this area will be critical for any bullish recovery attempt toward $3,381–$3,394 and eventually $3,420–$3,438.
At the moment, the short-term trend remains bearish because gold is trading below the descending resistance and showing lower highs. However, as long as gold holds above the $3,254 support zone, the medium-term structure remains neutral to bullish, giving bulls a chance if momentum shifts again.
Last week candle is pin bar bearish candle which is showing bearish momentum at the moment. The candle shows rejection near $3,400–$3,450, aligning with the triangle’s upper resistance trendline. If gold cannot reclaim and hold above last week’s high, price may drift lower to retest support zones around $3,248–$3,150 before another breakout attempt.
Note
Please risk management in trading is a Key so use your money accordingly. If you like the idea then please like and boost. Thank you and Good Luck!