XAU/USD Bearish Trade Setup Supply Zone Rejection to Target 3350Trend Overview
📉 Downtrend in Play
Price has reversed from the peak near $3,354
Currently trading below the 70 EMA (📍$3,299.86)
Forming lower highs – indicating bearish momentum.
Key Zones & Levels
🔶 Supply Zone (Resistance)
📍 $3,290.72 – $3,353.41
Strong selling pressure expected here
Possible short entry if price gets rejected
🟦 Support Zone (Previous Support)
📍 Around $3,254 – $3,210
Price has previously bounced here
🎯 Target Point (Take Profit)
📍 $3,050
Clear support level – used as a profit target
Trade Setup – Bearish Bias
🟩 Entry Point
📉 Sell near $3,290.72 (inside supply zone)
🛑 Stop Loss
❌ Above $3,354.69 (above resistance line)
✅ Take Profit
💰 Target $3,050
⚖️ Risk-Reward Ratio
Approx. 1:3 – Favorable for short trades.
Summary
🔍 Watch for a rejection in the supply zone
💼 Setup is ideal for short sellers
📊 Downtrend is supported by structure and EMA
Xauusdsell

GOLD TRADE IDEA – XAUUSD 15-Min Chart | Sell SetupGold Spot (XAUUSD) is presenting a short (sell) opportunity on the 15-minute chart. The suggested sell zone is between 3235–3238, with multiple take-profit targets and a clear stop-loss:
Sell Entry: 3235 / 3238
TP 1: 3232
TP 2: 3228
TP 3: 3225
TP 4: 3222
TP 5: 3215
Stop-Loss (SL): 3245
This setup is based on price rejection from resistance and potential downward continuation toward the highlighted support zone. Always manage risk accordingly.

5/13 Gold Trading Signals🌞Good afternoon everyone!
Yesterday, gold successfully entered the 3218–3198 buy zone, delivering notable profits.
So far, the price has tested both the 3218 support and the 3246 resistance multiple times, reflecting a fierce battle between bulls and bears. From a technical perspective, bulls appear slightly favored in the short term, with major resistance located between 3286–3320.
⚠️ However, if gold fails to break through this area and reverses, it may initiate a medium-term downtrend, potentially falling toward the 3169–3110 zone.
📌 Trading Recommendations for Today:
Sell Zone: 3305 – 3330
Buy Zone: 3208 – 3178
Flexible Trading Ranges:
▫️ 3218 – 3252
▫️ 3282 – 3248
▫️ 3252 – 3303

XAUUSD IS RECOMMENDED TO BE SOLDHere I Created This XAUUSD Chart Analysis
Pair : XAUUSD (Gold)
Timeframe: 15 - Minutes
Pattern: Resistance Level
Momentum: Bearish/ SELL
Entry Level : SELL 3247
Resistance zone : 3254
Target Will Be : 3220
Disclaimer : This signal is based on personal analysis for learning purposes. Trade at your own risk and always use proper risk management.

Gold is trading sideways, can the bearish trend continue?🗞News side:
1. China-US trade relations eased, suspending some tariffs and countermeasures
2. Russia and Ukraine suspended firing for 30 days, and the India-Pakistan conflict was temporarily mediated
📈Technical aspects:
The trading strategy given today, if brothers have reference and follow the trading strategy to participate in long orders, I think you should all have good gains on hand. At present, gold is in consolidation, the 4H moving average is in a short position, and the MACD dead cross continues to increase, so the short-term short momentum still exists. From a technical point of view, in the downward trend from last week's high of 3347 to the current low of 3207, 3260 is at a key position. Therefore, we pay attention to the possibility of gold rebounding to 3260 in the evening.
If you agree with this view, or have a better idea, please leave a message in the comment area. I look forward to hearing different voices.
OANDA:XAUUSD FX:XAUUSD TVC:GOLD FXOPEN:XAUUSD FOREXCOM:XAUUSD

XAUUSD May 12 New York real-time trading strategy analysis.The normal plan is to trade in a unilateral falling market. However, Russia's negotiation agreement with Ukraine has not stopped. While the cashing sentiment has risen, the tax issues between the United States and China have declined. This is why the New York market continued to rebound to 3247 and then fell back to 3220.
If the price of the New York market cannot continue to break through the position of 3233 and stabilize. Then the price will continue to fall. The target is below 3190. There may be support at 3200, but it will not be too strong. But if the position of 3233 stabilizes and breaks through above 3348 again. Then we need to pay attention to the position of 3360-3375 again.

XAUUSD DOUBLE TOP BEARISH PATTERNKey Factors to Consider:
Breakout Confirmation – If price decisively breaks below the neckline of the double top, it strengthens the bearish outlook.
Volume Analysis – A surge in selling volume at resistance or during the breakdown can validate the pattern.
Momentum Indicators – RSI, MACD, and Stochastic Oscillator can help confirm bearish momentum.
Support Levels – Watch for intermediate support zones that could slow down the decline before reaching 3203.
Resistance: 3500
Target: 3203

Focus on shorting opportunities near 3250 in the US market
📌 Gold drivers
After two days of trade talks in Switzerland, the United States and China announced "substantial progress", marking a possible turning point in efforts to ease tensions between the world's two largest economies. Chinese Vice Premier He Lifeng called the talks an "important first step" toward stabilizing bilateral trade, and U.S. Treasury Secretary Scott Bessant expressed the same view, noting that the talks had made meaningful progress. The United States is expected to release more details on the results of the negotiations on Monday.
As the United States and China announced an agreement to cut reciprocal tariffs, the dollar strengthened, weakening the appeal of gold as a safe-haven asset. Spot gold fell 3% on Monday to a low of more than a week, hitting a low of $3,208 during the day, the lowest level since May 1, and the day's decline had reached $100. At the same time, the U.S. dollar index rose by more than 1%, making gold more expensive for holders of other currencies.
📊Comment Analysis
Gold still has room to go down, and the strength of gold bears is still there. Gold rebounded twice in the US market and fell back under pressure near 3250.
💰Strategy Package
At present, the US market still has a demand for a pullback, and the long position near 3220 can now be closed for profit. For the US market, we should first look at the area around 3250. After the pullback is in place, continue to play short orders to look at the target position of 3200. If it breaks upward, find a new point layout. This week's data market and news will have a further impact on gold. For real-time layout of accurate trading signals, please follow the free channel.
⭐️ Note: Labaron hopes that traders can properly manage their funds
- Choose the number of lots that matches your funds
- Profit is 4-7% of the fund account
- Stop loss is 1-3% of the fund account

On May 9, the London market XAUUSD real-time trading strategyXAUUSD's huge drop hit 3274. From the side news, there is no huge potential impact. Because almost all important data are updated. From the larger level of K-line cycle, the top structure appears, which is why I remind everyone to continue to sell.
In the trading process, it is very important to switch from long to short. Often some traders always suffer huge losses in their accounts due to misjudgment. This week, under my accurate prediction, the market trend is exactly the same as I expected.
Summary: There is no major news affecting the current situation. And it is the last trading day of this week. For XAUUSD, maintaining high selling is the current trading direction. There are signs of returning to the weekly opening price at the daily level. Observe whether the pressure range of 3330-3340 can stabilize during the day. If not, we can focus on the lower profit range. 3260-3220.
To prevent missing out on some good trading strategies and ideas, remember to continue to pay attention to the ideas of the swing trading center. If you want to get more and more accurate signals, you can leave me a message.

XAUUSD New York market trading strategy.The Russian-Ukrainian war sentiment has once again ignited the market's risk aversion sentiment. After the New York market opened, the US stock market opened higher, causing XAUUSD to fall to around 3200 and then rebound. After the New York market opened, XAUUSD continued to rise to 3248.
After the weekend news continued to be digested in the Asian market and the London market, the New York market once again boosted XAUUSD due to geopolitical news.
At present, we are paying attention to whether the position of 3255-3272 can be effectively broken through and stabilized. If it cannot continue to sell at a high level.

How to layout gold as Sino-US trade eases🗞News side:
1. China-US trade relations eased, suspending some tariffs and countermeasures
2. Russia and Ukraine suspended firing for 30 days, and the India-Pakistan conflict was temporarily mediated
📈Technical aspects:
Affected by the easing of Sino-US economic and trade relations, coupled with the fact that the Russian-Ukrainian negotiations are on the right track and India and Pakistan have suspended firing, the risk aversion sentiment in the gold market has eased, and the gold price has fallen sharply since the opening today. At present, the 3200 line has formed an important short-term support. If the support effect is strong at this point, the gold price may rebound further; if it falls below this key support, it will accelerate the opening of downward space. The upper 3250-3260 is the previous intensive trading area, which will pose a certain pressure in the short term. At the top of the European market, focus on the resistance range of 3250-3260, and at the bottom, the support range is 3210-3200.
🎁BUY 3200-3210
🎁TP 3250-3260
🎁 SELL 3260-3270
🎁 TP 3250-3230
If you agree with this view, or have a better idea, please leave a message in the comment area. I look forward to hearing different voices.
FOREXCOM:XAUUSD FXOPEN:XAUUSD TVC:GOLD FX:XAUUSD OANDA:XAUUSD

XAUUSD TAKE RESISTANCE FROM TRADE LINEHere I Created This XAUUSD Chart Analysis
Pair : XAUUSD (Gold)
Timeframe: 1- Hour
Pattern: Resistance Level
Momentum: Bearish/ SELL
Entry Level : SELL 3327
Resistance zone : 3335
Target Will Be : 3300 / 3272
Disclaimer : This signal is based on personal analysis for learning purposes. Trade at your own risk and always use proper risk management.

Could India-Pak ceasefire & China-US talks trigger gold's declinNews
From May 5th to 9th, trade tensions and geopolitical conflicts have driven the gold market to rise 📈. The spot gold price has once broken through 3,438. As the bullish momentum has waned, investors have taken profits at high levels, and the weekly increase has narrowed to about 3.1%. Trump's remarks on tariffs, uncertainties in trade negotiations, the conflict between Russia and Ukraine, and the military standoff between India and Pakistan have stimulated the demand for safe-haven assets, pushing up the gold price 💹. Technical indicators show that the short-term correction pressure has increased, and the market may enter a phase of volatile consolidation 🤔.
Gold Trend
At the beginning of this week, influenced by the safe-haven property of gold, its price has increased. However, this tariff news has less of an impact on the gold price than before, and the upward trend has stopped at 3,439. After the Federal Reserve maintained its interest rate policy unchanged, the gold price has declined for two consecutive days 📉, and yesterday's closing price was above 3,300.
Looking ahead, with the ceasefire of the conflict between India and Pakistan and the advancement of the China-US talks, the gold price is likely to drop significantly next week ⬇️. The ceasefire between India and Pakistan has alleviated the geopolitical tensions, weakening the driving force for gold to rise as a safe-haven asset. If the China-US talks achieve positive results, the market's risk appetite will increase, and investors are likely to shift their funds from gold to risky assets such as stocks. In the past, when there has been progress in trade negotiations, the gold price has dropped significantly. Overall, there is an obvious downward trend for the gold price next week 😟.
⚡️⚡️⚡️ XAUUSD ⚡️⚡️⚡️
🚀 Sell@3330
🚀 TP 3280 - 3260
Accurate signals are updated every day 📈 If you encounter any problems during trading, these signals can serve as your reliable guide 🧭 Feel free to refer to them! I sincerely hope they'll be of great help to you 🌟 👇

XAUUSD/GOLD WEEKLY BUY PROJECTION 11.05.25Pattern: A bullish pennant pattern has formed, signaling a potential upward continuation.
Breakout Confirmation: Price has broken the daily short-term downtrend line and is retesting the breakout zone, which suggests potential for a strong upward move.
Support & Resistance Zones:
Support Levels: S1 (≈ 3325), S2 (~3270)
Resistance Levels: R1 (~3350), R2 (~3375), ATH & Resistance 3 (~3425)
Entry Zone: Price is in a buy zone, reinforced by a bullish spinning top candlestick and alignment with an uptrend line.
Stop Loss: Placed just below Support S2 (~3270)
Take Profit (tp): Near ATH zone (~3425)

GOLD Possible bearish movesGOLD Weekly Outlook – Waiting for a Clean Entry
My focus this week on gold is based around the recent mitigation of the 3H supply zone. It was a clean setup, but unfortunately I didn’t get tapped in — and with it being late Friday, I decided to wait for a better entry, potentially on Monday.
As bullish pressure begins to weaken, I’m also keeping an eye on the 4H supply zone above, which could offer a stronger bearish reaction and a better opportunity to sell.
On the flip side, for any potential bullish continuation, I can see price sweeping the liquidity sitting below and then reacting from the 5H demand zone I’ve marked out. That area could provide the base for a re-accumulation and another move to the upside.
Confluences for GOLD Sells:
- Clear bearish reaction from the 3H supply zone with a completed Wyckoff distribution
- Liquidity to the downside remains untapped
- Weakening bullish momentum opens room for a possible sell-off
- DXY is showing short-term bullish strength, supporting a bearish bias on gold
P.S. If price reverses and takes out the current supply zone, I’ll be watching the next 4H supply zone for further reaction — but in the meantime, I’ll adapt by monitoring for a closer demand zone setup.
Have a great trading week ahead and stay sharp, traders!

5/9 Gold Trading SignalsLong time no see, my friends! My holiday trip is about to end. I attended two weddings during this trip, which was unforgettable! I hope that everything goes well for everyone during my absence!
Gold has risen recently and returned to above 3400 again. Although it has fallen back in the past two days, the current technical level shows that the bulls are not over yet! This means that if there are friends who buy at high prices, they will have a chance to get out of trouble without doing other operations!
From the current pattern, it is in the stage of triangle consolidation. It is necessary to pay attention to the resistance of the 3360-3382 range. If the price falls under pressure at this position, we need to observe the support of the 3300-3280 range to determine whether it can form a short-term double bottom pattern or a head and shoulders bottom pattern again, so as to support the bulls to run again.
Based on the above analysis, today's trading suggestions:
Sell in the 3364-3386 range
Buy in the 3318-3302 range
Flexible trading in the 3323-3362 range

Gold is in shock again, will the short position continue?🗞News side:
1. Tariffs push up inflation and slow down the economy, and the Federal Reserve may be in trouble
2. The situation between India and Pakistan escalates again
📈Technical aspects:
Gold experienced a big plunge yesterday, and today it bottomed out near 3275 again and then started to rebound. The current gold price is caught in a wide range of fluctuations, with long and short positions frequently alternating to impact the market, making it difficult to form a unilateral trend. At present, the gold price once rebounded to around 3330. If the gold price breaks through the 3336 line, short-term trading in the European market may touch the upper level near 3350, or even the 3365 line. Today's market cannot chase the rise and sell the fall. Overall, it is still a wide range of fluctuations. It should be a violent roller coaster before the subsequent surge. The European session relies on the low point of 3310 to step back as a defense, focusing on the upper 3350-3360, and further close the key resistance of 3370. The short-term focus below is the support of 3280-3290.
If you agree with this view, or have a better idea, please leave a message in the comment area. I look forward to hearing different voices.
OANDA:XAUUSD FX:XAUUSD FXOPEN:XAUUSD FOREXCOM:XAUUSD TVC:GOLD

How long do we have to wait? #XAUUSDTo ensure entry into a sell position, you should wait for the price to close below the red area.

Gold prices face substantial short-term suppression
📌 Bearish drivers
Gold prices (XAU/USD) rebounded from a multi-day low in early Asian trading, and are now at the psychological level of $3,300. Ongoing geopolitical uncertainties, including the Russia-Ukraine conflict, heightened tensions in the Middle East, and renewed frictions on the India-Pakistan border continue to support gold prices. Even so, improved risk sentiment appears to have limited gold's upside due to renewed optimism around the US-UK trade agreement and the launch of US-China tariff negotiations over the weekend.
📊Commentary and analysis
As tariff trade negotiations become more active, gold prices are facing huge selling pressure. Gold prices may return to the 3233 price range and continue to rise.
💰Strategy Package
🔥Sell Gold Zone: 3351-3353 SL 3358
TP1: $3340
TP2: $3330
TP3: $3320
🔥Buy Gold Zone: $3232 - $3234 SL $3227
TP1: $3245
TP2: $3260
TP3: $3270
⭐️ Note: Labaron hopes that traders can properly manage their funds
- Choose the number of lots that matches your funds
- Profit is 4-7% of the fund account
- Stop loss is 1-3% of the fund account

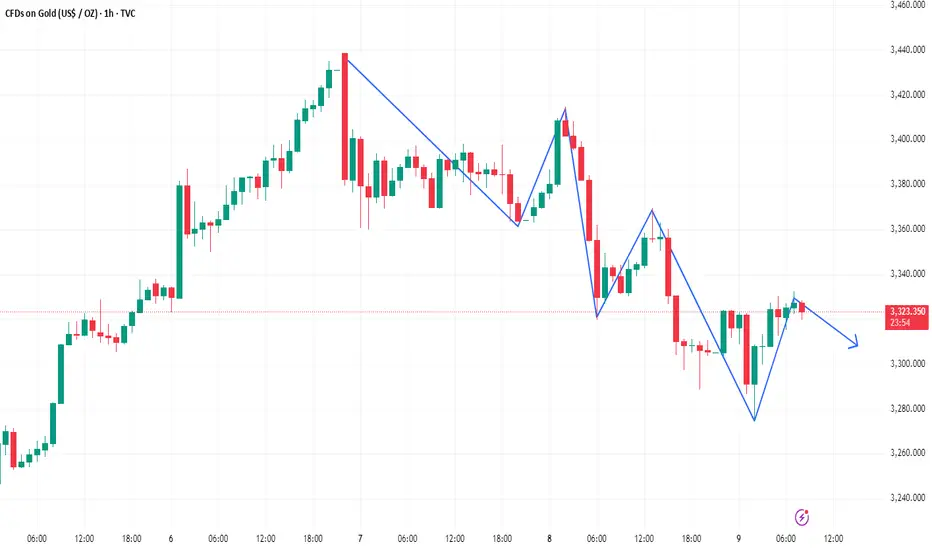
Gold is still in a short-term bearish trendGold's 1-hour moving average continues to turn downward. If it crosses below to form a downward death cross, then gold's room for decline may further open up. The short-term short position of gold has not ended yet. Gold has a trend of falling again. The short-term trend of gold is still short.
Trading ideas: short gold near 3325, stop loss 3340, target 3290
On May 9, London market BTCUSD real-time trading strategy
Yesterday, it was suggested to buy BTCUSD in the range of 98500-99500. The target of 102k achieved a good profit growth.
Regarding BTCUSD, the current demand is also rising sharply. For Trump's call for BTCUSD, while XAUUSD falls back, this is a positive boost. At present, more factors are pushing BTCUSD to continue to rise. You can pay attention to the retracement of the band support of 101500-10200, and the upper side needs to pay attention to 104500-106000
To prevent missing out on some good trading strategies and ideas, remember to continue to pay attention to the ideas of the swing trading center. If you want to get more and more accurate signals, you can leave me a message.

XAUUSD’s precise strategy.After the New York market, XAUUSD has seen some huge declines. 60-70 USD/ounce. Perfect decline.
Regarding the decline mentioned yesterday. These two days have perfectly verified this trading logic, falling from 3438 to 3300. It is completely in line with the analysis expectations. Follow the members and also successfully obtain rich profits.
The two important information mentioned yesterday and today, the interest rate decision and Powell's speech. These are the two bombshells in the current XAUUSD market. After the news landed, there was almost no bigger news to promote the rise in gold prices.
Tariffs were implemented again, reducing market tensions.
Many factors have consolidated the position of the US dollar. It has caused XAUUSD to fall under pressure. At the same time, the demand for the cryptocurrency BTCUSD is greater. Today, the London market clearly pointed out the buying point near 99400. Retreat to 98000 and continue to buy. The New York market rose sharply. The highest reached 101.5k, which also reached the expected range.
If you follow the signal and trade independently. There is profit. It's just a matter of how much. In market trading, you should seize the opportunity when you can accumulate profits. Because opportunities are not always there. So you can follow me to make more lucrative profits with such a good market.

XAUUSD Latest trading opportunities.All profits for five consecutive days of trading. Are you still losing money?
Yesterday, I prompted to sell at a higher position. But today, the Asian market has seen some gains. The highest impact reached 3414, and then fell back by more than 100 US dollars, and the lowest touched 3320. Our high-altitude thinking is completely correct.
It has helped members to make some considerable profits from selling orders.
The market changes a lot. The lag is very strong, mainly because the good news is suppressed, leading to the trend of bad news. This is an aspect that needs to be focused on when trading. The market situation better proves the accuracy of my swing trading strategy.
The current price is at 3345. We need to pay attention to the pressure of the 3362-3355 range and the support of 3300. The trading is still mainly selling.
To prevent missing out on some good trading strategies and ideas, remember to continue to pay attention to the ideas of the swing trading center. If you want to get more and more accurate signals, you can leave me a message.
