XAUUSD's next trading trendPowell's meeting is over. Powell's response was very decisive. It is difficult to do it in the short term about interest rate cuts. Therefore, through the content of the meeting, we pay attention to the fact that there is still some pressure on the rise of xauusd. In terms of economic data, the foundation of the US dollar is still strong. The market is still under pressure in terms of operations. At present, we need to pay attention to whether geopolitics will give some upward momentum in the XAUUSD market. Although I don't want to see a turbulent pattern, you need to pay attention to these influencing factors when you trade.
About today's idea of selling xauusd. It has been announced in advance in the London market. If you don't pay attention to the core content of the band trading center. Then you will definitely miss some good transactions. This is for sure. So in order to avoid missing some good trading plans next time. You can follow me.
Continue the selling trading strategy. 3382-3387 can be paid attention to as a short-term selling position. Those with larger funds can rely on the current price of 3374. Sell
Remember to control risks when trading.
Xauusdsell

Real-time analysis of the XAUUSD market.The current volatile trend is to give room for adjustment for the interest rate decision and the Fed's speech later.
If the interest rate is expected to remain unchanged or increase, it will boost the US dollar index. This will suppress the xauusd market. It will be bearish and fall. If the interest rate is cut, it will boost XAUUSD. But I think the market will not raise interest rates at this stage. The probability of a rate cut is also very low. So maintaining the same interest rate is the first choice.
In terms of trading, traders with large amounts of capital can sell at 3385 at the current price, while traders with small amounts of capital can wait until the market returns above 3400 before selling.
The Swing Trading Center continuously updates new real-time trading opportunities. If you don't understand trading, or don't want to miss the next real-time trading opportunity, remember to follow me.

Strong support at 3360; future trend analysis belowI mentioned yesterday that gold was accumulating bullish momentum to challenge the 3400 level at that time 📈. If the challenge failed, it would drop sharply 📉, and if it succeeded, it would continue to rise. That's why I advised you not to trade at that moment, as it was easy to choose the wrong direction and have your account wiped out 💥.
Currently, the international geopolitical situation has suddenly heated up 🌋, and the market's risk - aversion sentiment has once again pushed up the gold price 📈. However, tonight's Federal Reserve interest rate decision and Jerome Powell's speech will be key nodes in the battle between bulls and bears ⚔️. The sharp fluctuations in gold this morning conform to the characteristics of a washout 🌀. But be wary of a significant pullback after the continuous slow rise 🚨.
In terms of operation, it is recommended that investors avoid blindly chasing the upward trend and focus on the impact of the Fed's decision on real interest rates and the US dollar 👀. Currently, the resistance above is at 3397 - 3407, and the strong support level of 3360 has been tested twice today, showing a double V bottom pattern📊.
⚡️⚡️⚡️ XAUUSD ⚡️⚡️⚡️
🚀 Buy@3360
🚀 TP 3380 - 3390
Accurate signals are updated every day 📈 If you encounter any problems during trading, these signals can serve as your reliable guide 🧭 Feel free to refer to them! I sincerely hope they'll be of great help to you 🌟 👇

Interest rates, will gold prices fall sharply today?⭐️GOLDEN INFORMATION:
However, US Dollar bulls appear cautious, holding back from making bold moves as they await clearer signals regarding the Federal Reserve’s (Fed) future rate-cut trajectory. This wait-and-see stance, combined with ongoing geopolitical tensions—particularly the prolonged Russia-Ukraine conflict and unrest in the Middle East—continues to bolster demand for safe-haven assets like gold. As such, investors are likely to remain on the sidelines until the conclusion of the closely watched two-day FOMC policy meeting on Wednesday.
⭐️Personal comments NOVA:
Gold price awaits today's interest rate result, there was a good recovery above 3400 but then fell immediately after, showing that the market is not ready for the first interest rate cut if any, gold price may face strong selling pressure today
⭐️SET UP GOLD PRICE:
🔥SELL GOLD zone : 3438- 3440 SL 3445
TP1: $3425
TP2: $3410
TP3: $3395
🔥SELL GOLD zone : 3396- 3398 SL 3402 scalping
TP1: $3390
TP2: $3380
TP3: $3365
🔥BUY GOLD zone: $3308 - $3306 SL $3301
TP1: $3315
TP2: $3330
TP3: $3345
⭐️Technical analysis:
Based on technical indicators EMA 34, EMA89 and support resistance areas to set up a reasonable sell order.
⭐️NOTE:
Note: Nova wishes traders to manage their capital well
- take the number of lots that match your capital
- Takeprofit equal to 4-6% of capital account
- Stoplose equal to 2-3% of capital account

Gold fluctuates, long and short operations in the US market!
📊Comment analysis
At 14:00 on Wednesday, US time, Fed Chairman Powell will hold a monetary policy press conference.
The market generally expects that the FOMC will continue to remain on hold at this meeting, as the impact of tariff policies on inflation and the economy remains to be seen; the Fed may cut interest rates in June. Since this interest rate decision does not update economic forecasts, the focus will be on the Fed's accompanying comments on any signals of future interest rate cuts to support the economy. Since the decision to keep interest rates unchanged has been fully digested by the market, Powell's tone at the press conference will be the key to changing the market's expectations for interest rate cuts this year.
💰Strategy package
The US market is expected to remain volatile, and both long and short positions have opportunities. You only need to operate at a certain point. Go long on a short-term retracement to 3378 support, and go short when it reaches the upper resistance of 3408.
⭐️ Note: Labaron hopes that traders can properly manage their funds
- Choose a lot size that matches your funds
- Profit is 4-7% of the capital account
- Stop loss is 1-3% of the capital account

Gold is under pressure at 3400, with a short-term decline expectGold is under pressure around 3400. Today we will have the Fed's interest rate decision and Powell's speech. If gold is under pressure at 3400, it is expected to fall. Before the data, we need to be cautious.
In terms of trading ideas, we can short short-term, pay attention to the short near 3393-96, stop loss 3403, take profit 3360/3350

Breaking news is coming! How to trade XAUUSD/GOLD?XAUUSD/GOLD continued to fluctuate and rise in the New York market yesterday. It closed at around 3430, and today the Asian market opened at a high of 3438.75. For those who followed the buying yesterday, this profit is quite generous. The interest rate decision is about to be announced, how should we trade?
Two key points need to be paid attention to, namely: the continued fermentation of geopolitics, and the Federal Reserve interest rate decision in the New York time period.
The geopolitical fermentation has eased since the Asian market began, and there is no greater news to provide momentum for the rise, so there has been a sharp drop after the opening, and the lowest reached around 3359. The decline is about 80 US dollars/ounce. The subsequent shock rebounded slightly, and the current quotation is 3387. From the trend observation, there is still an opportunity to buy on the left side of the swing trading.
The interest rate decision mentioned yesterday can be further divided into two results: unchanged interest rate and interest rate cut. The result of unchanged interest rate is that the US dollar index still maintains its value, and there is a suppression on XAUUSD/GOLD. At this time, we need to pay attention to which has a greater impact on geopolitics and the preservation of the US dollar index. The former is good for the rise of XAUUSD/GOLD. The latter has an impact on the decline of xauusd/gold. Secondly, the interest rate cut is good for xauusd/gold. If it is the latter, then it is better to do more at the same frequency.
Therefore, the trading logic is still mainly based on low-level longs. Members with larger funds can choose to buy near the current price of 3392. Members with smaller funds can pay attention to buying opportunities below 3375.
Pay attention to risk control when trading.

Crazy trading opportunity. XAUUSD/goldSupplement the deficiencies in the previous article.
News from the New York market once again stimulated the rise of XAUUSD/gold, which is a sustained rise. Data news once again ignited the XAUUSD market, and the swing trading target is 3440. The current price is 3410, and there is still about 30 US dollars/ounce of fluctuation space for trading.
For details, please pay attention to the real-time trading opportunities announced by the swing trading center later.

New York market XAUUSD trading opportunities.The 3400 position has been broken. Short-term bulls are still strong. The swing buying we executed all day today has made continuous profits. Such one-sided market conditions in trading have good profits. But the premise needs to be executed. This requires execution and courage.
Teacher Ludvig pointed out that the probability of reaching the target 3440 before tomorrow's London market is more than 90.36%. So this is a good buying opportunity for traders who don't know how to trade now.
The precise trading points are released in the Swing Trading Center. If you don't know what to trade now. Then you can refer to it.
Control trading risks according to the capital situation when trading.

XAUUSD trading opportunities.6/5/2025The increase in uncertainty also caused the XAUUSD trend to continue to strengthen. The target position of 3330-3350 set yesterday is the short-term pressure position. In the Asian market, XAUUSD/GOLD hit the recent high again. After reaching 3387, it fell back. The current price is 3350. According to the momentum chart, the market is in a stage of bullish growth. Risk aversion has increased, which has led to more buying than selling.
In terms of trading, traders with large amounts of funds can buy at the current price, and those with small amounts of funds can wait until the market retreats below 3330 before choosing to join again.
The Swing Trading Center continues to update new real-time trading opportunities. If you don't know how to trade, or don't want to miss the next real-time trading opportunity, remember to follow me.

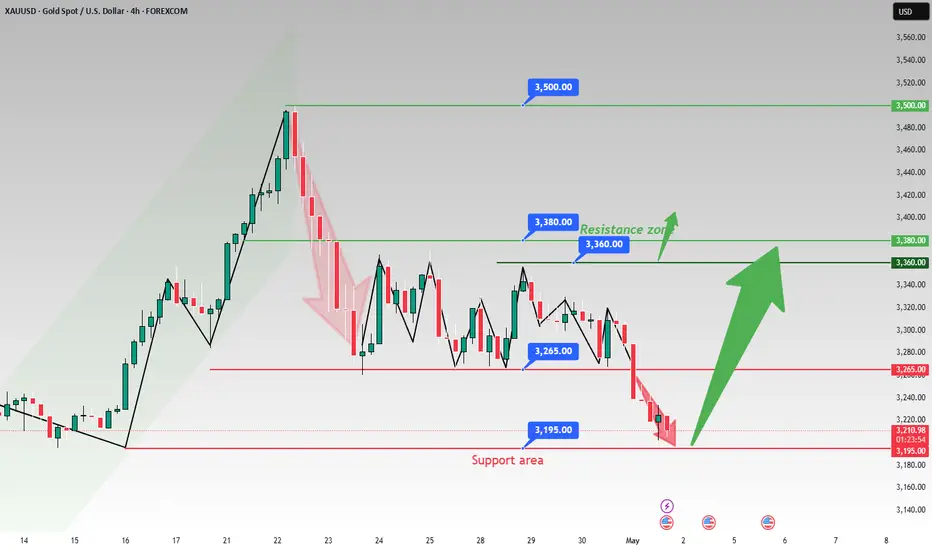
XAUUSD 3265: Bull-Bear Lifeline! Next Week's Trend PredictionFrom a daily chart perspective, overnight, the price of gold rebounded after hitting the bottom and closed with a bullish candlestick 🌞. However, on the 1-hour chart, the moving averages of gold have formed a bearish crossover pattern and are arranged in a downward trend for bears 📉. Moreover, this pattern will eventually continue to diverge downward. Currently, the price of gold has been suppressed and pulled back near the level of 3265 ⚠️. It can be seen from this that the area around 3265 will still be a crucial turning point determining the bull-bear trend of the gold price next week ⚡. Join 👉
In the latter part of the night, although the price of gold rebounded to some extent, compared with the previous decline range, the rebound strength is indeed limited 📉↗️. Looking ahead to next week, if the gold price fails to break through the resistance near 3265, then the market will most likely only maintain a volatile pattern at best, and it is less likely for the bulls in the gold market to achieve a direct reversal in the short term 📊. Investors should focus on the resistance at 3265 above and the strong support at the key level of 3195 below 🔍.
Join 👉
Accurate signals are updated every day 📈 If you encounter any problems during trading, these signals can serve as your reliable guide 🧭 Feel free to refer to them! I sincerely hope they'll be of great help to you 🌟 👇

Swing Trading/XAUUSDband trading strategy points out. XAUUSD can be bought on the left side, TP3330-3350.
Aggressive traders can buy at the current price. Conservative traders can wait until the price retreats to around 3300 or below before buying.
The Swing Trading Strategy Center continues to announce trading opportunities. Stay tuned.

GOLD Technical Analysis - Deeper Pullback in PlayOANDA:XAUUSD remains within a broader ascending channel, but recent price action suggests that the market is undergoing a deeper corrective phase. Following a prolonged bullish rally, price appears overextended and is now pulling back more decisively.
This correction aligns with expectations for a healthy retracement after such strong upward momentum. I anticipate that the pullback will extend further toward the $3,160 level, a key technical level defined by the confluence of horizontal support, ascending trendline support, and the 0.618 Fibonacci retracement of the latest bullish impulse.
This zone will be critical for determining whether the broader bullish structure remains intact. If price holds at this level and shows signs of reversal, it may present a strong re-entry opportunity for buyers. However, a decisive break below this zone would invalidate the current bullish structure and open the door to a deeper correction.
Always confirm your setups and trade with a proper risk management.
Best of luck!

Continue to short gold when it rebounds to a high level
The 1-hour moving average of gold continues to form a downward short position, and there is still room for gold shorts. Gold came under pressure at the 3270 line last week and fell back. Currently, the 1-hour gold is still fluctuating within a range. It is still mainly short above the rebound of gold.
Trading ideas: Short gold near 3270, stop loss 3280, target 3240

XAUUSD Analysis todayHello traders, this is a complete multiple timeframe analysis of this pair. We see could find significant trading opportunities as per analysis upon price action confirmation we may take this trade. Smash the like button if you find value in this analysis and drop a comment if you have any questions or let me know which pair to cover in my next analysis.

The decisive battle day of major data (XAUUSD/GOLD)
Yesterday, it was clearly pointed out that the pressure position after the rebound is 3255-3270. Today, due to the oversold influence of XAUUSD, it rebounded to a high of 3258. In terms of operation, it is still mainly chosen to sell. Today is the "third day" deadline. If the impact of geopolitics continues to be suspended. It is expected that XAUUSD will fall by $100/ounce today.
There have been some oversold rebounds in the Asian market XAUUSD. Beware of the market's inducement to buy more. So 3260-3270 continues to be mainly sold.
TP1 3230-3220.
TP2 3170-3160

5/2 Gold Trading SignalsI'm very sorry that today's update is a little late because I'm traveling during the holiday. However, I have already told you about the trading strategy yesterday. The market changes are still in line with our expectations. Following the signal of selling in the 3260-3280 range, the returns should be good.
Gold is now falling back. There is support near 3200, but the bears are strong at present, so it is still mainly selling. This decline is expected to fall below 3200, but because of the support, the possibility of a direct break is not very high. If it falls directly, there will definitely be at least one small rebound, roughly around 3210.
So the transaction can be carried out like this:
Buy in the 3194-3185 range
Sell in the 3246-3258 range

NFP market, looking for opportunities to short goldFundamentals:
Mainly focus on today's NFP market;
Technical aspects:
Gold rebounded near 3200 and has gradually rebounded to around 3265. This wave of rebound is not surprising. After all, I have been insisting on short-term long gold since yesterday, and I have also gained a good profit. As gold falls and breaks through many key supports, my expectations for the magnitude of this rebound are not high. In the short term, it will first face resistance in the 3270-3275 area, and secondly, it will face resistance in the 3285-3295 area.
Moreover, the rebound and rise of gold before the NFP market is very confusing in itself. It is not ruled out that it is to pave the way for the sharp drop in the NFP market. Once gold falls again, it is likely to fall below 3200 and continue to around 3180.
Trading strategy:
1. Consider shorting gold when it rebounds to 3270-3280, TP: 3240-3230;
2. Consider continuing to short gold when it rebounds to 3280-3290, TP is the same as above.

XAUUSD Potentially ShortOANDA:XAUUSD Retesting the broken support of the consolidation phase, a close below that area will signify a shorting opportunity.
Fingers crossed

NF shows a volatile downward trend
📌 Gold Information
China's Ministry of Commerce announced on Friday that the United States has recently initiated communication through official channels, expressing interest in restarting tariff negotiations. Beijing is currently evaluating the proposal, which has sparked optimism that a solution to the long-standing tariff deadlock between the world's two largest economies is imminent.
New hopes for a breakthrough in trade negotiations helped the dollar rise to a three-week high on Thursday, pushing gold prices down towards the $3,200 mark. However, the dollar's bullish momentum remains weakened as the market increasingly digests expectations that the Federal Reserve may cut interest rates further, especially with the closely watched US non-farm payrolls data about to be released.
📊Comment Analysis
NF news volatility is certain, having accumulated significantly since last week. Gold price confirmed the trend after breaking through 3267, and fluctuated downward below 3200
💰Strategy Package
TP1: $3290
TP2: $3280
TP3: $3270🔥
Buy gold area: $3175 - $3177 SL $3170
TP1: $3185
TP2: $3200
TP3: $3210⭐️
⭐️ Note: Labaron hopes that traders can properly manage their funds
- Choose the number of lots that matches your funds
- Profit is 4-7% of the fund account
- Stop loss is 1-3% of the fund account

Gold Trends and Analysis Before NFP Release📰 Analysis of Gold's News Background 👉 Join in
During the US trading session on Thursday (May 1st), spot gold continued its downward trend, hovering around $3,216.55 per ounce, with a decline of approximately 0.4%. It had already fallen for two consecutive days before that. On Wednesday, it even reached $3,267.07, getting close to the key support level of $3,265, which was set last week. The market's bull-bear tug-of-war stems from the divergence in expectations of the Federal Reserve's policies: The weak US economic data has boosted the expectation of an interest rate cut, but the rebound of the US dollar index and US Treasury yields has suppressed the safe-haven nature of gold.
⚠️ Key Focuses for the Day 👉 Join in
Pay attention to the Bank of Japan's monetary policy decision, the data on job cuts by US enterprises in April, the final value of the manufacturing PMI, and the number of initial jobless claims. Also, keep an eye on geopolitical and trade dynamics!
📈 Quick Look at the Technical Analysis of Gold
On the eve of the Nonfarm Payrolls report, how should we choose between going long and short on gold?
🔹 Daily Chart: Closed lower with a medium-sized bearish candlestick. In the early trading session, it broke below the key support level of $3,265, confirming the end of the Wave B rebound and the start of the Wave C decline. Continue with the strategy of "going short on rebounds".
🔹 4-Hour Chart: The downward space was broken open, and the bears are in control after the top-bottom conversion.
🔹 1-Hour Chart: The moving averages formed a bearish crossover, and the gold price broke below the previous low. When it rebounds to the densely traded area near $3,265, go short without hesitation! 💥
⚡️⚡️⚡️ XAUUSD ⚡️⚡️⚡️
🚀 Sell@3230 - 3220
🚀 TP 3210 - 3200
Accurate signals are updated every day 📈 If you encounter any problems during trading, these signals can serve as your reliable guide 🧭 Feel free to refer to them! I sincerely hope they'll be of great help to you 🌟 👇
XAUUSD is expected to fall further.After a night of trend changes, XAUUSD has reached 3225. This is consistent with my prediction this week, and the direction is also consistent. In terms of operations, most of the orders are short-selling. This allows us to seize the opportunity to make money by shorting XAUUSD in the market.
BTCUSD also successfully reached 95,000 after a small correction, which is very critical for buying at a low level to make a profit.
The three-year-long Russian-Ukrainian situation may end
If this "farce" is declared over, XAUUSD will fall at a faster rate. Currently in a downward trend, XAUUSD needs to focus on the opportunity to sell after the rebound. 3273-3255. The target is 3200 first. If it breaks through sharply, it can be considered to reach 3170. There are risks in trading. Remember to proceed with caution.
If you don't know how to trade. Follow me.

The most fundamental trading logic of XAUUSD.From the trend of XAUUSD, it is still mainly selling.
Trading logic, the current geopolitical situation has eased, which is the biggest negative news for xauusd. Tariffs have eased.
In other words, selling pressure exceeds demand.
So continue to sell at the current price of 3230-3220. The target is below 3200.
Always remind trading risks. So don't ignore this. If you don't know how to trade. Remember to wait and see. Don't trade blindly or gamble.
Many investor friends know that I have led some investors to create good profits for several consecutive days. If you don't know how to trade, remember to leave me a message and try it. Maybe your profit will double.
