Interest rates unchanged, sticking to my bearish idea.Look at my other posts and you''ll understand as to why, I was telling everyone to sell. There was a small sellers trap, we pushed up, at that moment I already had closed my positions. Now we go down to the other key levels. I'm done till the end of August. Will still post my setups, but won't take any trades. Stay safe and keep your funds safe. Hella Love!
Xauusdsell

GOLD Bearish Breakout!
HI,Traders !
#GOLD is trading in a strong
Downtrend and the pair
Broke the key horizontal
Level around 3318.97 which
Reinforces our bearish
Bias and we will be
Expecting a further
Bearish move down !
Comment and subscribe to help us grow !

Gold: ADP, Fed & Key Resistance Gold has been range-bound today—let’s focus on the impact of the ADP data and Fed rate decision ⚠️.
Key resistance lies around 3345-3350 📍: a breakout could fuel further upside 📈, while a rejection may trigger an oscillating pullback 📉
⚡️⚡️⚡️ XAUUSD ⚡️⚡️⚡️
🚀 Buy@ 3325
🚀 TP 3333 - 3339 -3344
Daily updates bring you precise trading signals 📊 When you hit a snag in trading, these signals stand as your trustworthy compass 🧭 Don’t hesitate to take a look—sincerely hoping they’ll be a huge help to you 🌟 👇

Is the market panicking over FOMC today?⭐️GOLDEN INFORMATION:
Gold (XAU/USD) fluctuates within a narrow range during the Asian session on Wednesday, showing only modest gains and losses as traders tread carefully ahead of the Federal Reserve’s policy announcement. The metal’s recent rebound from the $3,300 area faces hesitation, with investors awaiting clearer signals on the Fed’s rate-cut trajectory before committing to new positions. As such, attention remains firmly on the outcome of the two-day FOMC meeting, set to be released later today.
In the meantime, pre-Fed uncertainty is lending some support to the safe-haven appeal of gold. Additionally, a slight pullback in the U.S. Dollar—after hitting its highest level since June 23 on Tuesday—is providing a mild lift to the metal. However, expectations that the Fed will maintain elevated interest rates for an extended period are limiting the dollar’s decline and capping upside potential for the non-yielding yellow metal. Adding to the cautious mood, recent optimism on global trade also tempers bullish momentum in XAU/USD.
⭐️Personal comments NOVA:
slight recovery, not big before FOMC news. Gold price will still be under selling pressure when interest rate stays at 3300
⭐️SET UP GOLD PRICE:
🔥SELL GOLD zone: 3373- 3375 SL 3380
TP1: $3360
TP2: $3344
TP3: $3330
🔥BUY GOLD zone: $3283-$3281 SL $3276
TP1: $3295
TP2: $3307
TP3: $3320
⭐️Technical analysis:
Based on technical indicators EMA 34, EMA89 and support resistance areas to set up a reasonable SELL order.
⭐️NOTE:
Note: Nova wishes traders to manage their capital well
- take the number of lots that match your capital
- Takeprofit equal to 4-6% of capital account
- Stoplose equal to 2-3% of capital account

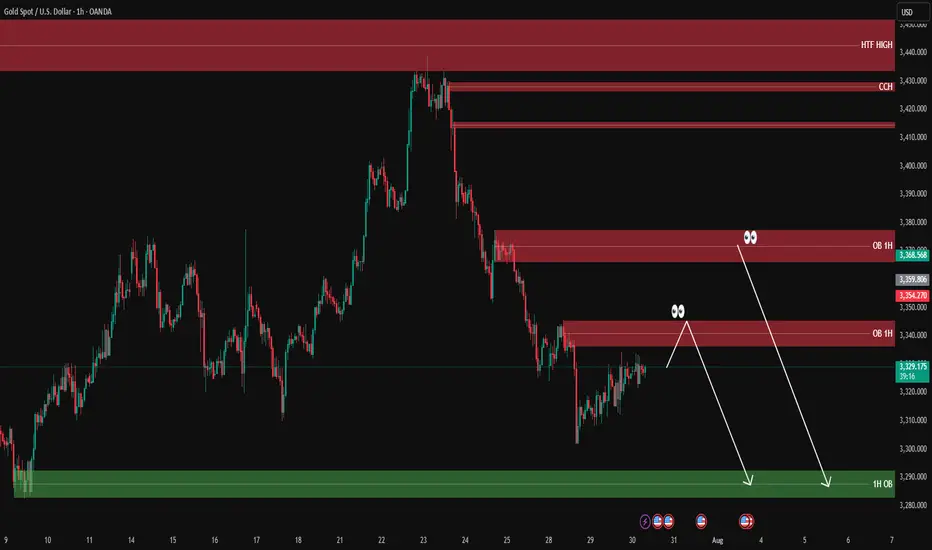
XAUUSD analysis - 1H FVG and OB setupsOn the 1H timeframe, price is currently approaching two key supply zones (OB 1H):
🔴 First OB zone: around 3354 – 3360
🔴 Second OB zone: around 3368 – 3370
We're watching these zones for potential short setups, only with confirmation on the lower timeframes (5M or 3M).
If price reacts to one of these OBs, we expect a move down toward the green 1H demand zone around 3280 – 3290, where a long setup may later form.
📌 Key scenarios:
1️⃣ Price hits the first OB → confirmation → short
2️⃣ Price moves to the second OB → confirmation → short
3️⃣ Target for both setups = green OB around 3280
4️⃣ No entry without confirmation from LTF
❗️ Do NOT enter without lower timeframe confirmation.
7/30: Watch for Sell Opportunities in the 3352–3363 ZoneGood morning, everyone!
After a period of consolidation and decline, gold has found preliminary support near the 3300 level, and early signs of a bottom formation are emerging. The key technical level now lies around the 3332–3337 resistance zone. Based on current price structure, a breakout is likely, with major resistance seen at 3352–3358, while 3323–3316 serves as the primary support range.
However, caution is warranted as today’s ADP employment data may significantly influence short-term price action. Whether gold can hold above the 3337–3343 level depends on the data's impact.
From a broader perspective:
On the weekly chart, the 20-period moving average (MA20) has climbed to around 3276, yet the overall structure remains bearish for bulls
On the daily chart, gold is still trading below the MA60, facing notable resistance
This week's key events — ADP (Wednesday), jobless claims, and NFP (Thursday and Friday) — will likely shape gold’s medium-term trend
Trading Strategy for Today:
Focus on the 3313–3353 trading range, and be highly responsive to data-driven volatility.
Important note: If gold rises to 3343–3358 before the ADP release, then regardless of whether the data is bullish or bearish, the preferred approach is to sell into strength, as a post-data pullback is a likely scenario.

XAUUSD DEVELOPS MID-TERM BEARISH IMPULSEXAUUSD DEVELOPS MID-TERM BEARISH IMPULSE
Yesterday was the 4th bearish day in a row for gold. The reasons are the same as for the EURUSD: American-European trade agreement. Geopolitical risks got eliminated and market participants get rid of the bullion. "If more ‘trade deals’ are reached, this could help to reduce this source of policy uncertainty that has weighed against the dollar, at least for now. It could also see other factors such as relative yields becoming more influential," said Paul Mackel, global head of FX research at HSBC.
Technically, the price has broke down the former trendline and is currently staying slightly above the local support of 3,300.00. It is expected for rebound to continue, retest of the trendline is possible with further decline towards 3,200.00 support level.

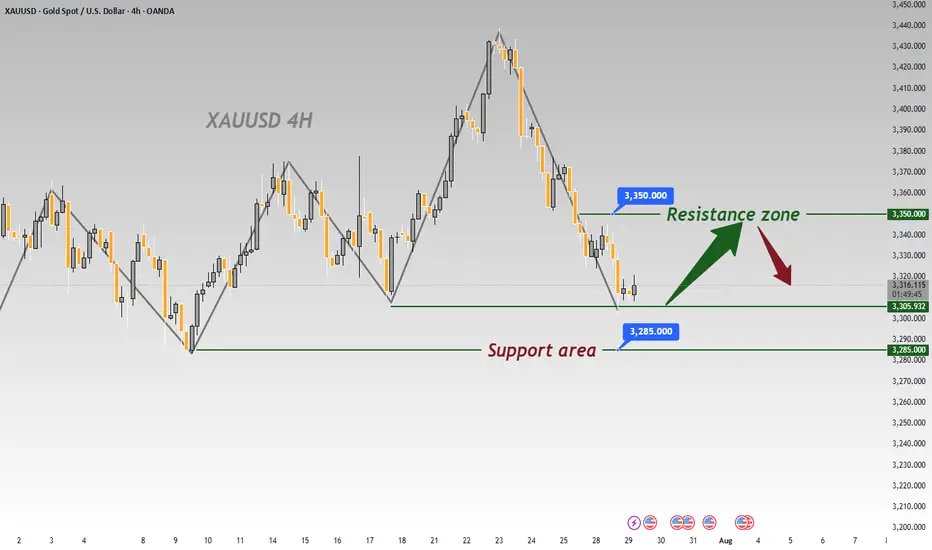
Gold: This Week's Analysis & StrategyThis week, the fluctuations have clearly moderated📉. Focus on a strategy of buying at lows and selling at highs as much as possible📈. Currently, the resistance around 3350 is prominent🚧, and 3300 acts as support below🛡️. If the decline continues, it may reach around 3285👇
We successfully took short positions last week 📉, and this week I recommend going long at lower levels 📈. Over the long term, gold remains in a bull market 🐂, but it will not repeat the frenzy seen in April; instead, it will maintain a steady upward pace ⬆️.
Market expectations for Fed rate cuts have been volatile so far this year 📊. At the start of the year, as Trump-related developments unfolded, market optimism faded 😐. Meanwhile, the de-dollarization trend fueled growing expectations of Fed rate cuts 💹. By early April, Trump’s reciprocal tariff measures—far more aggressive than expected—roiled global financial markets 🌍, triggering a surge in concerns about a U.S. recession ⚠️. Markets thus anticipated that the Fed would cut rates quickly to shore up the economy, with expectations for rate cuts within the year once exceeding 100 basis points 📉. However, shortly after, Trump announced a 90-day extension of the reciprocal tariffs, easing market pessimism 😌 and driving a strong rebound in U.S. stocks 📈. At this point, markets began worrying that his tariff policies could spark an inflation rebound 🔥, leading to a steady decline in rate cut expectations—currently, expectations for rate cuts this year have dropped to fewer than two 🔄.
Risk Warning ⚠️
Event Sensitivity: Outcomes of China-U.S. trade talks 🤝, the Fed’s statements , and nonfarm payroll data 📊 may trigger one-sided volatility. Positions should be adjusted promptly to avoid risks 🛡️
⚡️⚡️⚡️ XAUUSD ⚡️⚡️⚡️
🚀 Buy@ 3300 -3310
🚀 TP 3320 - 3330 - 3340
🚀 Sell@ 3350 -3340
🚀 TP 3330 - 3320 - 3310
Daily updates bring you precise trading signals 📊 When you hit a snag in trading, these signals stand as your trustworthy compass 🧭 Don’t hesitate to take a look—sincerely hoping they’ll be a huge help to you 🌟 👇
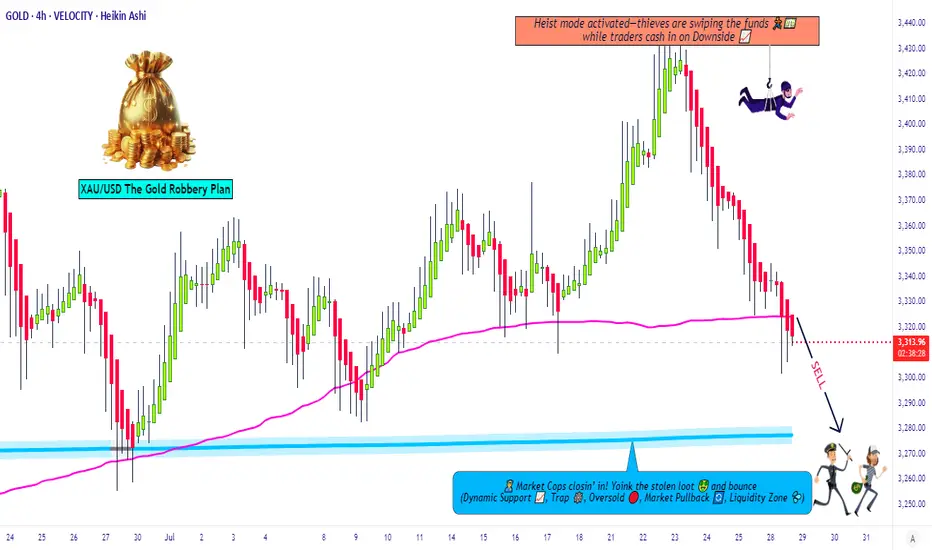
Gold Robbery Blueprint: Smart Bears on the Move Now!💣 XAU/USD GOLD HEIST PLAN: Robbery Begins at Resistance Zone! 🔐💰
🌟Hi! Hola! Ola! Bonjour! Hallo! Marhaba!🌟
Dear Money Makers & Market Robbers, 🕵️♂️💸🚀
Welcome to another strategic strike by Thief Trading Style™—where smart analysis meets bold execution. We're targeting XAU/USD (Gold) in this scalping/day-trade opportunity, primed with fundamentals, technicals, and pure robbery logic.
🔍 THE GAME PLAN
We're looking at a neutral zone turning bearish, and here’s how the robbery unfolds:
🔑 ENTRY POINTS
🎯 “Vault wide open” signal!
Initiate short orders at current price zones or set layered SELL LIMITS near swing highs on 15M/30M charts. We're running a DCA-style pullback entry for max loot.
🕵️♀️ Entry isn't about one shot—it's about precision raids.
🛑 STOP LOSS: THE ALARM SYSTEM
Set SL just above the nearest swing high (4H timeframe preferred).
Use candle wick tips as your defense line (Example: 3350.00).
Adjust SL based on risk appetite and number of orders stacked.
🎯 TARGET: THE GETAWAY PLAN
💸 First Vault: 3280.00
💨 Or escape earlier if price action signals reversal. Protect your gains. Professional thieves don't get greedy.
📊 WHY WE’RE ROBBING HERE
This level is a high-risk barricade zone—police aka "market makers" are strong here.
We spotted consolidation, oversold signals, trend reversal setups, and a bullish trap disguised as support. A perfect time to strike. 🧠🔍
📰 FUNDAMENTAL & SENTIMENTAL CHECKPOINTS
🔎 Stay updated with:
Global news drivers
Macro & Intermarket analysis
COT reports & future trend targets
👉 Check the 🔗🔗🔗
⚠️ TRADING ALERT - STAY SAFE DURING NEWS BOMBS!
Avoid entries during major economic data releases.
Use trailing SL to protect running profits.
Monitor volatility spikes & price anomalies.
💖 JOIN THE CREW, BOOST THE HEIST!
If this plan adds value to your trades, hit that Boost Button 💥
Support the Robberhood and help grow the gang of smart money snipers 🕶️💼💣
Every boost = more ammo for next mission. Let's rob the market—not each other. 🚀🤑
📌 Remember: Market is fluid. Stay sharp, adapt quick, and trade like a shadow.
Catch you soon in the next grand heist 🎭💼
#XAUUSD #GoldTrade #ScalpingStrategy #DayTrading #ThiefTrader #RobTheMarket #BoostForMore #NoChaseNoCase
Market forecasts are completely accurate, trading signals#XAUUSD
After opening today, gold tested the lowest point near 3324 and then rebounded, which is in line with my prediction of gold trend last night. Next, we need to pay attention to whether the upper 3345-3350 constitutes a short-term pressure level. If you are aggressive, you can consider shorting at 3345-3350, with the target at 3330-3325. Continue to hold if it falls below 3325, and stop loss if it breaks above 3350. After it breaks above, you can consider following up with a long order to close the position at 3360-3370. Short once at 3370-3380 for the first time, and stop loss if it breaks above 3380.
🚀 SELL 3345-3350
🚀 TP 3330-3325
🚀 BUY 3352-3355
🚀 TP 3360-3370
🚀 SELL 3370-3380
🚀 TP 3345-3325-3310
Be sure to study my trading strategy carefully. If you only look at the price points, you will definitely suffer certain losses. Participate in the transaction at the right time based on your own account funds and set stop losses.

XAUUSD BearishGold, Price have been moving side-ways taking out internal highs & lows inside PREMIUM, now we have clean lows that are still intact with equal lows near equilibrium. I would like to see price dropping low to take out liquidity resting below those previous lows and drop into DISCOUNT.

GOLD Melted , 2 Best Places To Sell Clear , Don`t Miss 200 Pips Here is My 30 Mins Gold Chart , and here is my opinion , we Again Below 3377.00 and we have a 30 Mins Candle closure below this strong res , so i`m waiting the price to go back and retest this res and new support and give me a good bearish price action to can enter a sell trade and we can targeting 200 pips , and we have a good res @ 3365.00 we can sell from it also if the price didn`t reach 3377.00 and targeting from 100:200 pips , and if we have a Daily Closure below This res this will increase the reasons for us , just wait the price to back a little to retest it and then we can sell it . if we have a daily closure aboveit this idea will not be valid anymore .

GOLD SELLGold price bears retain control amid fading safe-haven demand, rebounding USD
US President Donald Trump announced late Tuesday that his administration had reached a trade deal with Japan. Furthermore, reports that the US and the European Union are heading towards a 15% trade deal boost investors' confidence and weigh on the safe-haven Gold price for the second straight day on Thursday.
The markets do not expect an interest rate cut from the US Federal Reserve in July despite Trump's continuous push for lower borrowing costs. In fact, Trump has been attacking Fed Chair Jerome Powell personally over his stance on holding rates and repeatedly calling for the central bank chief's resignation.
Moreover, Fed Governor Chris Waller and Trump appointee Vice Chair for Supervision Michelle Bowman have advocated a rate reduction as soon as the next policy meeting on July 30. This keeps the US Dollar depressed near a two-and-a-half-week low and could offer some support to the non-yielding yellow metal.
Traders now look forward to the release of flash PMIs, which would provide a fresh insight into the global economic health and influence the safe-haven commodity. Apart from this, the crucial European Central Bank policy decision might infuse some volatility in the markets and drive the XAU/USD pair.
Meanwhile, the US economic docket features Weekly Initial Jobless Claims and New Home Sales data, which, in turn, would drive the USD and contribute to producing short-term trading opportunities around the commodity. Nevertheless, the fundamental backdrop warrants caution for aggressive traders.
SUPPORT 3,346
SUPPORT 3,322
SUPPORT 3,399
RESISTANCE 3,394
RESISTANCE 3,379
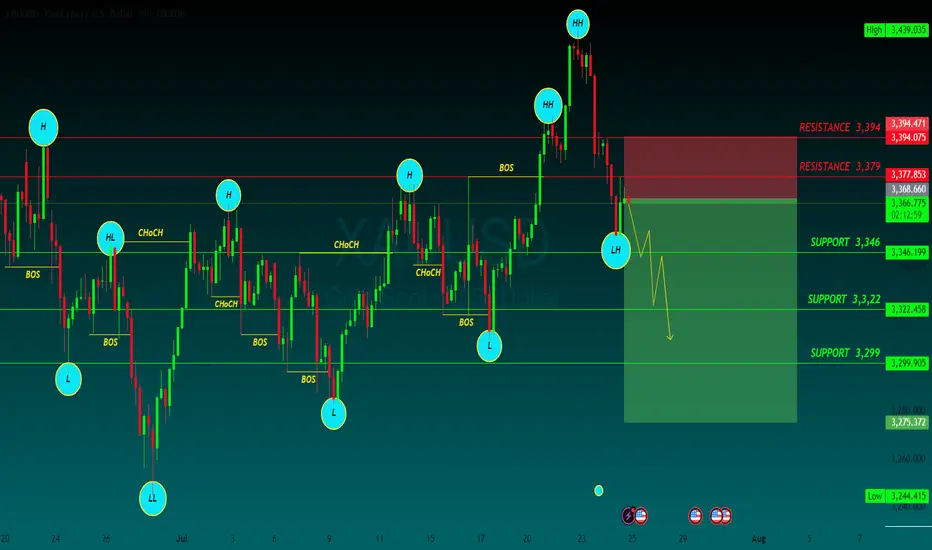
7/25: Key Levels to Watch Closely for Next Week's TradingGood evening, everyone!
Due to health reasons, I had to take a short break from updates — thank you all for your understanding and support.
This week, gold rallied to the 3440 level, forming a double-top pattern, and has since entered a phase of consolidation with a downward bias, currently retracing back to the key 3337-332 support area.
While a short-term rebound is possible from the 30-minute chart perspective, the weekly structure is not favorable to the bulls. On the daily chart, price has once again reached the MA60 support, and is currently forming three consecutive bearish candles, which suggests that bearish momentum may continue.
Unless there is significant bullish news next week, the market may remain under pressure. Key levels to monitor:
Upside resistance zones: 3343, 3352, 3358, 3366, 3372, 3378, and 3386–3392
Downside support zones: 3337, 3332, 3323, 3312
If the weekly chart breaks down, watch for: 3300 psychological level and 3260 (weekly MA20)
Additionally, during this week's decline, a price gap has been left between 3395–3398. If the market starts to rebound on the 2-hour chart, there is a chance this gap will be filled. However, this area also serves as strong resistance, and any approach toward it could result in heavy selling pressure. Caution is advised in the event of a sharp rally.
I'm still recovering and unable to monitor the markets for extended periods. Once my health improves, I’ll resume regular updates. In the meantime, feel free to leave any questions, and I’ll do my best to respond. Thanks again for your continued support, and I wish everyone success and strong profits in the market!
The callback is coming to an end, don't chase the short easily#XAUUSD
The long positions held last night have already left the market at a loss😔. After the Asian session opened, I continued to watch the trend of gold, but it did not effectively rebound to the ideal target area. After repeatedly testing around 3393, I chose to manually exit the market📀.
Gold is currently somewhat overcorrected, with the hourly line falling into severe oversold territory📉. But the market will eventually return to the bullish trend🐂. Why do I say that? First, there are less than 8 days left before the final deadline for tariffs. Second, the Federal Reserve’s interest rate cut is also approaching. In the medium and long term, there is definitely no problem with being bullish. There will be initial jobless claims data later, which will affect the trend of gold today. We need to pay some attention to it👀.
From the daily line, the current Bollinger Band middle track is near the 3343 line, and the SMA60 moving average is near the 3330 below. In the short term, the downward momentum of gold is released, and it is expected to test the 3343 mid-line support below💪.
📊Therefore, we can consider going long again at 3360-3343 below and look towards 3375-3385. Short-term losses don’t mean anything. With the recent frequent news fluctuations, we still have a good chance to turn losses into profits🚀.
🚀BUY 3360-3350
🚀TP 3375-3385
#GOLD Will Keep Growing!
HI,Traders !
#GOLD keep trading in An uptrend
along the rising support So as the gold
is approaching A the support we will be
Expecting a bullish rebound !
Comment and subscribe to help us grow !

XAUUSD analysis - 1H FVG and OB setupsOn the 1H timeframe, price is reacting as it approaches the HTF high zone (3430-3450) and is currently pulling back.
The 1H FVG zones at:
🔹 3400
🔹 3368
and the 1H OB around 3350 are key areas we are watching for potential long entries.
📌 Plan:
We will wait for price to pull back into one of these 1H FVG/OB zones and look for entry confirmations on the 5M or 3M timeframe to go long.
🎯 Targets: 3430 – 3440 – 3450
❌ No sell setup for now unless a clear structure break happens.

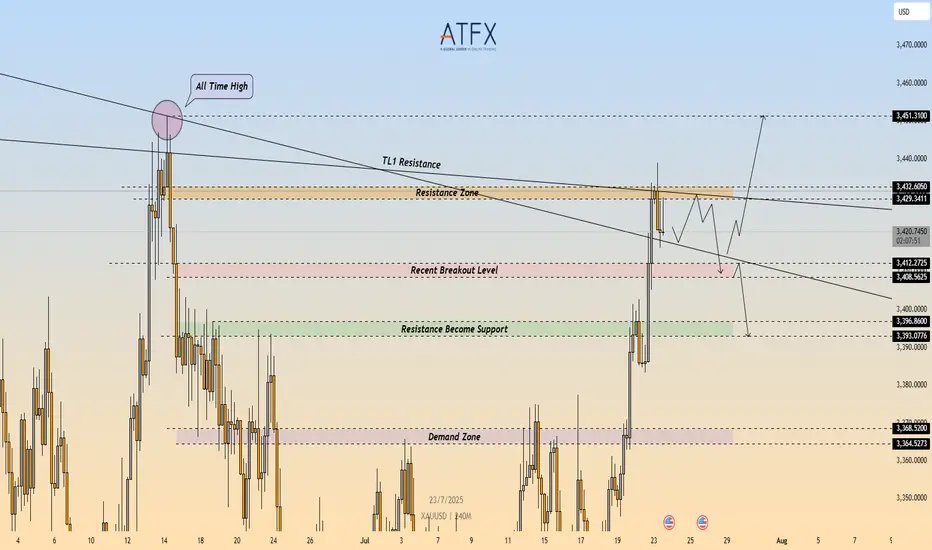
XAU/USD: Bearish Rejection at $3,432 – Short Setup in Play🔴 XAU/USD – Bearish Rejection at Key Resistance Zone ($3,432)
🔍 Technical Outlook
Gold (XAU/USD) failed to break through the $3,429–$3,432 resistance zone, which aligns with a descending trendline (TL1) and prior swing high. The rejection from this confluence zone is reinforcing bearish pressure, with price now carving out lower highs on the 4H timeframe.
A clean break below $3,412 would confirm bearish continuation and open the door toward the $3,400 area, followed by the demand zone at $3,368–$3,365.
🔻 Short Setup
Entry: 3,432
Stop Loss: 3,436
Take Profit 1: 3,412
Take Profit 2: 3,396
R\:R Ratio: ≈ 1 : 6.95
Invalidation: Close above 3,436
📌 Key Levels
Resistance: 3,429 – 3,432
Support 1: 3,412
Support 2: 3,368 – 3,365
Trendline: Long-term descending resistance acting as ceiling
📘 Summary
Gold remains capped beneath a critical resistance cluster. The rejection around $3,432 could trigger a deeper pullback toward $3,396, especially if sellers push price below $3,412. Bearish bias remains valid while price holds under the trendline.
📉 Bias: Bearish
📈 Confirmation Trigger: Break below $3,412
⚠️ Invalidation Level: Above $3,436
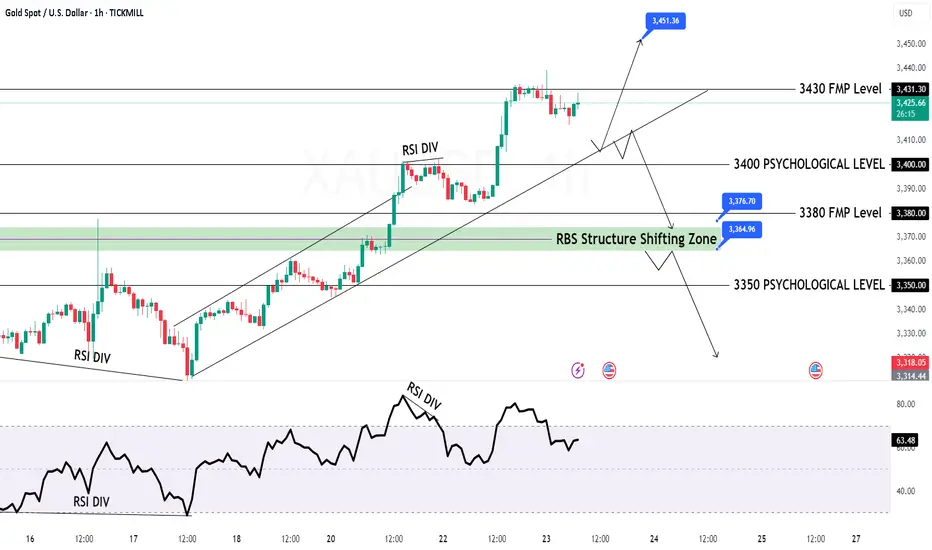
GOLD Intraday Chart Update for 23 July 25Hello Traders
First of all i hope you were enjoying yesterday move with 400 Pips Reward
For today we have 3400 Psychological remains in focus if market breaks below 3400 then it will move towards 3364-76 zone otherwise we are remain buyers above 3400 Level
Strong Resistance zone for intraday is at 3445-3465 if market cross 3465 the it will move towards ATH test which is around 3500
Disclaimer: Forex is Risky
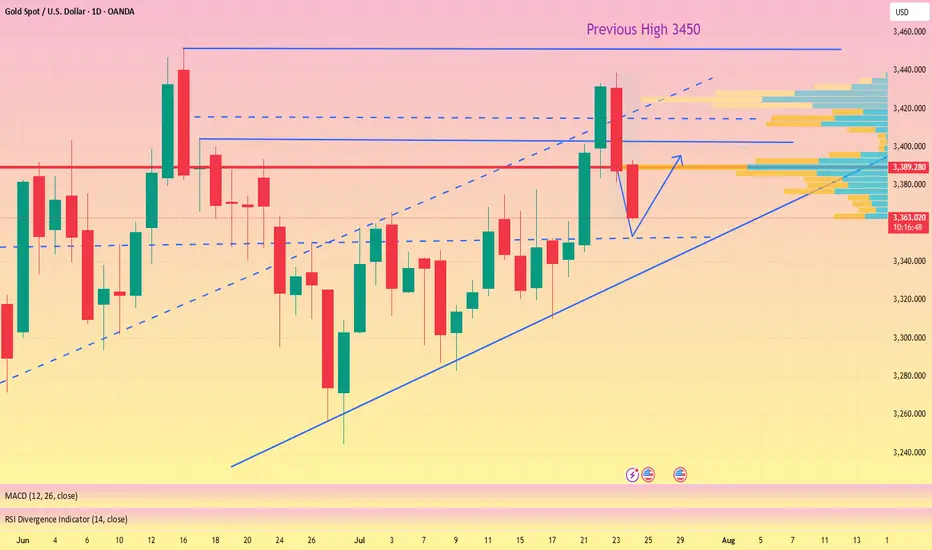
xauusd:3450-3500?Combined with the trend of the US dollar index, the probability of continuing to fall in the short term is high. Today, the manufacturing industry is significantly bullish for gold prices, which is expected. Powell's speech in an hour will be the key factor in today's New York market.
The pressure of interest rate cuts is imminent. Will Powell continue to insist on not cutting despite all objections? This is what we need to pay attention to. Make two plans. First, continue not to cut interest rates, the US dollar will be supported, and gold will retreat. If there is a retracement of 3400-3410 points, it needs to be paid attention to. Second, it is not discussed. Or interest rate cuts are beneficial to gold prices. This is the driving force for gold prices to hit 3500-3450.
To be honest, the conclusion of the Band Trading Center Research Institute tends to the latter. So if you buy, you need to set TP/SL strictly.

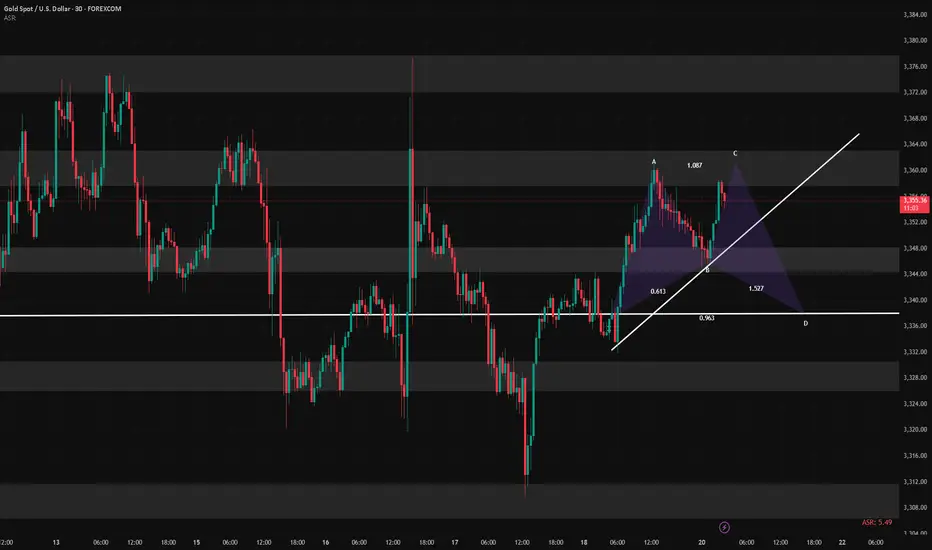
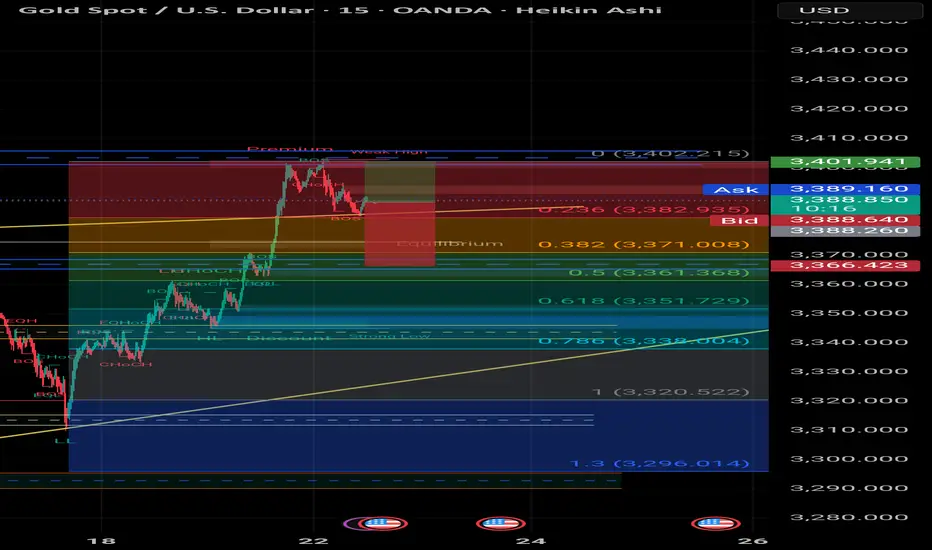
Absolutely! Here's a Scalping Analysis in English markdown forma## 🪙 Gold (XAU/USD) Scalping Plan – July 22, 2025
**Chart: 15-Minute (Heikin Ashi) – OANDA**
---
### 🔍 Market Structure:
- **Current Price**: 3,389.30 USD
- **Recent BOS (Break of Structure)** confirms bullish momentum up to the **3,402 level (Premium Zone)**.
- We’ve seen **CHOCHs** (Change of Character) confirming early exhaustion.
---
### 📐 Fibonacci Zones:
| Level | Price (USD) | Significance |
|--------------|---------------|------------------------|
| 0.236 | 3,382.93 | First minor support |
| 0.382 | 3,371.00 | Equilibrium zone |
| 0.5 | 3,361.36 | Institutional entry |
| 0.618 | 3,351.72 | Deep retracement zone |
| 0.786 | 3,338.80 | High-probability reversal |
| 1.0 | 3,320.52 | Final OB/Support base |
| 1.3 (forecast)| 3,296.01 | Extended target zone |
---
### 🧠 Scalping Setup:
- **Short-term Shorts** from the **Premium zone (3,402 → 3,382)** are already in play.
- Targeting the **0.382 retracement** initially, with continuation to 0.5 and **Order Block (OB)** near **3,351**.
- If price reaches 0.618 or 0.786, we enter **Buy Setup Zone** for intraday bullish bounce.
- Strong OB visible between **3,320–3,338**; ideal for scalping longs with tight SL.
---
### 🎯 Scalping Strategy:
#### ✅ Sell Setup:
- Entry: 3,398–3,402
- TP1: 3,382
- TP2: 3,371
- SL: 3,407
#### ✅ Buy Setup:
- Entry: 3,351–3,338
- TP1: 3,366
- TP2: 3,389
- SL: 3,329
---
### 🧭 Notes:
- Watch USD news events marked on the chart (🟦).
- Avoid entering trades near high-impact data drops.
- Focus on **reaction at OB zones + confluence with Fib** for sniper entries.
---
> ⚠️ **Reminder**: Scalping is all about precision & discipline. Stick to your SL and plan!
XAUUSD SEEMS BEARISHAs we can see gold has created Descending triangle pattern which lead the gold in more bearish momentum.

July 21: Key Resistance at 3358–3366, Breakout Targets 3378–3388Good morning, everyone!
Last Friday, gold tested the support around 3332 but did not break below it. The price then rebounded to the 3358 zone, where it encountered selling pressure and pulled back. At today's open, the price retraced to the 3343 level, where support held well, prompting another rally back toward 3358.
It’s important to note that since the 3358 resistance was already tested on Friday, some of the selling pressure has likely been absorbed. As a result, there is a higher probability of a breakout today. If a breakout occurs, the next key resistance lies at 3366/3372–3378. In the case of strong bullish momentum, the price may extend further toward the 3386–3392 resistance zone.
However, if the price continues to be capped below 3358–3366, we may see a consolidation or short-term pullback. In this case, watch support at 3348–3343. Should the price successfully break above 3378, then support on pullbacks will shift higher to 3363 and 3358–3352.
🔺 Key Warning: The 3358 resistance zone is technically crucial. If the price repeatedly fails to break through, watch out for a potential double-top pattern on the 30-minute chart, which could signal a near-term bearish reversal.