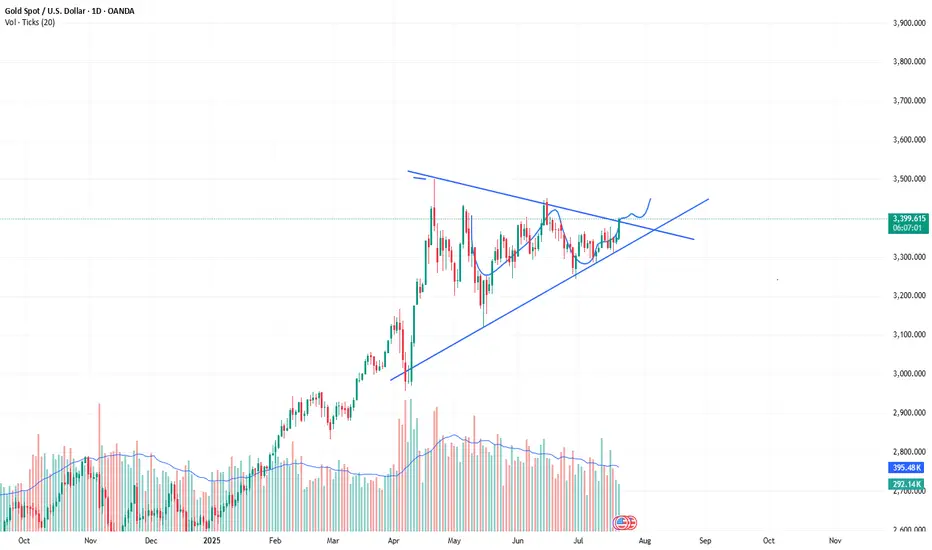
XAUUSD:The next target is 3430.The market is developing completely in accordance with the expectations of the band trading center. Today is a day of sharp rise. As Monday, this increase is quite considerable.
The three reminders to buy are all at a lower position. The post clearly points out that the market has reached 3400. 3400 is a controversial position. It needs to fluctuate in the New York market, and then there will be some breakthroughs. If it is stronger, it will directly break through the New York market. In the short term, you can pay a little attention to the retracement position of 3390-3395. Then continue to buy. The next target is 3430.
Xauusdsell
GOLD SELLGold price remains confined in a multi-week-old range as bulls seem reluctant
Gold price attracts some safe-haven flows amid persistent trade-related uncertainties. Mixed Fed rate cut cues keep the USD depressed and further benefit the XAU/USD pair. The range-bound price action warrants some caution before placing fresh bullish bets.
In the Forex market, Gold functions as a currency. The particularity of Gold is that it is traded against the United States Dollar (USD), with the internationally accepted code for gold being XAU.
Known as a safe-haven asset, Gold is expected to appreciate in periods of market volatility and economic uncertainty. Gold is also widely seen as a hedge against inflation and against depreciating currencies as it doesn’t rely on any specific issuer or government.
Central banks are the biggest Gold holders. In their aim to support their currencies in turbulent times, central banks tend to diversify their reserves and buy Gold to improve the perceived strength of the economy and the currency. The United States is the country that holds the biggest resources of Gold in the world.
1 SUPPORT 3,323
2 SUPPORT 3,323
3 SUPPORT 3,295
1 RESISTANCE 3,370
2 RESISTANCE 3,393
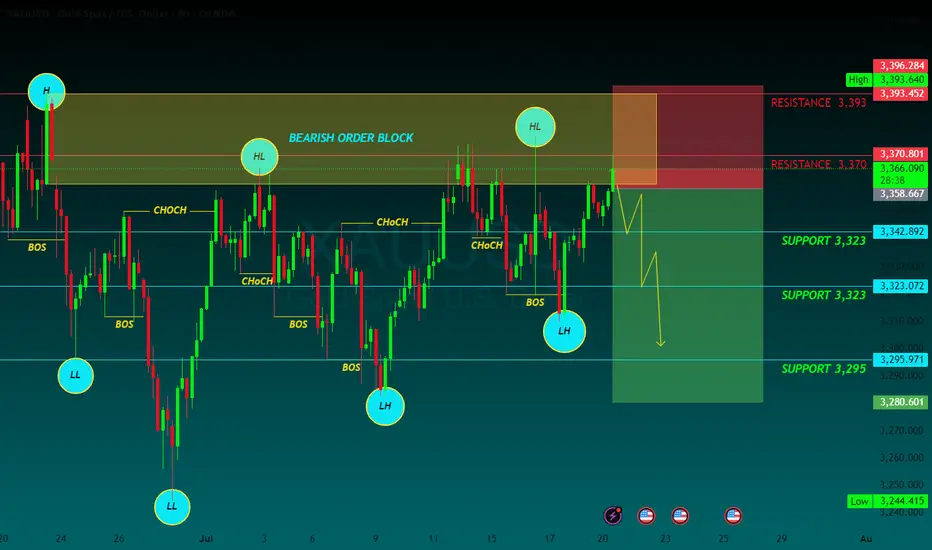
7/18: Watch 3343 Resistance, Guard Against Break Below 3323Good morning, everyone!
Yesterday, gold broke below the 3337 support after consolidating there, driven lower by bearish data, and eventually reached the 3323–3312 support zone. A rebound followed, and price has now returned above 3323, which also aligns with the daily MA60.
📌 Key Levels to Watch Today:
Resistance: 3343 / 3352–3358
→ A sustained break above 3343 opens the door for a potential move toward 3366 / 3372–3378;
Support: 3323 / 3312
→ If price remains capped below resistance and weekly close is under 3323, it will signal bearish structural pressure for the medium term.
📌 Trading Strategy:
Trade flexibly within the range of 3358–3343–3332–3323–3312
📌 Important Reminder:
If today’s closing price is below 3323, and you're planning to hold positions over the weekend, it’s safer to lean short. While we can’t predict weekend news, technically, bears have the upper hand, so risk control is essential.
Gold Strategy: Long in 3320-3330 & TargetsDuring Friday’s (July 18th) US trading session, spot gold traded in a narrow range with a downward bias 😔, currently hovering around 3350.05. Thursday saw spot gold stage a heart-stopping "deep V" move 😲! Driven by the dual catalysts of the US June retail sales surging 0.6% (beating expectations) and initial jobless claims dropping to 221,000, the US Dollar Index once spiked to a monthly high of 98.95, instantly slamming spot gold to an intraday low of 3309.82. Surprisingly, however, gold prices then staged a strong rebound, closing at 3338.86 with a mere 0.25% decline.
This "fake dip" pattern reveals a deep-seated contradiction in the current market – while economic data temporarily supports dollar strength, investors’ inflation concerns triggered by tariffs are forming an "invisible buying force" for gold 💪. The concurrent rise in the dollar and US Treasury yields has indeed weighed on gold prices, yet robust buying interest emerges at every dip window. Behind this phenomenon lies shrewd capital quietly positioning itself. When the 10-year US Treasury yield climbed to a monthly high of 4.495%, gold refused to fall further – this divergence signals significant market 分歧 over the Federal Reserve’s policy trajectory 😕.
Gold Trend Analysis:
Gold remains in a bullish trend 👍. From the daily chart perspective, gold continued its strong upward momentum today, closing with a positive candle. Technically, the MACD bullish energy bars have started to expand, and the KDJ is in a golden cross heading upward, indicating that the overall price is in a strong phase. As long as gold doesn’t break below 3320, the market is expected to continue its upward trajectory, potentially targeting 3375-3400. If it fails to break through, gold may see a minor short-term pullback. If the pullback doesn’t break 3330, gold is likely to gather momentum again to attack 3375; a break below would shift focus to the 3310 support level. As long as 3310 holds, gold remains in a bullish rebound structure. Next week’s broad range is expected to be 3375-3310.
On the 4-hour chart, the KDJ indicator, after being oversold, has started to turn upward and is now in a golden cross. Notably, this upward move has been accompanied by clear medium bullish candles, making KDJ a more reliable indicator here – the potential for continued bullish candles remains high 😃. The MACD fast line is turning upward at a high level, on the verge of another golden cross, with green energy bars continuing to contract and poised to turn red by inertia. Overall, gold’s current trend is either consolidating or rising. Given the clear bullish bias, we can consider firmly going long first, and only observe the possibility of shorting when KDJ approaches the upper 100 level and the MACD fast/slow lines are about to cross.
Focus on buying on pullbacks. The short-term support levels lie at 3330-3320 – as long as these levels hold, they present buying opportunities. If gold rises during the US session, watch whether 3365 and 3375 are broken; a failure to break through could bring pullback space, offering opportunities for short-term short positions.
Gold Trading Strategy 😎: Go long decisively once on the first pullback to the 3320-3330 range 😏, with targets looking at the 3350-3360 range – just wait for profits to roll in 💰!
🚀 Buy @3320 - 3330
🚀 TP 3340 - 3350
Accurate signals are updated every day 📈 If you encounter any problems during trading, these signals can serve as your reliable guide 🧭 Feel free to refer to them! I sincerely hope they'll be of great help to you 🌟 👇

sideways in weekend downtrend⭐️GOLDEN INFORMATION:
Gold prices (XAU/USD) struggle to extend Thursday’s recovery from the $3,309 region—a one-week low—consolidating within a tight range during Friday’s Asian session. The US Dollar (USD) continues to retreat from its peak since June 23, pressured by dovish signals from Federal Reserve (Fed) Governor Christopher Waller.
Additionally, growing concerns over US President Donald Trump’s unpredictable trade policies and their potential consequences for global growth are keeping investors cautious, supporting demand for the safe-haven metal. These factors collectively help limit deeper losses in Gold, though the metal lacks clear bullish momentum for now.
⭐️Personal comments NOVA:
Gold price is moving sideways, accumulating in the downtrend line, not much fluctuation in weekend news
⭐️SET UP GOLD PRICE:
🔥SELL GOLD zone: 3381- 3379 SL 3386
TP1: $3370
TP2: $3360
TP3: $3350
🔥BUY GOLD zone: $3293-$3295 SL $3288
TP1: $3308
TP2: $3318
TP3: $3330
⭐️Technical analysis:
Based on technical indicators EMA 34, EMA89 and support resistance areas to set up a reasonable SELL order.
⭐️NOTE:
Note: Nova wishes traders to manage their capital well
- take the number of lots that match your capital
- Takeprofit equal to 4-6% of capital account
- Stoplose equal to 2-3% of capital account

Wait for the data release; do not chase short positions.The 4-hour timeframe remains in a range-bound consolidation. Only a decisive break below the 3320 level will truly open up substantial downward space. Let’s focus on today’s US Initial Jobless Claims data: while the indicator has been trending lower recently, the current market expectation is tilted toward a rebound.
Even though yesterday’s PPI data, after its release, was bullish for gold, its actual impact on prices was limited—far from comparable to core metrics like CPI.
In summary, all short positions have now closed out with profits. Waiting for the data release to trade in line with the trend is a more prudent approach: if prices hover around 3320 or 3310 ahead of the data and the figures come in bullish, you can decisively enter long positions once there’s a slight pullback. If the data turns bearish, avoid chasing the decline; instead, consider positioning around key integer levels such as 3290-3300, as a sharp bullish correction is likely to follow an oversold move. As for whether the bulls can achieve a full reversal, we’ll assess the broader picture then. Always remember: no market moves in one direction indefinitely—adaptability is key
🚀 Buy @3310 - 3320
🚀 TP 3330 - 3340 - 3350
Accurate signals are updated every day 📈 If you encounter any problems during trading, these signals can serve as your reliable guide 🧭 Feel free to refer to them! I sincerely hope they'll be of great help to you 🌟 👇

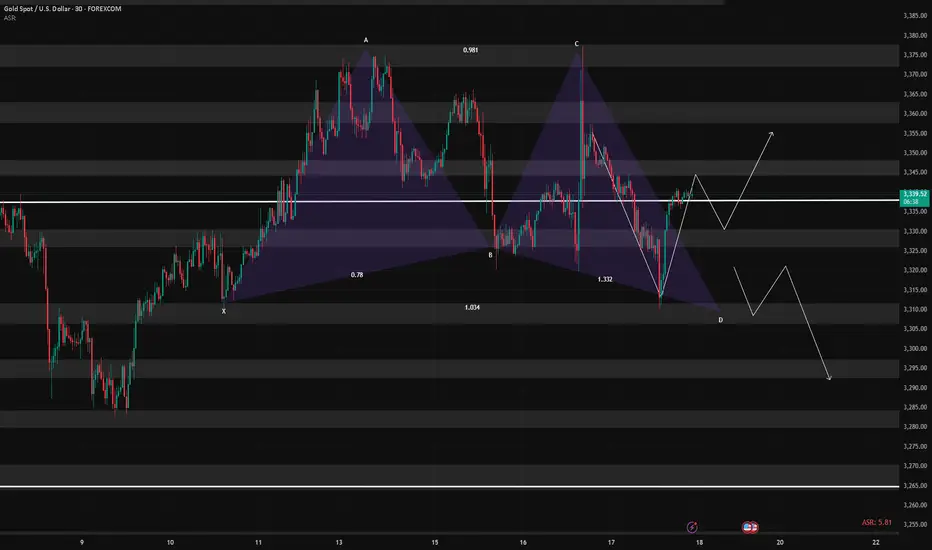
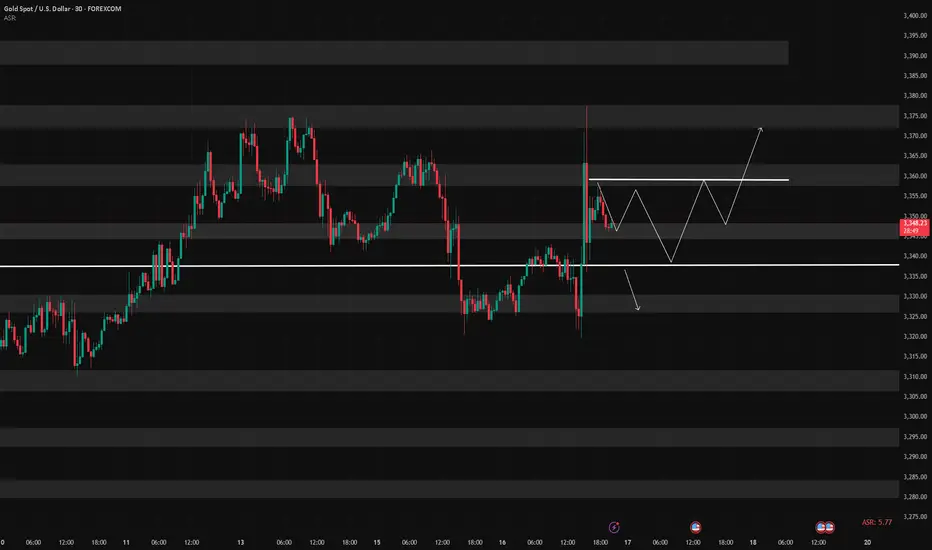
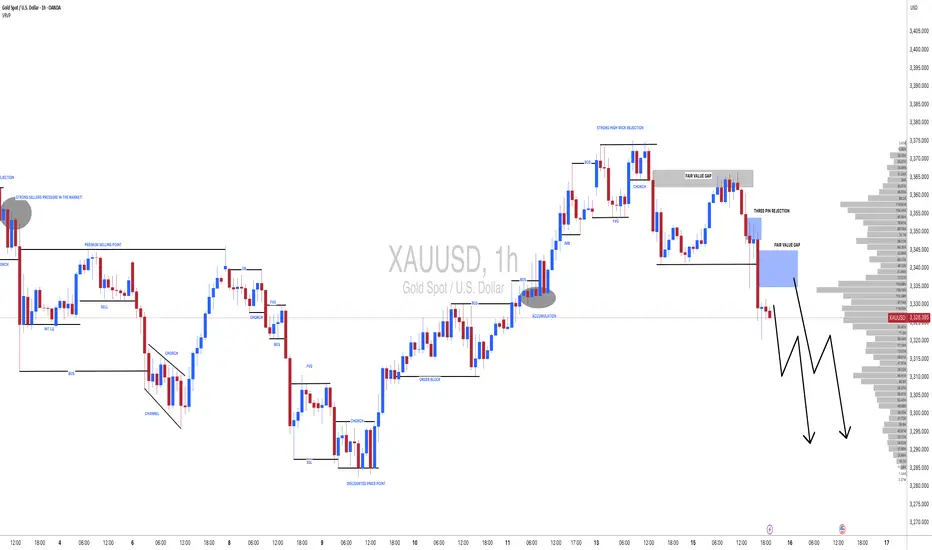
Gold Rejects Resistance Again – Gold Rejects Resistance Again ?Gold is currently trading near $3,335, showing signs of exhaustion after a failed breakout above the recent consolidation range. The market attempted to push higher but lacked strong momentum, leading to a pullback and possible shift in bias. The price is forming lower highs, indicating bearish pressure building up on the 4H timeframe. Gold is showing weakness after a second breakout followed by a possible retest failure. The market structure indicates a bearish bias
🔍 Market Structure Overview:
- Two Breakouts: Price attempted two bullish breakouts recently. The first breakout gained some traction, while the second failed to hold above resistance.
- Failed Retest: Price has now returned back near the previous breakout zone (~$3,332), signaling a potential bearish reversal pattern.
- The chart structure suggests a distribution phase, with price struggling to hold gains, and sellers slowly gaining control.
🧭 Key Support and Resistance Levels:
✅ Resistance Zones:
- $3,337.54 – Immediate resistance (recent rejection zone)
- $3,348.03 – Strong resistance if price pushes above $3,337
- $3,412.76 – Major resistance from previous swing high
- $3,490.40 – Long-term psychological resistance
🔻 Support Zones:
- $3,318.94 – Immediate support (just below current price)
- $3,303.46 – Key fib retracement (0.382 level)
- $3,248.28 – Strong horizontal support (major zone)
- $3,193.11 – Fibonacci extension level (-0.382)
- $3,159.02 – Next support zone (Fibo -0.618 level)
🟠 Current Bias:
Bearish to Neutral – as long as price remains below $3,337.
If price breaks and holds above $3,337 with volume, short-term bullish reversal is possible.
Yeterday there was a fake news and gold was pumped but after clarification it was dumped. It means buyers are not much interested till fed next meeting and the high price of the gold. Sellers will short the gold on every rise while buyers will wait for low price of the gold for long term trade.
Note
Please risk management in trading is a Key so use your money accordingly. If you like the idea then please like and boost. Thank you and Good Luck!

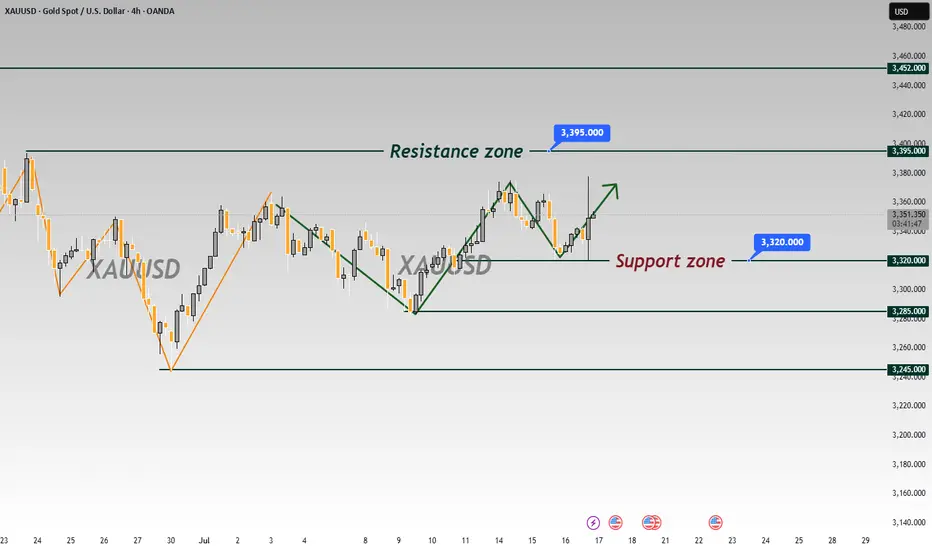
7/17: Key Support for Gold Bulls at 3343–3337During the Asian session today, gold rose as expected into the 3337–3343 resistance zone. After failing to break through, the price retraced during the European and U.S. sessions, reaching the 3323–3313 support area. A sharp rally followed due to unexpected news, pushing the price into the 3372–3378 resistance zone. Overall, the intraday bullish strategy performed well, yielding solid profits.
After this sharp volatility, price movement has stabilized somewhat. The MA60 support on the daily chart remains intact.
For tomorrow’s trading, key levels to watch are:
🔽 Support: 3343–3337, with secondary support at 3328–3323
🔼 Resistance: 3372–3378
On the 2-hour chart, bullish momentum appears likely to continue as long as price holds above the support zone.
Additionally, upcoming economic data releases and any further developments on the report regarding Trump potentially firing Powell could have a significant impact on market sentiment—these factors should be closely monitored.
In summary, tomorrow’s initial trading focus can remain within the 3337–3358 range, with strategies adjusted as market conditions evolve.
#XAUUSD(GOLD): Strong Sellers Hold, Further Drop Incoming! God dropped from our area of entry yesterday as we initially expected. However, since the massive drop, we are now seeing some short-term correction in the prices. In the coming time, we can expect further price drops around 3280 or 3250.
If you like our idea, please like and comment.
Team Setupsfx_
Gold: Bull-Bear Swings & Today's Trade Tips + AnalysisAnalysis of Gold News Drivers:
During the U.S. session on Wednesday (July 16th), spot gold surged sharply and is currently trading around 3,370 🚀. Trump stated that tariff letters will soon be sent to small countries, with rates likely slightly above 10%, providing safe-haven support for gold prices 🛡️.
Gold prices fell 0.5% on Tuesday, closing at 3,324.68, barely holding above the 55-day moving average of 3,222 📉. Earlier, the U.S. June CPI increase hit its highest level since January, pushing the U.S. dollar index to a nearly three-week high, while U.S. Treasury yields also climbed to a six-week peak, pressuring gold prices ⚖️. The dollar index has risen for four consecutive trading days, hitting a high of 98.70 on Tuesday, the highest since June 23rd 🆙. A stronger dollar makes dollar-denominated gold more expensive for investors holding other currencies, thereby weighing on gold prices 💸.
However, the market largely interprets the dollar's recent rally as a technical adjustment rather than a reversal of the long-term trend 🔄. Despite short-term pullbacks in gold prices, market sentiment has not fully turned pessimistic 😐. While gold is currently in a consolidation range since mid-May, uncertainties surrounding tariff policies may offer support 🔀. Overall, the long-term outlook for gold remains optimistic, with sustained market focus on tariff issues expected to drive a rebound in gold prices in the future 📈
Accurate signals are updated every day 📈 If you encounter any problems during trading, these signals can serve as your reliable guide 🧭 Feel free to refer to them! I sincerely hope they'll be of great help to you 🌟 👇
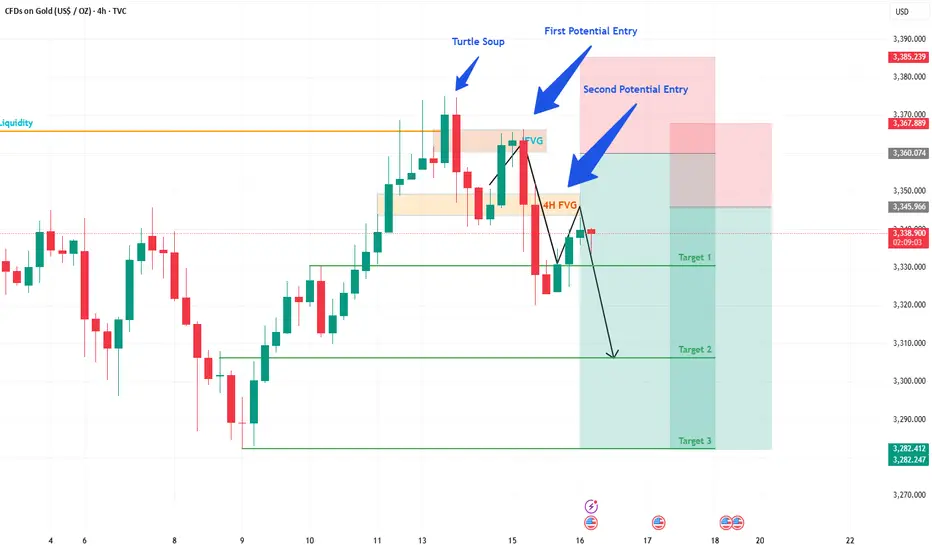
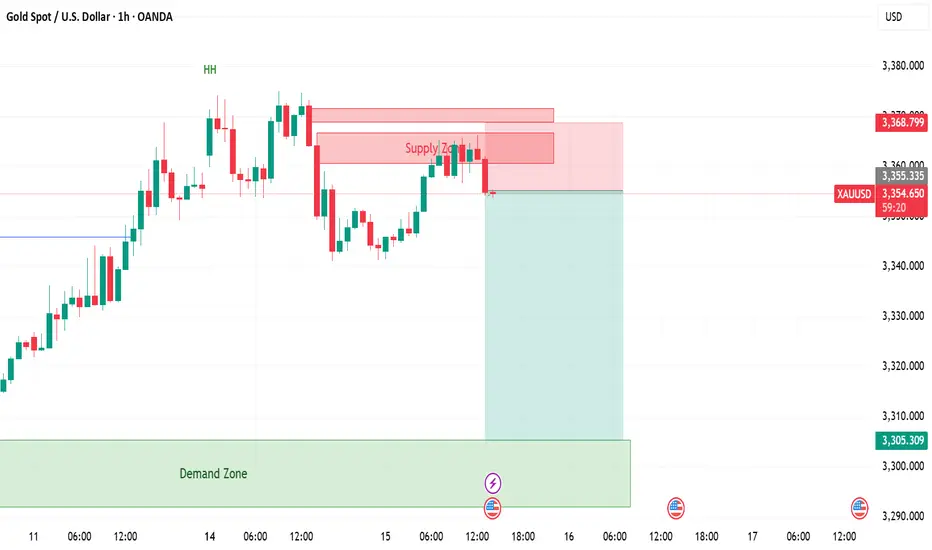
Gold Trade Update: Another Win & What's Next!Hey Fellow Traders! 👋
What a week for Gold! On Monday, I shared my Gold analysis and trade idea, pinpointing a key 1H FVG zone. And guess what? The trade played out perfectly! 🎉 The price dropped ~400 pips from our highlighted area with a tiny drawdown of just 30-40 pips. We smashed Target 1 (TP1), and the market even pushed beyond it! 🙌 Huge congrats to everyone who jumped on this trade! 💰
📈 What's Happening Now?
The price action is heating up! Gold has broken through the 4H FVG, which now acts as an IFVG. The price has retraced almost perfectly to this IFVG, triggering our second layer of entry. 🚦 This is a prime setup, and we’re eyeing TP1 again—and potentially beyond! 🌟
💡 What's the Plan?
Entry: Triggered at the IFVG retracement.
Target: Aiming for TP1, with room for more upside.
Stay sharp and manage your risk—let’s keep those drawdowns tight!
🗣️ Join the Conversation!
What did you think of this move? Did you catch the Gold trade? Drop a comment below, give this post a LIKE 👍, and FOLLOW for more trade ideas and updates! Let’s keep the momentum going and crush it together! 💪
#TradingView #Gold #PriceAction #TradingSuccess
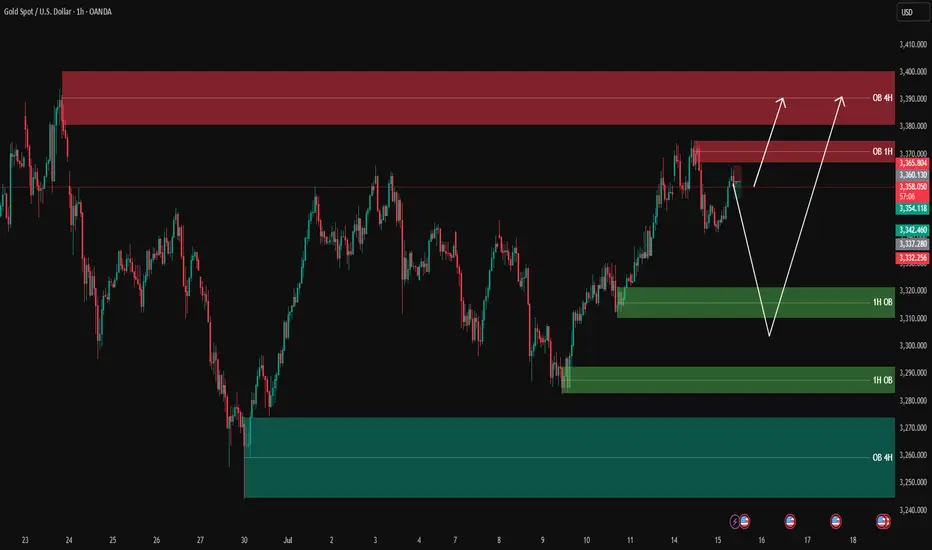
XAUUSD analysis - 1H FVG and OB Setups✅ Green boxes = Buy Order Blocks (OB)
✅ Red boxes = Sell Order Blocks (OB)
✅ Blue boxes = Fair Value Gaps (FVG) (none currently on this chart)
Currently, gold is approaching the 1H Sell OB (red) between 3360 – 3370, which is a strong resistance zone.
We have two clear scenarios:
1️⃣ If sellers step in and we get confirmation, we can look for a pullback down to the lower green buy OB zones:
3320 – 3330 (1H OB)
3290 – 3300 (1H OB)
These zones will be key for looking for buy opportunities with LTF confirmations.
2️⃣ If buyers break above 3370 with a strong close, we can expect a move towards the 4H Sell OB (red) at 3380 – 3395.
🎯 Summary:
✅ Currently looking for a potential sell at the red zone with LTF confirmations.
✅ Watching green zones below for clean buys on a pullback.
✅ If price breaks above, the next target will be 3380 – 3395.
Let price come to your levels, wait for confirmation on 3m/5m for clean entries, and stay disciplined with your plan.
—
📊 ProfitaminFX | Gold, BTC & EUR/USD
📚 Daily setups & educational trades
7/16: Will Gold Reclaim 3350 or Fall to 3250?During today’s session, gold briefly broke through the 3352–3358 resistance zone, but due to news-driven pressure during the pullback, bullish momentum weakened, and the price retreated to the MA60 support level on the daily chart.
Given the significant retracement, there is a possibility that a short-term bottom may form during the upcoming Asian session, potentially leading to a retest of the 3337-3343/3352-3358 resistance area:
If the price breaks above this zone and holds above it after a pullback, the bullish trend could resume;
However, if it fails to break through or is rejected again, caution is warranted, as this could signal a larger-scale downtrend on the weekly chart, possibly targeting the 3250 area.
7/15: Watch for Long Opportunities Around 3343 / 3332–3326Good morning, everyone!
Yesterday, gold rose into the resistance zone before pulling back, testing support around 3343. After today’s open, the price continues to consolidate near this support level.
On the 30-minute chart, there is a visible need for a technical rebound, while the 2-hour chart suggests that the broader downward movement may not be fully completed. The MA60 support area remains a key level to watch.
If support holds firm, the price may form a double bottom or a multi-bottom structure, potentially leading to a stronger rebound.
As such, the primary trading strategy for today is to look for long opportunities on pullbacks, with key levels as follows:
🔽 Support: 3343, and 3332–3326 zone
🔼 Resistance: 3352–3358, followed by the 3372–3378 upper resistance band

XAUUSD: Time For Swing Sell, 1 Hour Timeframe! Gold is currently trading at crucial level where we have witnessed a strong bearish presence. This is a small time frame overview and price may not complete the target fully, so close when you think it is the time. Good luck and trade safe!
Team Setupsfx_

Gold: Data, Tariffs & Trading LevelsThis week is packed with market news and economic data 😣. Key focuses include the US CPI, PPI, retail sales data, and the University of Michigan's preliminary consumer sentiment index. Additionally, former US President Trump plans to make a "major announcement" on Russia; the Federal Reserve will release the Beige Book (Economic Conditions Survey); and the CFTC's weekly positioning report is also worth monitoring 📊.
Over the weekend, Trump imposed tariffs on the EU and other regions, prompting a strong counterattack from the EU. The subsequent evolution of the situation requires continuous tracking, as it has triggered sharp market volatility pushing toward the 3400 mark 😱. Trump has recently announced frequent tariff policies (e.g., 30% tariffs on the EU and Mexico, and threats of 100% tariffs on Russia), amplifying market uncertainty. While this theoretically benefits gold's safe-haven demand, the actual impact requires close observation of institutional capital flows 🤔.
Gold prices consolidated at the bottom after a sustained pullback last night and extended their rebound this morning. Key pressure levels have undergone a support-resistance flip. The current gold rebound is merely a secondary confirmation of the 30-minute top structure, and after surging to 3365 in the afternoon, short-term signs of pressure have emerged 😕. In a volatile market, if prices start to consolidate sideways, it may signal the end of this oscillating upward trend, with a shift to a downward phase ahead.
Given market sensitivity ahead of the CPI data release, it’s advisable to focus on a volatile pullback trend 🧐. After today’s rebound, key attention should be on the 3363-3368 range as a shorting zone, with the long/short defensive level set at yesterday’s intraday high of 3375. Downside support is focused on the 3340-3335 range 🔍

XAUUSD | GOLD | SellGot the confirmation from 15 minute timeframe.
Sell Gold till demand zone.
R:R 1:3,8
GOLD Made Triple Top Pattern , Short Setup Very Clear !Here is my opinion on 15 Mins T.F On Gold , we have a triple Top Reversal Pattern , on 15 mins and 30 mins T.F , And we have a clear closure below neckline , so i think we can sell this pair for 100 pips at least to get this pattern target , we can sell from the current price or from m y best area for sell .

XAUUSD Gold price moves closer to three-week peak amid modest USD downtick
Gold price regains positive traction amid a modest USD pullback from a multi-week high. Persistent trade-related uncertainties also lend support to the safe-haven precious metal. Reduced Fed rate cut bets might cap the commodity ahead of the critical US CPI repo
Fundamental Overview
Amid US President Donald Trump’s fresh tariff threats announced late Monday and his latest criticism of Federal Reserve Chairman Jerome Powell, Gold traders resorted to profit-taking after the bright metal hit a three-week high of $3,375 while bracing for the US inflation report for June.
Trump threatened to impose 100% tariffs on Russia if President Vladimir Putin does not agree to a deal to end his invasion of Ukraine in 50 days, per Bloomberg.
Meanwhile, the US President renewed his attacks on Powell, noting that “interest rates should be at 1% or lower, rather than the 4.25% to 4.50% range the Fed has kept the key rate at so far this year.”
Markets now price in 50 basis points of Fed interest rate cuts by year-end, with the first reduction foreseen in September.
However, it remains to be seen if these expectations hold ground following the US CPI data publication.
Economists are expecting the US annual CPI and core CPI to accelerate 2.7% and 3% in June, reflecting the tariff impact feeding through prices. Meanwhile, the monthly CPI and core CPI inflation figures are set to rise to 0.3% in the same period.
Hotter-than-expected US CPI monthly or annual readings could reinforce the Fed’s patient outlook, pushing back against expectations of two Fed rate cuts this year.
This scenario could help the US Dollar (USD) extend its recovery at the expense of the non-yielding Gold price.
Alternatively, if the data come in below forecasts, it could provide a fresh tailwind to the Gold price on renewed bets that the Fed will remain on track for two rate cuts.
BAY TP
TP 1 3,371
TP 2 3,391
TP 3 3,412
SELL PT
TP 1 3,337
TP 2 3,311
TP 3 3,286

Gold's Bullish Momentum: Trading Strategy for TodayTechnically, gold prices continued their strong bullish rally to break new highs last Friday 😎. During the Asian and European sessions, prices broke through the 3320 mark and extended their upward momentum with sustained strength 💹. In the afternoon European session, gold prices kept surging, breaking through and standing above the 3340 mark, accelerating the upward trend 🔥. In the evening US session, the price further accelerated its rally, piercing the 3369 level before pulling back and closing strongly 📈. The daily K-line closed as a fluctuating and high-breaking bullish candle 🌞. On the daily chart, there has been a strong bullish rally breaking new highs for three consecutive trading days, and the overall price has returned to the 3360 mark, re-entering a strong bullish one-sided pattern.
This morning, gold prices opened with a further gap higher, piercing the 3370 mark and continuing to fluctuate strongly 😜. Today's trend should focus on buying on dips 🙌. Although gold gapped up and surged for a while, the momentum is not strong. There must be a pullback for adjustment; otherwise, it will be difficult to maintain the upward momentum 🚶♂️.
From the 4-hour chart analysis, the short-term support below today should focus on the hourly neckline around 3340-45 📍, with key attention to the 3325-30 support level. During the day, we should continue to take the opportunity of pullbacks to go long as the main strategy 😏. The key dividing line for the short-term bullish strength is the 3325 mark. As long as the daily chart stabilizes above this level, we will continue to maintain the strategy of buying on dips to follow the bullish trend. Before breaking below this level, we will keep the strategy of buying on dips to follow the trend 💪
Accurate signals are updated every day 📈 If you encounter any problems during trading, these signals can serve as your reliable guide 🧭 Feel free to refer to them! I sincerely hope they'll be of great help to you 🌟 👇
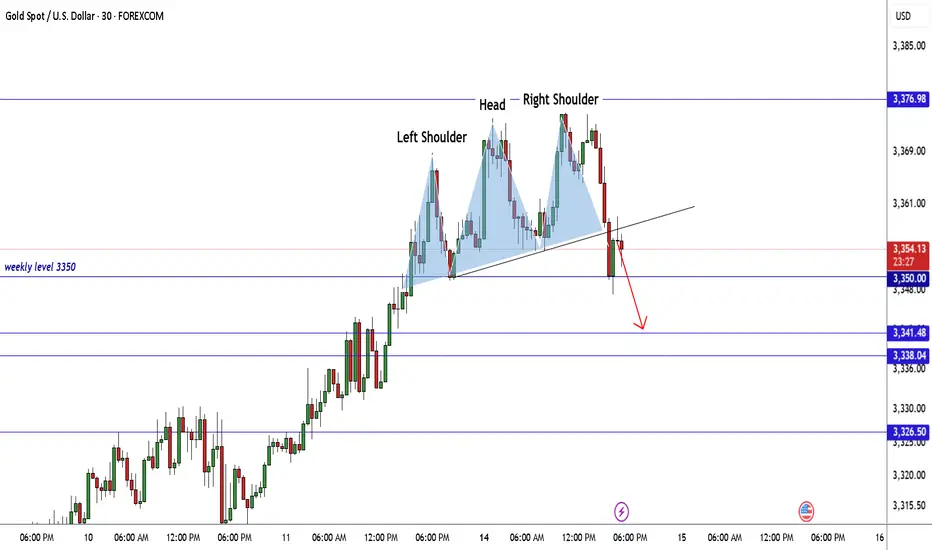
GOLD Made H&S Reversal Pattern , Scalping Short Setup Valid !Here is my GOLD 30 Mins Chart and if we checked the chart we will see that the price created a very good reversal pattern on 30 mins T.F , Head & shoulders reversal pattern and also it`s already confirmed by closure below neckline so the short is very clear now and we can targeting 100 to 150 pips , 3350.00 is a very good support also so we can see a price bounce from it to upside .
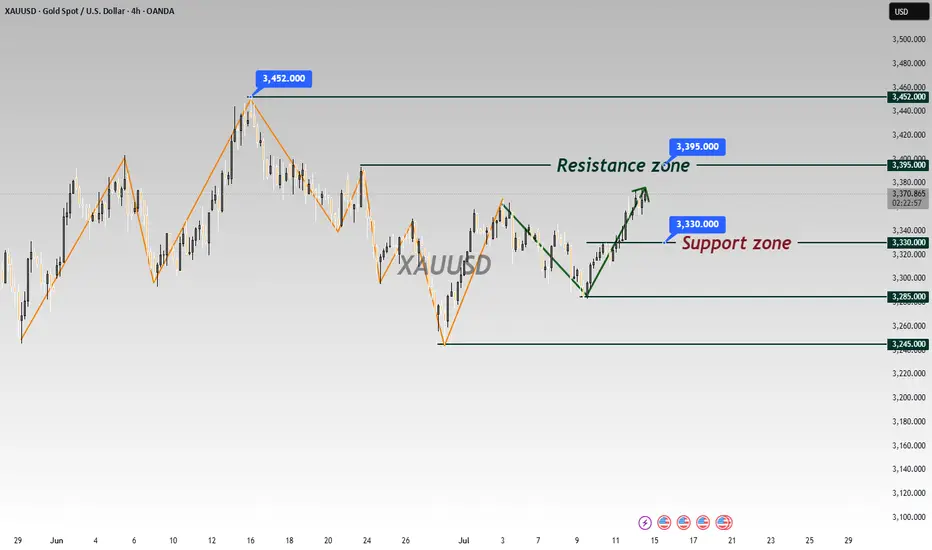
7/14: Sell High, Buy Low Within the 3400–3343 Range for GoldGood morning, everyone!
At the end of last week, renewed trade tariff concerns reignited risk-off sentiment, prompting a strong rally in gold after multiple tests of the 3321 support level. The breakout was largely driven by fundamental news momentum.
On the daily (1D) chart, the price has fully reclaimed the MA60 and broken above the MA20, signaling an emerging bullish trend. The key focus for this week includes:
Monitoring whether MA20 holds as support on any pullbacks
Watching the 3400 resistance zone for signs of exhaustion or continuation
From a 30-minute technical perspective, gold is currently trading within a short-term resistance band of 3372–3378, with a stronger resistance zone between 3387–3392. Key support levels are:
Primary support: around 3358
Secondary support: 3343–3332 zone
Given the recent increase in volatility due to geopolitical and macroeconomic headlines, flexible intraday trading is recommended within the 3378–3343 range, while broader trades can be framed around the 3400–3325 zone, still favoring a sell-high, buy-low approach.
Lastly, as we move into the mid-year period, I may have more personal commitments, and strategy updates could be less frequent. I appreciate your understanding, and as always, feel free to leave a message if you have any questions or need trading guidance—I’ll respond as soon as I can.
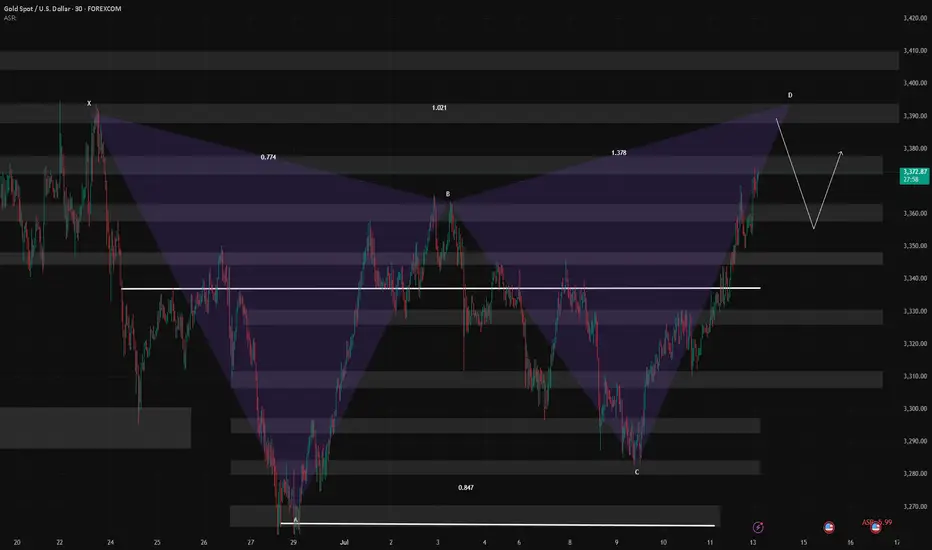
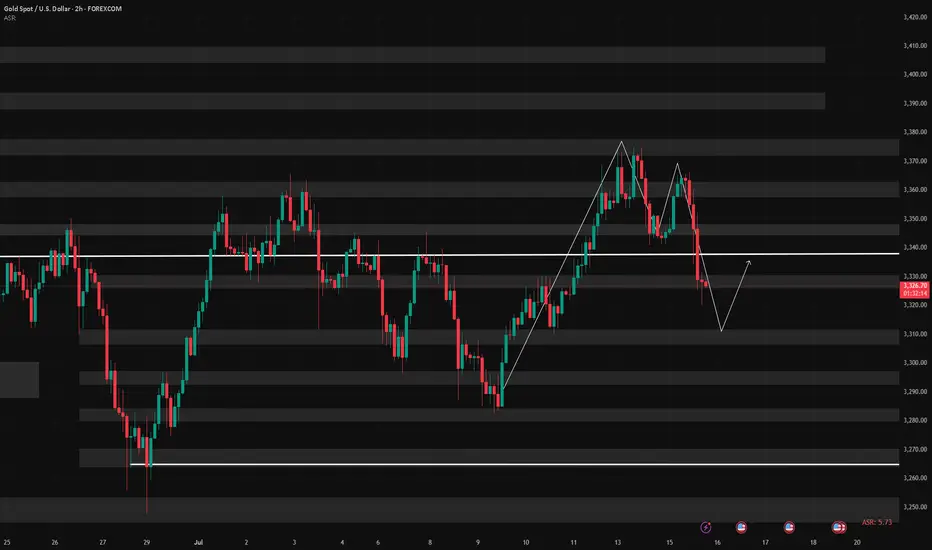
XAUUSD - 4H Bearish Rejection from Supply Zone | SMC AnalysisGold is showing signs of weakness after reacting strongly from a 4H Supply Zone around the 3331.72 level. Price tapped into the red supply zone, failed to break above, and is now forming lower highs — suggesting bearish momentum is building.
🔍 Key SMC Observations:
Supply Zone: Price rejected the 3331.72 level, which acted as a clear supply area based on past liquidity grabs and bearish institutional moves.
Change of Character (CHoCH): We saw a CHoCH around July 5th–6th, indicating a shift from bullish to bearish order flow.
Lower High Formation: Price failed to make a new high after tapping supply, showing signs of distribution.
Imbalance + Target Zone: Clean imbalance exists down to 3288.73 and potentially to the green demand zone around 3260–3270.
📍Trade Setup Idea:
Sell Opportunity: If price continues to reject the supply zone, look for bearish confirmation on the lower timeframes (e.g., 1H) to enter.
Target 1 (TP1): 3288.73 (near-term liquidity level)
Target 2 (TP2): 3260–3270 demand zone
Invalidation: A break and close above 3331.72 would invalidate the short-term bearish bias.
🔴 Watch for reaction around 3288.73 – if it holds, expect a possible bounce. If broken, further downside is likely.
