XAUUSD Idea: Structure, Fibonacci Setup & S&P 500 Correlation📉 XAUUSD Trade Outlook 🧠🔍
Currently analyzing Gold (XAUUSD), and things are getting interesting. On the daily timeframe, we’ve seen a clear bearish break of market structure, and this shift is also evident on the 4-hour chart. 🕰️📉
I’m watching closely for a bullish retracement into my key Fibonacci 61.8% level, where I’ll be looking for confirmation of a bearish structural break to initiate a short position. 🎯🔽
When we compare this setup to the US500 (S&P 500), it becomes even more compelling. The indices have rallied hard and appear overextended — a correction seems likely. 📊🧾
If we do get that pullback in the indices, gold may rally temporarily, but my overall bias remains bearish. If the indices resume their uptrend after a pullback, I expect gold to weaken further, aligning with my current short-side outlook. ⚠️📉
🛑 This is not financial advice. Always do your own analysis and manage risk according to your trading plan.
💬 What are your thoughts on gold right now? Are you leaning bullish or bearish? Let me know in the comments! 👇
Xauusdsetup

GOLD M30 Intraday Chart Update for 28 may 2025Hello Guys, as you can see that GOLD intraday chart just shared with levels
you may do some scalping in the ranging zone, however today strong zone is 3265-3280 which also buying zone but must check confirmation before enter
as well as once market will break SBL level then you may also look long position
Remember always trade with SL
Disclaimer: Forex is Risky

GOLD Will Keep Falling!
HI,Traders !
GOLD is going down
Now and the pair broke
The rising support line
Made and is going
Down again now so we are
Bearish biased and we will
Be expecting a further
Bearish move down !
Comment and subscribe to help us grow !

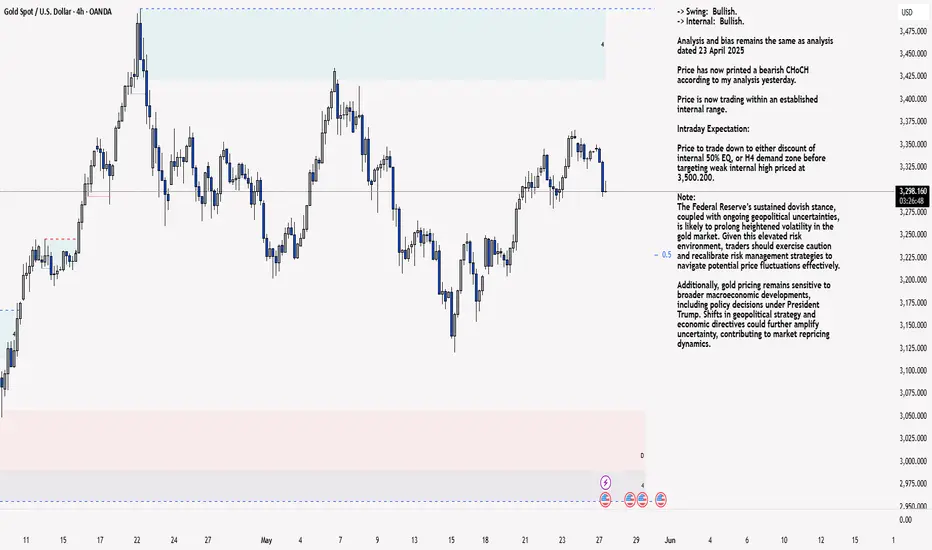
XAU/USD 27 May 2025 Intraday AnalysisH4 Analysis:
-> Swing: Bullish.
-> Internal: Bullish.
Analysis and bias remains the same as analysis dated 23 April 2025
Price has now printed a bearish CHoCH according to my analysis yesterday.
Price is now trading within an established internal range.
Intraday Expectation:
Price to trade down to either discount of internal 50% EQ, or H4 demand zone before targeting weak internal high priced at 3,500.200.
Note:
The Federal Reserve’s sustained dovish stance, coupled with ongoing geopolitical uncertainties, is likely to prolong heightened volatility in the gold market. Given this elevated risk environment, traders should exercise caution and recalibrate risk management strategies to navigate potential price fluctuations effectively.
Additionally, gold pricing remains sensitive to broader macroeconomic developments, including policy decisions under President Trump. Shifts in geopolitical strategy and economic directives could further amplify uncertainty, contributing to market repricing dynamics.
H4 Chart:
M15 Analysis:
-> Swing: Bullish.
-> Internal: Bearish.
Analysis and bias remains the same as analysis dated 22 May 2025.
In my analysis from 12 May 2025, I noted that price had yet to target the weak internal high, including on the H4 timeframe. This aligns with the ongoing corrective bearish pullback across higher timeframes, so a bearish internal Break of Structure (iBOS) was a likely outcome.
As anticipated, price targeted strong internal low, confirming a bearish iBOS.
Price has remained within the internal range for an extended period and has yet to target the weak internal low. A contributing factor could be the bullish nature of the H4 timeframe's internal range, which has reacted from a discounted level at 50% of the internal equilibrium (EQ).
Intraday Expectation:
Technically price to continue bullish, react at either premium of internal 50% EQ or M15 demand zone before targeting weak internal low priced at 3,120.765.
Alternative scenario:
Price can be seen to be reacting at discount of 50% EQ on H4 timeframe, therefore, it is a viable alternative that price could potentially print a bullish iBOS on M15 timeframe.
Note:
Gold remains highly volatile amid the Federal Reserve's continued dovish stance and persistent geopolitical uncertainties. Traders should implement robust risk management strategies and remain vigilant, as price swings may become more pronounced in this elevated volatility environment.
Additionally, President Trump’s recent tariff announcements are expected to further amplify market turbulence, potentially triggering sharp price fluctuations and whipsaws.
M15 Chart:
Gold Pullback as Expected, Range Trading ContinuesAs I clearly stated last Friday, key resistances are located at 3366 and the stronger zone between 3376–3391. On Friday, the price peaked near 3366 without touching the second resistance band, followed by a pullback — a natural result of recent buying pressure being released and previous trapped positions being closed out.
🎯 Congratulations to those who carefully followed and executed the strategy — you should have captured solid profits from this retracement!
🔍 Current Technical Outlook:
✅ A wave of selling has already been absorbed. Now we watch:
Support strength — if key levels hold, scalping on dips remains valid;
Rebound momentum — short-term indicators favor a bounce, though medium-term structures are still being repaired;
Focus zone: 3355–3357 is a newly created gap resistance, critical for today’s action;
Previously broken supports (3346–3338 and 3324–3318) now serve as resistance and should be watched during any upside attempt.
📈 Trading Strategy:
Today’s price range is relatively contained — stick to selling near resistance, buying near support. If there are any major changes or new developments, I’ll update everyone in time.

#XAUUSD: +2000 Pips Correction US-China Trade Deal ConfirmedGold has experienced a significant decline in recent days, primarily due to fundamental market factors that have caused its price to fall from 3430 to 3209, resulting in a loss of approximately 2210 pips. Consequently, we recommend that you consider selling Gold if it aligns with your analysis and assessment. It is imperative that you implement strict risk management measures while trading Gold.
It is important to note that this analysis does not guarantee a price decline or that the market will behave as described. Therefore, we strongly advise you to conduct thorough trade planning before making any trading decisions.
We extend our sincere gratitude for your unwavering support over the years.
Our primary objective is to assist you in making well-informed decisions. Therefore, we encourage you to contact us if you have any inquiries or require further information.
Additionally, we would be delighted to receive your insights on which cryptocurrency pair you would like to explore next. Please do not hesitate to share your preferences.
Best regards,
Team Setupsfx_

XAUUSD[GOLD]: Another Possible Swing Sell Happening! Swing MoveGold rejected twice as we had described in our last two analyses on Gold. We remain heavily bearish on Gold and expect a swift bearish move within the next week or following week. We are eyeing two targets. Please use this analysis accordingly and avoid overtrading. This is not a confirmation, and do not use the marked arrow as an entry or exit point. The marked red area drawn there represents a potential reversal zone from which price may reverse.
As always, this analysis does not guarantee that price will move as described in the chart. Please use your own knowledge and trading plan while trading Gold. Good luck and trade safely.
Want to support us? Do the following ❤️
-LIKE THE IDEA
-COMMENT YOUR VIEW
-SHARE IF YOU AGREE
Much love ❤️
Team Setupsfx_

Gold Heist Blueprint: "XAU/USD" Short Setup!?Greetings, wealth snatchers and market bandits! 🤑💸
Welcome to the Thief Trading Style, where we combine slick technicals and crafty fundamentals to pull off the ultimate XAU/USD heist. This is our plan to raid the "Gold" market with a short entry, targeting the high-stakes GREEN MA Zone. Expect a risky, oversold setup with consolidation and a potential trend reversal—a trap where bullish robbers get outplayed. 💪🎯 Stick to the chart, execute with precision, and treat yourself to the spoils! 🍾
Why This Trade? 💰
XAU/USD is showing a neutral trend with a bearish tilt as of 18 May 2025, driven by:
📊Technicals: Price is testing a key support zone (~3120) after a breakout from a consolidation pattern on the 30-minute chart. Oversold RSI signals a potential reversal, with the Pink MA (50-period) acting as dynamic resistance.
📰Fundamentals: Recent COT reports indicate reduced speculative long positions, hinting at weakening bullish momentum. Quantitative analysis suggests gold’s correlation with USD strength is tightening, supporting a bearish outlook.
😇Sentiment: Intermarket analysis shows rising Treasury yields pressuring gold, while market sentiment leans cautious ahead of upcoming economic data releases.
💡Data Point: Gold’s average daily range (ADR) over the past 5 days is ~35 points, aligning with our target and stop-loss levels for a day/scalp trade.
Entry 📈: Set your trap at 3120 post-breakout.
Option 1: Place sell stop orders below the support breakout level (~3115) for confirmation.
Option 2: For pullback entries, set sell limit orders near the swing low/high on a 15/30-minute timeframe.
Pro Tip: Set an alert to catch the breakout in real-time. Don’t miss the heist! 🚨
Stop Loss 🛑: Protect your loot!
Place your stop loss above the nearest swing high (~3270) on the 30-minute chart for day/scalp trades.
Adjust based on your risk tolerance, lot size, and number of orders.
Note: If using sell stop orders, wait for breakout confirmation before setting your stop. Risk is yours—play it sharp! 🔥
Target 🎯: 3000 (120-point move, aligning with ADR and support zones).
Trading Alert 🚨:
News Risk: Upcoming economic releases (e.g., CPI, FOMC minutes) could spike volatility. Avoid new trades during high-impact news and use trailing stops to lock in profits.
Position Management: Scale out at key levels (e.g., 50% at 3060) to secure gains.
Join the Heist! 💥
Hit the Boost Button to power up our robbery squad. With the Thief Trading Style, we make markets bleed profits daily. 🏆 Stay sharp, follow the plan, and let’s stack those wins! Another heist is coming soon—keep your eyes peeled. 🐱👤💰
Check fundamentals, COT reports, and intermarket trends for deeper insights.
check linkkss..🔗
Happy thieving! 🤝🚀

XAUUSD[GOLD]: Bearish Correction Is Happening! Gold rejected at 3350, dropping almost 600 pips to 3290. We can expect the price to drop further to around 3250, potentially reversing from there. A possible entry point is 3304, followed by a drop from there.
If you’d like to contribute, here are a few ways you can assist us:
- Like our ideas
- Comment on our ideas
- Share our ideas
Team Setupsfx_🚀❤️

Gold prices remain strong as tariffs heat up again
Hey everyone, let's comment on the gold price next week from May 26, 2025 to May 30, 2025,
📌 Driving Events
Gold prices resumed their upward momentum on Friday, surging nearly 2% on the day and up more than 5% for the week as the dollar weakened amid renewed trade tensions. Gold prices rebounded from an intraday low of $3,287 to $3,359 as escalating rhetoric from Washington fueled investor demand for safe-haven assets.
U.S. President Donald Trump has intensified the trade standoff with the European Union, declaring that negotiations are "going nowhere" and threatening to impose a 50% tariff on EU imports from June 1. For months, Fed policymakers have made it clear that they want more clarity on the response from fiscal and trade policies and the economy before taking further action on interest rates. Over the past month, this cautious stance has prompted traders to withdraw their bets on a rate cut in the June meeting, and the market now expects the policy pause to continue until the July meeting. However, futures market positions show that the probability of a rate cut before the end of September is still slightly above 50%. This is essentially a bet that the situation will become clearer in the next four months: either slowing inflation paves the way for policy easing, or the economic deterioration forces the Fed to increase stimulus.
📊Comment Analysis
Tariff news has begun to heat up again, and the United States and the rest of the world have not yet reached a consensus on negotiations, and gold prices have benefited from this rise. The big time frame shows that the price is breaking out and continuing the upward trend
Technical:
Based on the resistance and support levels of gold on the 4-hour chart, Labaron has identified the following important key areas:
Resistance: $3412, $3436
Support: $3315, $3280, $3245
⭐️ Note: Labaron hopes that traders can properly manage their funds
- Choose a lot size that matches your funds
- Profit is 4-7% of the capital account
- Stop loss is 1-3% of the capital account

GOLD D1 chart update for the 26-30 May weekkindly read level carefully as market on it's way to ATH but keep in mind downside some major retracements are remains pending
Right all eyes on 3330 level if market successfully sustain below 3330 then it will definitely move towards 3300 or even 3280 and then 3250
Main levels for the week 3400 \ 3250 \ 3308

Gold Gearing Up for a Breakout – Bullish Setup on the 4H ChartI'm currently bullish on Gold (XAU/USD) in the short to medium term, based on the 4-hour chart structure and key technical levels.
🔍 Technical Breakdown
✅ Key Support Zone:
Price recently respected the $3,204.97 level, which has proven to be a key support area on the 4H chart. This level has held strong after multiple tests, forming a solid base for potential upward movement.
✅ Resistance / TP1:
The first significant resistance level lies at $3,435.13. This is a previous supply zone where price faced selling pressure. If bullish momentum sustains, this will be my first take-profit (TP1) level.
✅ Resistance TP2:
Should the price break above TP1 with strong volume, the next major resistance is around $3,497.61, which will act as TP2 for this long setup.
📊 Trade Setup
• Entry Zone: Around $3,328–$3,333
• Stop Loss: Below recent swing low at $3,263.26
• Take Profits:
TP1: $3,435.13
TP2: $3,497.61
🔁 Risk-Reward Ratio: ~2.32
This setup offers a favorable R:R with a potential gain of 4.91% vs. a risk of 2.12%.
📉 BBTrend Indicator Confirmation
The BBTrend histogram has started turning green again, indicating a shift in momentum toward the bulls. This transition often aligns with the early phase of upward movement, supporting a potential continuation of the trend.
🧠 Conclusion
The market structure shows higher lows forming after a strong support retest, signaling a bullish reversal. A break and close above $3,333 would further validate the bullish thesis. As long as the support at $3,204.97 holds, I remain optimistic about Gold retesting higher resistance zones.
🟩 Bias: Bullish
📅 Timeframe: 4H
⚠️ Note: Always manage your risk and confirm entries with your own strategy.

Gold surged then fell below 3300! 3255-3265 is now the bull-bear📈Today, riding the wave of its prior rally, gold skyrocketed to a high of around 3345! However, the market had a plot twist 📉—as of now, the precious metal has plunged back below the 3300 mark, bottoming out near 3285. If it breaks beneath 3280, watch out! ⚠️ It might charge towards the lower 3255-3265 range next.
The 3255-3265 zone is like a multi-functional checkpoint 🚦: it's not just the current daily moving average support, but also a crucial historical pivot point. What's even more interesting? During gold's recent upward surge, this very range acted as a tough resistance wall 🛡️, making every breakthrough attempt a nail-biter!
Gold Trading Strategies
sell@3285-3290
tp:3255-3260
buy@3255-3265
tp:3300-3310
Professional trading strategies are pushed daily 📊
Lock in precise signals amid market fluctuations 🚀
Confused about market trends? Stuck in strategy bottlenecks?
Real-time strategies serve as your "trading compass" 🌐
From trend analysis to entry/exit points, dissect market logic comprehensively
Refer now 📲
Help you move steadily forward in investments ✨
👇👇👇

5/22 Gold Trading SignalsGood afternoon everyone!
Yesterday's trading session was a bit bumpy, but in the end, we achieved considerable profits.
Today, gold rose to around 3346 and then began to pull back. It is now approaching the 3300 support level.
🔍 From a technical perspective, the candlestick structure and several indicators suggest that bears may still attempt further downside:
Primary support area: 3288–3276 — if this holds, a rebound is expected, with resistance around 3309–3316.
Secondary support area: 3263–3248 — if it breaks lower, watch for a short-term bounce around 3276-3282.
📰 On the news front, Initial Jobless Claims and PMI data will be released today. These could trigger short-term volatility.
📌 Trading strategy for today includes two key scenarios:
If the data is bearish for the dollar and gold drops to 3253, look for buy opportunities.
If the data is bullish and gold rises to 3358, it's a good spot to sell into strength.
📈 Today’s Trading Recommendations:
📉 Sell near 3358–3372 (Resistance zone)
📈 Buy near 3263–3248 (Support zone)
🔁 Flexible intraday levels: 3253 / 3268 / 3277 / 3286 / 3298 / 3309 / 3316 / 3328 / 3348
Wishing everyone a smooth trading day. Feel free to leave a comment if you have any questions—I’ll get back to you as soon as possible.

XAU USD NEXT POSSIBLE MOVE WITH SO MUCH UP AND DOWNIn hourly time frame it takes rejection and after opening session we can see two scenarios...
After opening new session if it comes down then tgt: 3385, from here have 90% chances to reverse for tgt: 3340, if it will not reverse and continue down side then we can go for the tgt:3275 to 3209

XAUUSD DESCENDING CHANNEL IN 15MXAUUSD CHART ANALYSIS IN 15M
Price Movement
The chart shows a descending channel (highlighted in blue), indicating a downtrend.
Gold price has been making lower highs and lower lows, consistent with a bearish pattern
Trend Analysis
The channel indicates that sellers are in control, pushing prices gradually lower.
Until there’s a breakout above the upper boundary of the channel, the bias remains bearish.

Gold is on bull or bear, let's see how it goes? {21/05/2025}Educational Analysis says that XAUUSD may give countertrend opportunities from this range, according to my technical analysis.
Broker - Pepperstone
So, my analysis is based on a top-down approach from weekly to trend range to internal trend range.
So my analysis comprises of two structures: 1) Break of structure on weekly range and 2) Trading Range to fill the remaining fair value gap
Let's see what this pair brings to the table for us in the future.
Please check the comment section to see how this turned out.
DISCLAIMER:-
This is not an entry signal. THIS IS FOR EDUCATIONAL PURPOSES ONLY.
I HAVE NO CONCERNS WITH YOUR PROFIT OR LOSS,
Happy Trading, Fx Dollars.

Ready to Rob the Gold Market? XAU/USD Heist Plan Revealed!🌟 Gold Heist Masterplan: XAU/USD Profit Raid 🚀💰
Thieves and profit hunters! 🤑 Ready to raid the XAU/USD gold market? This *Thief Trading Style* fuses sharp technicals with key fundamentals for a slick long-entry plan targeting the high-stakes Red Zone. Let’s grab those gains! 📈🎯
**Entry Plan 📈**
Strike when the breakout hits! Watch for a Moving Average crossover at 3380.00 to jump in for bullish profits. 🔔
- Set *buy stop orders* above the MA for breakout trades.
- Prefer pullbacks? Place *buy limit orders* at recent swing low/high on 15M or 30M timeframes.
📌 *Tip*: Set a chart alert to catch the breakout candle in action! 🚨
**Stop Loss 🛑**
Guard your stash with a *Thief SL* at the recent 4H swing low/high (3200.00).
Tweak your SL based on risk tolerance, lot size, and open orders. Stay alert! 🔍
**Profit Target 🎯**
Aim high for 3680.00, or lock in gains early to avoid overplaying your hand. Stay disciplined! 💪
**Scalper’s Edge 👀**
Scalpers, stick to quick long-side trades. Big players can dive in now; smaller traders, ride the swing with a trailing SL to secure profits. 💰
**Market Pulse 💵**
XAU/USD is charging bullish, driven by macro trends, COT data, sentiment, quantitative signals, and intermarket flows. Keep your eyes on fast-moving fundamentals! 🌎📊
**Latest Market Snapshot (UTC+1, May 21, 2025)**
- *Forex (XAU/USD)*: Hovering around 3155.00, testing key 200-day SMA support after a 2%+ sell-off.
- *COT Report (May 16, 2025)*: Non-commercial net long positions up by 5,200 contracts, reflecting strong bullish sentiment among speculators.
- *Commodities & Metals*: Gold stabilizing near monthly lows; oil prices steady, supporting commodity-linked currencies.
- *Indices & Crypto*: Risk-on sentiment in global indices aligns with bullish XAU/USD bias; crypto inflows up $785M last week.
**Trading Caution 📰**
Steer clear of new trades during major news to avoid volatility spikes.
Use trailing stops to protect open positions and lock in profits. 🚫
**Power Up the Heist! 💥**
Smash that Boost Button to fuel our trading crew! 🤝 With the *Thief Trading Style*, we’re snatching profits daily. Watch for the next plan! 🐱👤🚀
Happy trading, and let’s stack that cash! 💸🎉

5/20 Gold Trading SignalsGood afternoon, everyone!
Last Friday and yesterday, gold did not reach our primary buy or sell zones, instead moving within a narrow range. We captured two trades, gaining about $32 in total movement, resulting in moderate but stable profits.
After opening today, the price pulled back toward the 3200 area, which holds technical support. However, resistance remains dense above, especially between 3226 and 3243. For bulls to break through, stronger momentum and volume will be required.
On the news front, there are no major economic events or key speeches scheduled today, so technical trading will dominate.
Currently, gold continues to consolidate. If intraday volatility remains limited, traders can look to buy low and sell high within the 3243–3189 range. Watch for resistance around 3226 and support at 3198 as key technical levels.
📌 Trading Strategy for Today:
🟢 Buy Zone: 3189 – 3168 (Near support, suitable for bottom fishing)
🔴 Sell Zone: 3267 – 3288 (Close to resistance, good for shorting)
🔄 Scalping/Flexible Zones:
▫️3198-3218-3226-3238-3247-3255
📌 Note: Maintain proper position sizing, set clear take-profit/stop-loss levels, and stay flexible. If there's unexpected news or a breakout during the U.S. session, strategies will be adjusted accordingly.

GOLD - WAITING FOR BREAK OUTOverall Price is still bearish, however, we may get short term buy opportunity as well.
Trade idea 1: SELL below 3207
Trade idea 2: BUY above 3225
Please note these trade ideas are for 100-200 pips target only.
Once trade is activated, I will update SL too.
Share your opinion below, Thank you.

Gold fell below 3,200 today?
📌 Driving Events
In early Asian trading on Tuesday, gold prices (XAU/USD) fell slightly to around $3,230, affected by a slight rebound in the US dollar (USD). However, continued concerns about the health of the US economy - especially after Moody's recent credit rating downgrade - may help limit further downside for precious metals. The rebound in the US dollar has curbed the upward momentum of dollar-denominated assets such as gold. Nevertheless, heightened economic uncertainty is still supporting safe-haven demand. Moody's downgraded the US sovereign rating from "Aaa" to "Aa1" on Friday, citing its rising debt levels and interest payments that have exceeded other similarly rated countries. These developments have kept risk sentiment fragile and provided potential support for gold prices.
📊Comment Analysis
Accumulating along the upper and lower trend lines, the gold price will break out and require more liquidity than the downward trend
💰Strategy Package
🔥Sell Gold Zone: 3224-3226 SL 3230 Scalping
TP1: $3215
TP2: $3208
TP3: $3200
🔥Sell Gold Zone: 3276-3278 SL 3283 Scalping
TP1: $3260
TP2: $3250
TP3: $3240
🔥Buy Gold Zone: $3152 - $3150 SL $3145
TP1: $3165
TP2: $3180
TP3: $3195
⭐️ Note: Labaron hopes that traders can properly manage their funds
- Choose the number of lots that matches your funds
- Profit is 4-7% of the capital account
- Stop loss is 1-3% of the capital account

Gold Analysisi am taking short position on gold looks promising here but risky
you guys manage your risk accordingly

GOLD(1H)📌 Gold Analysis (XAU/USD) - Key 1H Levels
🔍 Critical Zones:
▫️ Resistance: $3265
▫️ Support: $3120
▫️ Trend: Short-term bullish above $3120
⚡️ Trading Plan:
• Entry Zone: $3120-$3155
• Target: $3325 | SL: $3120
• Risk: Max 1% capital
💬 Engagement:
"Which scenario do you think is more likely?
1) Break above $3348
2) Rejection from $3320
Comment your answer! ↓"
