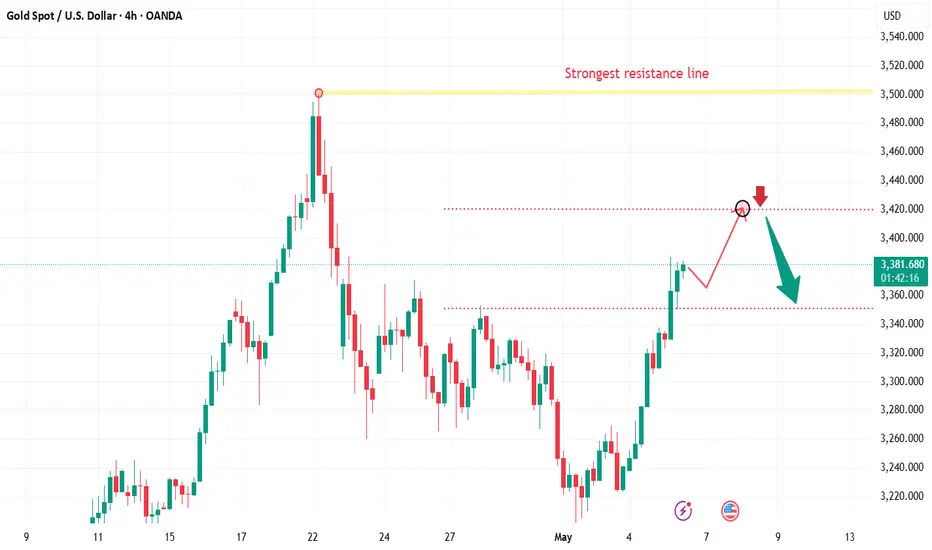
Gold could reach 3420 today
📌 Gold Drivers
Gold prices (XAU/USD) retreated slightly from intraday highs near two-week highs hit during the Asian session on Tuesday, but still held steady near $3,360, extending gains for a second day in a row. Improved U.S. economic data helped ease market concerns about a recession, providing mild support for the dollar. At the same time, signs that Sino-U.S. trade tensions may ease curbed gold's safe-haven demand, prompting some investors to take a wait-and-see approach ahead of the much-anticipated two-day Federal Open Market Committee (FOMC) policy meeting.
The Trump administration's imposition of tariffs of up to 25% or even 100% on semiconductors will further disrupt the global semiconductor supply chain, forcing many semiconductor manufacturers to look for alternative sources of supply or manufacture in the United States.
📊Comment Analysis
Bulls regained their dominance, and the upward trend approached 3400 before the market expected a rate cut
💰Strategy Set
🔥Sell Gold Area: 3418-3420 SL 3425
TP1: $3410
TP2: $3400
TP3: $3385
🔥Buy Gold Area: $3323 - $3321 SL $3316
TP1: $3330
TP2: $3340
TP3: $3358
⭐️ Note: Labaron hopes that traders can properly manage their funds
- Choose the number of lots that matches your funds
- Profit is 4-7% of the fund account
- Stop loss is 1-3% of the fund account
Xauusdsetup
GOLD Price Analysis: Key Insights for Next Week Trading DecisionGold ended last week under pressure as investors booked profits following improved risk appetite, driven by easing trade tensions and a strong U.S. labor market report.
📰 NFP came in at +177K in April, with the unemployment rate steady at 4.2%, matching forecasts—possibly keeping the Fed cautious on policy easing.
Technically, Gold remains bullish but is now testing the $3,200 support zone, and sellers are gaining momentum.
As we head into next week, gold price action is at a critical decision point, and whether buyers or sellers will take control is unclear.
In this video, I break down the key technical zones, share my trading plan, and discuss potential opportunities to help navigate the uncertainty ahead.
Disclaimer:
This is my take based on experience and what I see on the charts. It’s not financial advice—always do your research and consult a licensed advisor before trading.
#GoldAnalysis #XAUUSD #GoldPrice #ForexTrading #TechnicalAnalysis #FundamentalAnalysis #GoldOutlook #FedRateDecision #NFP #GoldBreakdown #GoldBulls #GoldBears #USJobsReport #ForexMentor

Gold is once again affected by tariffs and rises sharplyNews: Gold rose sharply, mainly because Trump announced a 100% tariff on all films produced abroad and entering the United States, which once again triggered global trade tensions. At the same time, the conflict between Russia and Ukraine is still ongoing, and the situation in the Middle East has become tense again. For example, Israel’s missile attacks retaliated against the Houthi armed forces in Yemen and Iran. These have stimulated gold’s safe-haven properties and pushed up gold prices.
Technical aspect: Gold bulls are strong, so there is a certain risk in shorting gold. The point of concern below is the low of 3323. If gold continues to maintain its strength, it is impossible to fall below the 3323 line again.
Trading ideas: Buy gold near 3338, stop loss 3330, target 3360

Gold breaks through 3350. Can the bullish pattern continue?In the early Asian session, gold rose rapidly and broke through the 3350 resistance level predicted by Quaid.
Fundamental analysis:
US political developments also add uncertainty to the market. The Trump administration's decision to impose a 100% tariff on imported films shocked the market, and this unpredictable trade policy weakened market confidence. Although the dollar was supported by strong employment data, it still struggled to gain substantial upward momentum, which further supported gold prices.
Economic uncertainty also boosted gold prices. The market generally expects the Federal Reserve to start a rate cut cycle in the near future, which weakens the attractiveness of interest-bearing assets and increases the relative value of non-yielding gold. However, many traders remain cautious and avoid building large positions, waiting for clearer policy signals.
Technical analysis interpretation:
From the monthly chart analysis, gold breaking through the neckline becomes a key trigger point. The pattern measures the depth from the neckline to the bottom of the head and projects it upward, giving a target price range of $3200-3300, which has now been achieved.
In addition, the pattern is not only technically strong, but also psychologically significant. A breakout after a long period of consolidation often attracts new long-term market participants and speculators.
Market Observation:
Current market sentiment is cautiously optimistic. On the one hand, macro uncertainty and risk aversion demand drive funds to the gold market; on the other hand, concerns about the timing and magnitude of the Fed's policy adjustments restrict the willingness of some bulls to take risks.
Quaid Analysis:
Bull Outlook
After the gold price breaks through the 3350 resistance level I predicted, the next target range may point to 3380-3400.
Short Outlook
In the short term, gold may face technical pullback pressure. The main support levels are at 3330 and 3300. If it falls below 3300, it may trigger a deeper pullback to around 3240.
Quaid believes that the market's expectations for the Fed's shift may be too optimistic. If future data show that inflationary pressure remains stubborn or economic resilience exceeds expectations, it may lead to a delay in expectations for rate cuts, thereby putting pressure on gold prices.

XAU/USD "The Gold" Metals Market Heist Plan (Swing/Day Trade)🌟Hi! Hola! Ola! Bonjour! Hallo! Marhaba!🌟
Dear Money Makers & Robbers, 🤑 💰💸✈️
Based on 🔥Thief Trading style technical and fundamental analysis🔥, here is our master plan to heist the XAU/USD "The Gold" Metals Market. Please adhere to the strategy I've outlined in the chart, which emphasizes long entry. Our aim is to escape near the high-risk ATR Zone. Risky level, overbought market, consolidation, trend reversal, trap at the level where traders and bearish robbers are stronger. 🏆💸"Take profit and treat yourself, traders. You deserve it!💪🏆🎉
Entry 📈 : "The heist is on! Wait for the NEUTRAL LEVEL breakout (3400) then make your move - Bullish profits await!"
however I advise to Place Buy stop orders above the Moving average (or) Place buy limit orders within a 15 or 30 minute timeframe most recent or swing, low or high level for Pullback entries.
📌I strongly advise you to set an "alert (Alarm)" on your chart so you can see when the breakout entry occurs.
Stop Loss 🛑: "🔊 Yo, listen up! 🗣️ If you're lookin' to get in on a buy stop order, don't even think about settin' that stop loss till after the breakout 🚀. You feel me? Now, if you're smart, you'll place that stop loss where I told you to 📍, but if you're a rebel, you can put it wherever you like 🤪 - just don't say I didn't warn you ⚠️. You're playin' with fire 🔥, and it's your risk, not mine 👊."
📍 Thief SL placed at the recent/swing low level Using the 4H timeframe (3200) Day trade basis.
📍 SL is based on your risk of the trade, lot size and how many multiple orders you have to take.
🏴☠️Target 🎯: 3680 (or) Escape Before the Target
🧲Scalpers, take note 👀 : only scalp on the Long side. If you have a lot of money, you can go straight away; if not, you can join swing traders and carry out the robbery plan. Use trailing SL to safeguard your money 💰.
💰💵💴💸XAU/USD "The Gold" Metals Market Heist Plan (Day / Swing Trade) is currently experiencing a Neutral trend (there is a chance to move bullishness🐂).., driven by several key factors.👆👆👆
📰🗞️Get & Read the Fundamental, Macro economics, COT Report, Geopolitical and News Analysis, Sentimental Outlook, Intermarket Analysis, Index-Specific Analysis, Positioning and future trend targets with Overall Score...... go ahead to check👉👉👉🔗🔗🌎🌏🗺
⚠️Trading Alert : News Releases and Position Management 📰 🗞️ 🚫🚏
As a reminder, news releases can have a significant impact on market prices and volatility. To minimize potential losses and protect your running positions,
we recommend the following:
Avoid taking new trades during news releases
Use trailing stop-loss orders to protect your running positions and lock in profits
💖Supporting our robbery plan 💥Hit the Boost Button💥 will enable us to effortlessly make and steal money 💰💵. Boost the strength of our robbery team. Every day in this market make money with ease by using the Thief Trading Style.🏆💪🤝❤️🎉🚀
I'll see you soon with another heist plan, so stay tuned 🤑🐱👤🤗🤩

XAU/USD "The Gold" Metal Market Heist Plan (Day Trade)🌟Hi! Hola! Ola! Bonjour! Hallo! Marhaba!🌟
Dear Money Makers & Robbers, 🤑💰✈️
Based on 🔥Thief Trading style technical and fundamental analysis🔥, here is our master plan to heist the XAU/USD "The Gold" Metal Market. Please adhere to the strategy I've outlined in the chart, which emphasizes short entry. Our aim is the high-risk GREEN MA Zone. Risky level, oversold market, consolidation, trend reversal, trap at the level where traders and bullish robbers are stronger. 🏆💸"Take profit and treat yourself, traders. You deserve it!💪🏆🎉
Entry 📈 : "The heist is on! Wait for the Neutral Level breakout then make your move at (3260.00) - Bearish profits await!"
however I advise to Place sell stop orders above the Moving average (or) after the Support level Place sell limit orders within a 15 (or) 30 minute timeframe most NEAREST (or) SWING low or high level for Pullback entries.
📌I strongly advise you to set an "alert (Alarm)" on your chart so you can see when the breakout entry occurs.
Stop Loss 🛑: "🔊 Yo, listen up! 🗣️ If you're lookin' to get in on a sell stop order, don't even think about settin' that stop loss till after the breakout 🚀. You feel me? Now, if you're smart, you'll place that stop loss where I told you to 📍, but if you're a rebel, you can put it wherever you like 🤪 - just don't say I didn't warn you ⚠️. You're playin' with fire 🔥, and it's your risk, not mine 👊."
📌Thief SL placed at the nearest/swing High or Low level Using the 3H timeframe (3360.00) Day/Scalping trade basis.
📌SL is based on your risk of the trade, lot size and how many multiple orders you have to take.
Target 🎯: 3170.00 (or) Escape Before the Target
💰💵💸XAU/USD "The Gold" Metal Market Heist Plan (Scalping/Day Trade) is currently experiencing a Bearish trend.., driven by several key factors.👇👇👇
⚠️Trading Alert : News Releases and Position Management 📰 🗞️ 🚫🚏
As a reminder, news releases can have a significant impact on market prices and volatility. To minimize potential losses and protect your running positions,
we recommend the following:
Avoid taking new trades during news releases
Use trailing stop-loss orders to protect your running positions and lock in profits
💖Supporting our robbery plan 💥Hit the Boost Button💥 will enable us to effortlessly make and steal money 💰💵. Boost the strength of our robbery team. Every day in this market make money with ease by using the Thief Trading Style.🏆💪🤝❤️🎉🚀
I'll see you soon with another heist plan, so stay tuned 🤑🐱👤🤗🤩

XAUUSD is ready to FALL monthly target 3000!Through my weekly Episode multi time frame analysis , you will get deep insights .
Market in on rising channel since last year and did not respect the 2900 milestone after breaking it.
is it the time to retracement?
our eyes will be at 2980 milestone on this next 2weekly candles.
bearish scenario:
if any h4,D1 close below 3160 stay bearish side and our setup.
bullish scenario
if market again surpass 3280 then buying up to 3330 then 3360 where we have again selling sequence to 3000 milestone.
I'm expecting the bullish scenario I have mention will not activated.

XAU/USD "The Gold" Metal Market Heist Plan (Scalping / Day)🌟Hi! Hola! Ola! Bonjour! Hallo! Marhaba!🌟
Dear Money Makers & Robbers, 🤑💰✈️
Based on 🔥Thief Trading style technical and fundamental analysis🔥, here is our master plan to heist the XAU/USD "The Gold" Metal Market. Please adhere to the strategy I've outlined in the chart, which emphasizes long entry and short entry. 🏆💸Be wealthy and safe trade.💪🏆🎉
Entry 📈 :
"The loot's within reach! Wait for the breakout, then grab your share - whether you're a Bullish thief or a Bearish bandit!"
🏁Buy entry above 3060
🏁Sell Entry below 3000
📌However, I recommended to place buy stop for bullish side and sell stop for bearish side.
Stop Loss 🛑:
🚩Thief SL placed at 3020 for Bullish Trade
🚩Thief SL placed at 3040 for Bearish Trade
Using the 30mins period, the recent / swing low or high level.
SL is based on your risk of the trade, lot size and how many multiple orders you have to take.
Target 🎯:
🏴☠️Bullish Robbers TP 3140 (or) Escape Before the Target
🏴☠️Bearish Robbers TP 2970 (or) Escape Before the Target
XAU/USD "Gold vs U.S Dollar" Metals Market Heist Plan is currently experiencing a neutral trend,., driven by several key factors.
📰🗞️Get & Read the Fundamental analysis, Macro Economics, COT Report, Seasonal factors, Sentimental Outlook, Positioning and future trend.....👉👉👉
⚠️Trading Alert : News Releases and Position Management 📰 🗞️ 🚫🚏
As a reminder, news releases can have a significant impact on market prices and volatility. To minimize potential losses and protect your running positions,
we recommend the following:
Avoid taking new trades during news releases
Use trailing stop-loss orders to protect your running positions and lock in profits
💖Supporting our robbery plan 💥Hit the Boost Button💥 will enable us to effortlessly make and steal money 💰💵. Boost the strength of our robbery team. Every day in this market make money with ease by using the Thief Trading Style.🏆💪🤝❤️🎉🚀
I'll see you soon with another heist plan, so stay tuned 🤑🐱👤🤗🤩

Is the gold market ushering in betting?
📌 Gold driving factors
There are two aspects to look at the impact of April non-agricultural data on the gold market.
One is the data itself and the existing economic environment, and the other is combined with the technical aspect.
The market itself is troubled by the tariff issue. Whether it is the US stock market or the US dollar, it needs good economic data to boost it. Once the April non-agricultural performance is poor, the market sell-off will be out of control, and it also means that the risk of US economic recession is increasing.
Secondly, good data performance reduces the Fed's expectations for rate cuts. As we all know, the Fed's expectations for rate cuts or rate cuts are theoretically good for gold prices, and vice versa.
The cooling of the tariff issue may come soon, which is also not conducive to the rise in gold prices, but cooling does not mean the end, and the final achievement will definitely take some time.
📊Comment Analysis
"After experiencing short-term fluctuations, the price of gold appears to be relatively stable around $3,250. If it is to rise further, it must break through the $3,300 mark. But whether the market is ready to break through this point remains to be seen."
At present, gold is still in a continuous adjustment trend. Although it retreated to the 3,200 line on Friday and then rose again, it is still under pressure below the opening of the 3,265 decline. This is also the pressure level we need to pay close attention to next Monday!
The sideways trading period on Friday is long enough, and it is time for a breakthrough. So how should we arrange the market next week? It should not rise, but it will fall instead. It is not difficult to understand the trend on Friday. If it rises in the morning next week, it should be noted that the upper 3,265 is the watershed. If it breaks through, it will continue to rise, but if it is still under pressure, it is our opportunity to enter the short position!
💰Strategy Package
Operation ideas for next week:
Short at 3265 gold, stop loss at 3275, target 3230-3220;.
The market fluctuates violently, and real-time entry and exit are mainly based on real-time guidance!
⭐️ Note: Labaron hopes that traders can properly manage their funds
- Choose the number of lots that matches your funds
- Profit is 4-7% of the fund account
- Stop loss is 1-3% of the fund account

XAUUSD Potentially ShortOANDA:XAUUSD Retesting the broken support of the consolidation phase, a close below that area will signify a shorting opportunity.
Fingers crossed

This is a 4H chart of XAU/USD with multiple SMC annotations. 1. Chart Analysis Using Smart Money Concepts (SMC)
SMC Structure Identified:
• Major Break of Structure (BoS): Occurred above 3,240 → confirmed bullish intent.
• Major Change of Character (CHoCH): Happened around 3,320 (last demand broken), indicating bearish shift.
• FVG (Fair Value Gap): Marked just below the last day high — partially filled and then rejected.
• Liquidity: Equal highs and lows around 3,327 and 3,200 respectively — potential liquidity targets.
⸻
2. Marked Points in Chart
• Last Day High / Low and Day High / Low are marked.
• 50% Day Range at approx. 3,274 — currently acting as intraday resistance.
• OB Zone around 3,214–3,218 (a critical support zone that may act as re-entry or rejection point).
• FVG Zone near 3,284 — unmitigated imbalance that price could revisit.
⸻
3. Swing High & Low of the Day
• Swing High: ~3,327.72 (day/session high).
• Swing Low: ~3,214.31 (day/session low).
• These define the current internal liquidity pool.
⸻
4. Trade Direction
• 4H Trend: Bearish, post CHoCH and major OB break.
• Bias: Bearish, as price is below FVG and below 50% of the daily range. OB is being respected and lower highs are forming.
• Intra-Day Opportunity: Possible short setups unless price closes strongly above 3,284–3,287 zone.
⸻
5. Best Risk-Reward Setup (Swing/Intraday)
Scenario: Price retests FVG/OB at 3,284–3,287 and rejects.
• Entry: 3,284.00 (inside FVG)
• SL: 3,288.50 (above supply zone & equal highs)
• TP1: 3,214.00 (last day low)
• TP2: 3,200.00 (liquidity sweep & OB retest zone)
• RRR:
• To TP1: ~1:3
• To TP2: ~1:4.5
⸻
6. Trade Setups by Timeframe
5-Minute Setup:
• Look for CHoCH near 3,284.00 zone.
• Entry: On bearish engulfing or internal BOS.
• SL: Above 3,288.00.
• TP: 3,214.00 (previous low).
1-Hour Setup:
• Wait for 1H candle rejection at FVG or last day’s high.
• Entry: 3,284–3,287.
• SL: 3,290.
• TP1: 3,214.00.
• TP2: 3,200.00.
4-Hour Setup:
• Use higher timeframe OB for re-entry.
• Look for price closing below 3,214.00 → opens short continuation toward 3,160 or deeper (OB at 3,100).
• Swing Trade Setup: Short from 3,284.00 → SL 3,290 → TP 3,100–3,080 (RRR: ~1:6).
⸻
7. CRT Model Evaluation
• C – Context: HTF structure shifted bearish after CHoCH; price rejected FVG and supply zones.
* R – Retracement: Price retraced into OB and FVG in premium, providing a sell opportunity.
• T – Trend Continuation: If 3,214 breaks cleanly, expect continuation toward 3,160 and possibly 3,100.
⸻
Summary
• Bias: Bearish under 3,284–3,287 zone.
• Key Levels to Watch:
• Resistance: 3,284–3,287 (FVG + OB).
• Support: 3,214–3,200 (liquidity pool + OB).
• Best Trade: Short from FVG zone on confirmation with TP at day low and deeper OBs.

3236 becomes the dividing line between long and shortGold 3243 is the watershed between long and short positions. As long as this point is not broken, shorting at highs is still the main theme. You can continue to arrange short positions based on the suppression of 3236. The 3195-3190 area below is an important support. If the market retreats to this area, you can consider going long based on the actual situation and seize the opportunity of long-short conversion.

#XAUUSD: Major Update 01/05/2025, Read Description! Gold has dropped over 700 pips since yesterday evening, suggesting further price correction. This is primarily due to strong US dollar data indicating potential correction in DXY Index prices. Additionally, there are speculations that the US has reached out to China for trade talks, although this has not been confirmed. Today and tomorrow are major trading days, with significant news expected to shape gold prices.
For now, you can monitor the prices or take entry if they reach your chosen risk management area. The decision to enter or exit is entirely up to your analysis.
Good luck and trade safely!
Thank you for your unwavering support! 😊
If you’d like to contribute, here are a few ways you can help us:
- Like our ideas
- Comment on our ideas
- Share our ideas
Team Setupsfx_
❤️🚀

XAUUSD: Intraday Bullish Move Up To $3400! The OANDA:XAUUSD price has shown strong bullish momentum, indicating it will likely continue to rise above $3400. However, the price is currently volatile and is likely to remain so.
Good luck and trade safely!
Thank you for your unwavering support! 😊
If you’d like to contribute, here are a few ways you can help us:
- Like our ideas
- Comment on our ideas
- Share our ideas
Team Setupsfx_
❤️🚀

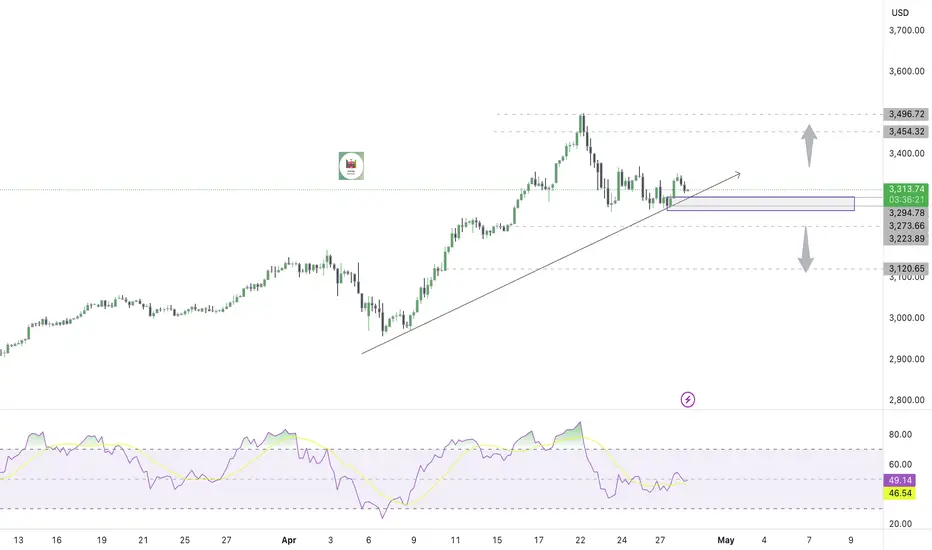
GOLD Locally Overbought!
HI,Traders !
GOLD is trading in a
Strong uptrend but the
Pair is locally overbought so
After the retest of the
Horizontal resistance level
Of 3350.56 from where
We will be expecting a
Local bearish correction !
Comment and subscribe to help us grow !

4/30 Gold Trading SignalsGold showed limited movement yesterday and did not enter either of our predefined major trading zones, leading to minimal profits.
As of now, the price continues to consolidate. A larger movement is likely to occur during the U.S. session following key economic data.
Until then, consider short-term range trading between 3330-3290.
📌 Why Today’s Data Matters
Gold has been trapped in a tight range for several sessions, and a directional breakout is imminent.
Today’s data release will likely dictate that direction, so it is crucial to stay alert.
✅ Data-Driven Strategy:
If data is bullish (gold rallies):
Avoid chasing the initial breakout. Wait for the first spike to settle, then short the retracement, with a TP of less than $10.
If bulls remain strong, the retracement should stay under $20. Once short positions are closed, watch for confirmation to go long.
If data is bearish (gold drops):
If price doesn't reach the lower buy zones(3258-3223), wait for a minor rebound to short, targeting the next leg lower.
📌 Today's Suggested Trade Zones:
🔻 Sell Zones:
3378–3418
3330–3358
🔺 Buy Zones:
3258–3223
3110–3330 (ladder entries)

Gold is still on a volatile downward trendGold continues to fluctuate in the 1-hour chart, and the amplitude of fluctuations is beginning to narrow, which indicates that a change is getting closer. As for gold's current fluctuations, it is still in a downward trend.
Trading idea: short gold near 3318, stop loss 3330, target 3300

GOLD / XAUUSD: Analysis Daily!🔷 BUY XAUUSD: 3298/3300 (swing)
- Stoploss: 3293
- Target: 3310 / 3320 / 3330 / 3350
*Signals are for reference only, not recommended to be followed!*
Analysis: XAU/USD has a neutral-to-bullish near-term outlook. On the 4-hour chart, it's struggling with a flat 20 SMA, while the 100 and 200 SMAs are risin. Indicators are improving but still weak and in negative territory.
Support levels: 3314 - 3301
Resistance levels: 3344 - 3358

4/29 Gold Trading SignalsThe buy orders initiated around 3273 yesterday have already delivered solid profits.
After a slight rally at today’s opening, gold prices have pulled back.
Currently, the candlestick formation shows no clear directional trend, while some short-term technical indicators are pointing downward.
Before any corrective signals appear, we need to closely watch the support near 3306.
As long as this level holds, the short-term bullish momentum still has a chance to continue.
On the news side, today's scheduled data releases are of minor impact.
Focus instead on developments regarding the India-Pakistan situation and US Treasury Secretary Bessent’s press conference.
If geopolitical tensions escalate, gold may break out to new highs.
🔹 Today's Trading Strategy:
Sell within 3407-3428 zone
Buy within 3258-3223 zone
Flexibly trade between 3346-3313 / 3378-3336 / 3273-3316 zones
Please manage your positions carefully and stay alert for unexpected market moves.

Xauusd Market Projection As shown in the analysis, 2297 is a key zone whi h extends down to the 2260's on the higher time frame
If those zones hold us above then bullish momentum confirmed but if it doesnt hold, bears still have the upper hand in the market
Do you agree with this analysis ?

Xauusd Market ProjectionAs shown in the analysis, 2297 is a key zone whi h extends down to the 2260's on the higher time frame
If those zones then bullish momentum confirmed but if it doesnt hold us above, bears still have the upper hand in the market
Do you agree with this analysis ?
XAUUSD: Massive Volatility, Weak Support at 3270!Last week was extremely volatile for Gold, with incredible swings that caught many traders off-guard. After reaching a new all-time high at 3500, the price dropped by more than 2000 pips in less than 24 hours!
After this crash, the market settled somewhat, and towards the end of the week, Gold established a strong ceiling around 3370 – exactly as we discussed in last week's analysis.
The key question now: Is the correction over or is there more downside coming?
At the same time, we can clearly observe a floor around 3270, a level that Gold is testing again at the time of writing.
Here’s why I believe the correction is not over yet:
- Price action remains vulnerable below 3370 resistance.
- The support at 3270 looks fragile, with pressure building for a break.
- Market volatility is still extremely high, favoring continuation moves.
Trading Plan:
I am looking to sell rallies above 3300, aiming for a target around 3200.
Due to the recent wild volatility, I will adjust my stop losses accordingly, allowing enough room for noise without exposing the position to unnecessary risk.
Disclosure: I am part of Trade Nation's Influencer program and receive a monthly fee for using their TradingView charts in my analyses and educational articles.

#XAUUSD:From Our Last Analysis 534+ Pips What Next?We published our analysis on gold on April 24th, highlighting the bullish market presence. The price indeed reversed from our zone, enabling us to make a significant move of over 234 pips. We anticipate a continuous price increase from our entry zone, potentially reaching 3500$. There are several reasons behind this belief. Firstly, the escalating war-like tension between India and Pakistan could lead to a surge in gold prices, potentially surpassing the previous high. Secondly, the heightened tensions among global investors are expected to result in an extreme bullish movement in gold prices.
Given the volatility of gold, we recommend trading cautiously and taking extra precautions while trading gold.
Wishing you good luck and safe trading!
Thank you for your support! 😊
If you’d like to contribute, here are a few ways you can help us:
- Like our ideas
- Comment on our ideas
- Share our ideas
Team Setupsfx_
❤️🚀
