XAUUSD Sell Nowthis is gold pairs and my analysis say gold down soon possible, like my analysis and share.
Xauusdsetup

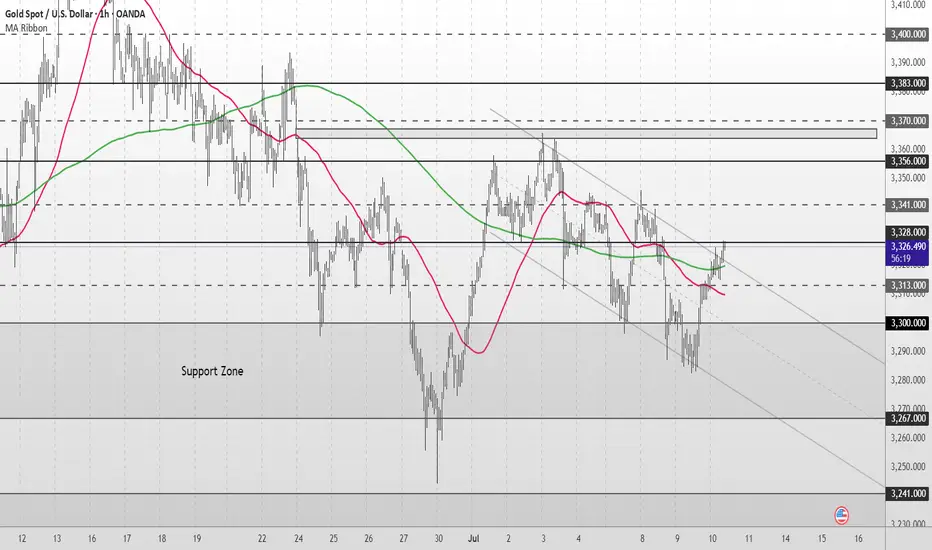
Gold Short Term OutlookGold continues its short-term recovery after bouncing from the Support Zone and reclaiming the $3,300 level. Price is now testing the $3,328 resistance zone, with both the 50MA and 200MA converging just below price.
A confirmed break and hold above $3,328 would open the door to higher resistance levels. However, failure to clear this zone could lead to a retest of the Support Zone. If that fails to hold, a deeper retracement toward the HTF Support Zone may follow.
📌 Key Levels to Watch
Resistance:
‣ $3,328
‣ $3,341
‣ $3,356
‣ $3,383
Support:
‣ $3,313
‣ $3,300
‣ $3,267
‣ $3,241
🔎 Fundamental Focus
All eyes on U.S. unemployment claims today
Expect volatility around the release – stay sharp.
Waiting for the Perfect Entry: XAUUSD Market Structure Breakdown🔍 Taking a look at XAUUSD today: it’s clearly in a downtrend 📉 on the 4H chart, with consecutive lower highs and lower lows 🔽.
📌 My bias is bearish, and I’m patiently waiting for price action to set up for an entry 🎯.
If we get a break of market structure 🧱, followed by a retest and failure of the current range high 🚫, that could present an opportunity 👀 — not financial advice ⚠️.

Gold Price Analysis - 4-Hour Chart4-hour candlestick chart for the Gold Spot price in U.S. Dollars (XAUUSD), sourced from OANDA. The chart displays the price movement over time, with green candles indicating an increase in price and red candles indicating a decrease. The chart also features various technical indicators and annotations, including a trend line and a support level.

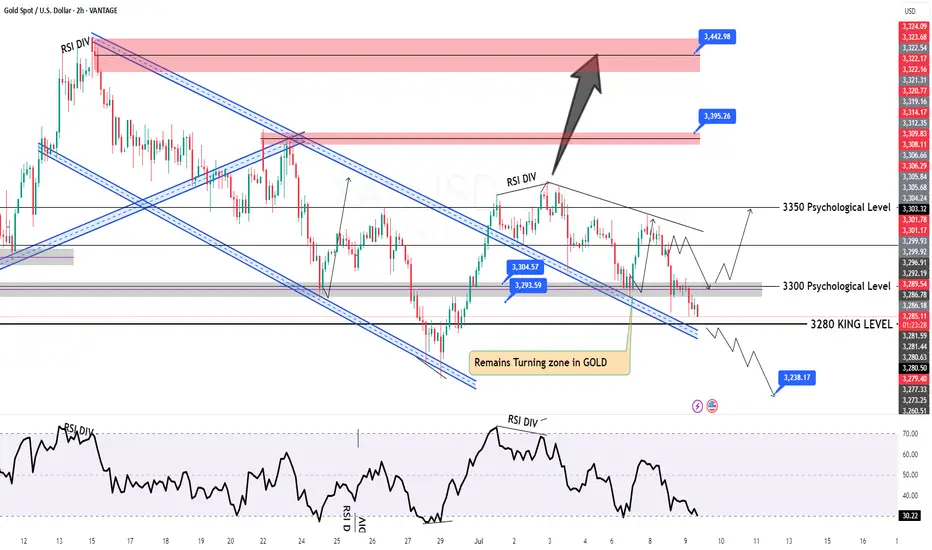
GOLD Intraday H2 Chart update for 9 July 2025Hello Traders
as you can see that we have strong resistance on 3310 level only break above that level will consider bullish move
Below 3300 Psychological level market remains Bearish and move towards 3245 level
FOMC Meeting minutes dues today
Disclaimer: Forex is Risky
XAUUSD 15Min – Bullish Reaction from Demand Zone | SMC AnalysisSmart Money Concept (SMC) Analysis
Price has tapped into a clearly defined 4H Demand Zone (highlighted in green) with multiple rejections. Prior liquidity was swept below the 3288 region, trapping early sellers and grabbing institutional interest. This is a classic liquidity grab + demand zone confluence.
🔹 Entry: 3290 – Inside Demand Zone
🔹 SL: 3282 – Below Liquidity Sweep
🔹 TP: 3320 – Targeting Last Broken Structure (Break of Structure)
🧠 Smart Money Clues:
Liquidity grab under the lows ✅
Clean rejection wick ✅
BOS (Break of Structure) above needed for confirmation
Anticipating move back to 3320.57 (blue line) – previous SMC mitigation level
🟢 If price breaks above 3300 with strong volume, more upside is likely.
#XAUUSD #GoldAnalysis #SmartMoney #SMC #DemandZone #LiquidityGrab #TradingView #ForexSignals

Gold Short Term OutlookYesterday, price failed to break above the minor resistance at $3,341, which led to a sharp sell-off into the Support Zone. The 50MA has now crossed below the 200MA, reinforcing the short-term bearish momentum.
If the Support Zone fails to hold, we could see a move toward the HTF Support Zone, with downside targets at $3,241 and $3,208.
Any short-term recovery may face resistance at $3,300–$3,328. For a more meaningful shift in sentiment, bulls must reclaim $3,328 to open the path back toward higher levels.
📌 Key Levels to Watch
Resistance:
$3,300 ‣ $3,313 ‣ $3,328 ‣ $3,341
Support: $3,267 ‣ $3,241 ‣ $3,208
🔎 Fundamental Focus
Markets are positioning ahead of Wednesday’s FOMC Meeting Minutes, which could give insights into the Fed’s internal sentiment on rate cuts.
⚠️ Stay sharp — manage your risk.

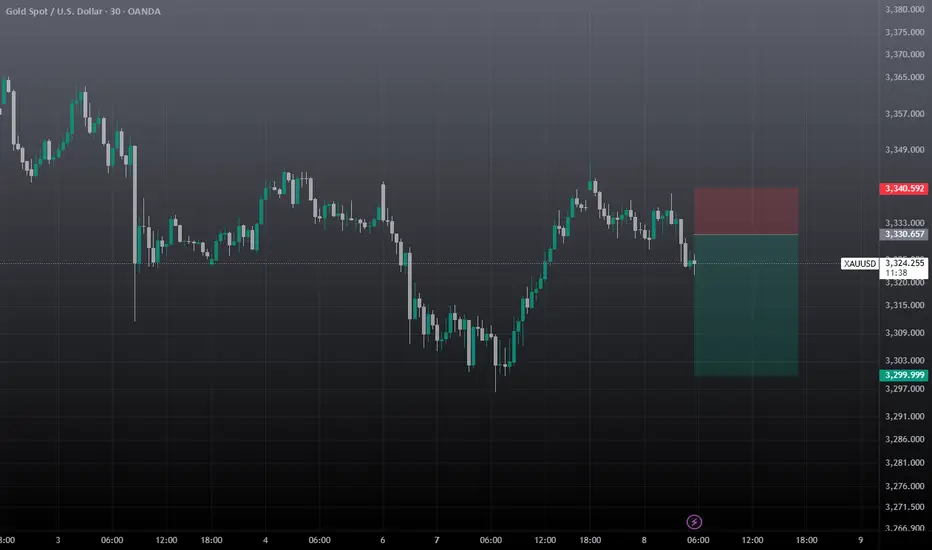
7/8: Inverse Head and Shoulders Pattern, Support at 3321–3312Good morning, everyone!
Yesterday, gold broke below the 3321 support during the session, dropped to around 3296, then staged a strong rebound back toward the opening price—forming a classic deep V-shaped reversal and regaining support above the MA60 on the daily chart.
The market remains in a consolidation phase between the MA20 and MA60 on the 1D chart, with no clear directional breakout yet.
On the 30-minute chart, the previous head-and-shoulders top pattern has been completed with the recent decline. The current structure can be tentatively viewed as the formation of a head-and-shoulders bottom.
If this bullish reversal pattern holds:
The 3321 level must act as valid support during any pullback; deeper confirmation may come from 3312, which corresponds to the previous left shoulder low. Although this was partially driven by a data-related spike, most candle bodies remained around 3321—so 3321 is the primary support, and 3312 is the backup.
If confirmed, the price may advance toward the 3360 target zone.
If the pattern fails, watch for the development of a double bottom formation, with MA60 on the daily chart remaining a key support level.
📌 For today, focus on trading within the 3312–3352 range, using a buy-low/sell-high approach, and stay flexible in response to evolving chart patterns.

XAUUSD Short / Sell Setupwait for the entry and place tp & SL, must use SL, never exceed more than 2% on SL of your portfolio on any trade. If tp is achieved first then trade setup will be invalid.
Gold Spot / U.S. Dollar (XAUUSD) 4-Hour Chart - OANDA4-hour chart from OANDA displays the price movement of Gold Spot (XAUUSD) against the U.S. Dollar. The current price is $3,805.780, reflecting a decrease of $30.660 (-0.92%). Key levels include a sell price of $3,305.390 and a buy price of $3,305.940. The chart highlights recent volatility with a shaded area indicating a potential support or resistance zone around $3,344.320. The time frame spans from late June to early July 2025, with the latest data point at 02:41:15 on July 8, 2025.

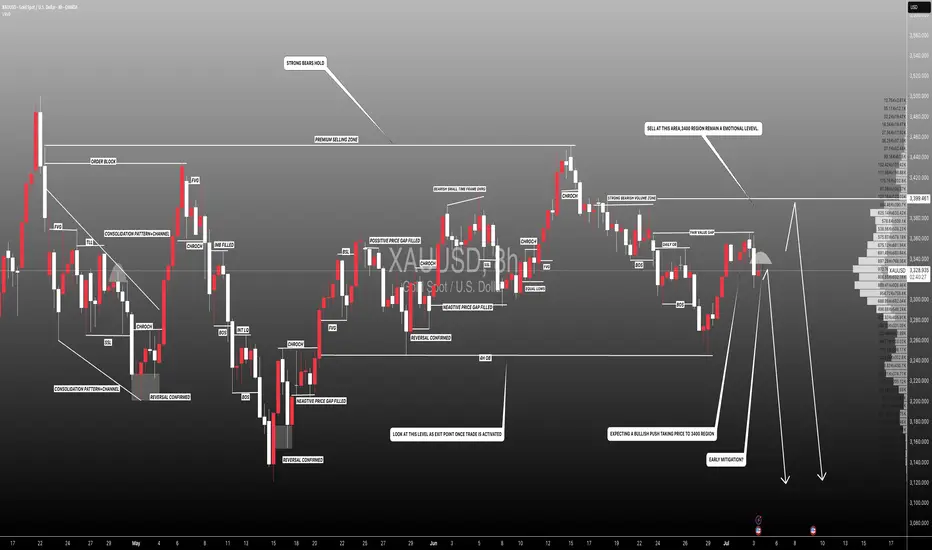
Setupsfx_ | XAUUSD(Gold):07/07/2025 Update | Gold dropped nicely when the market opened last night, dropping around 600 pips. However, it couldn’t hold on to the gains and came right back to the selling zone. There are two entry points and two potential targets.
Good luck and trade safely!
Team Setupsfx_

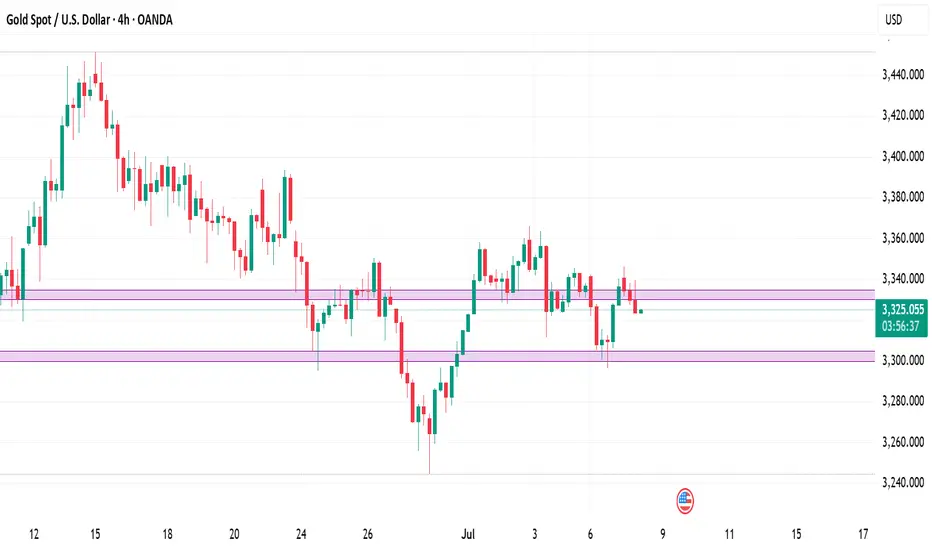
Gold Spot / U.S. Dollar (XAU/USD) 4-Hour Chart4-hour chart from OANDA displays the recent price movement of Gold Spot (XAU/USD) against the U.S. Dollar. The current price is $3,325.120, reflecting a decrease of $11.320 (-0.34%). The chart highlights a recent upward trend with a buy signal at $3,325.410 and a sell signal at $3,324.830, indicating a potential trading range. A shaded area suggests a possible price target or support/resistance zone around $3,355.478, with historical price levels marked on the right side. The timeframe covers the period around July 7-8, 2025.

4‑Hour Technical Framework- 8th July 2025Current Price: ~$3,330
Timeframe Focus: 4‑Hour and 1‑Hour
Directional Bias: Neutral-to-Bearish
Methodologies Used:
✅ Price Action, Fibonacci Levels, Support & Resistance
✅ Supply & Demand Zones
✅ ICT / Smart Money Concepts (BOS, CHoCH, Liquidity, OB, FVG)
4‑Hour Market Structure Analysis
Gold has shifted into a neutral-to-bearish regime on the 4‑hour timeframe, after a decisive Break of Structure (BOS) below prior swing lows at ~$3,345 and a clear Change of Character (CHoCH) as bulls failed to sustain above the ~$3,350 level. Price currently hovers around ~$3,330, consolidating within a bearish Fair Value Gap (FVG) left by the recent impulsive drop.
Key Observations:
A liquidity grab above $3,349 (stop sweep) preceded a sharp reversal, validating this as a sell-side liquidity zone.
The 4H supply zone / bearish Order Block (OB) at $3,345–$3,350 remains unmitigated and likely to attract sellers.
Immediate downside is cushioned by a 4H demand zone & FVG at $3,300–$3,305, which has acted as support during the prior dip.
A deeper daily demand zone rests around $3,280–$3,290, which aligns with historical support and unmitigated buy‑side liquidity.
Key 4‑Hour Levels to Watch
Price Level Type Notes
$3,360–$3,365 Supply / Fib 61.8% Strong resistance
$3,345–$3,350 Supply / OB + 50% Fib Primary sell zone
$3,330–$3,334 Bearish FVG Active imbalance
$3,300–$3,305 Demand / FVG Primary buy zone
$3,280–$3,290 Demand (daily OB) Secondary buy zone
The neutral-to-bearish bias is reinforced by the fact that price has failed to reclaim prior support and continues to respect supply zones.
1‑Hour Intraday Trade Ideas
Zooming into the 1‑hour chart, we align intraday setups with the broader 4H directional bias: selling into supply and covering into demand.
Setup 1: Short at 4H Imbalance
Entry: ~$3,332–$3,334 (inside active FVG)
Stop-Loss: Above $3,335
Targets:
TP1: $3,305
TP2: $3,280
Confluences: BOS + CHoCH, 4H FVG, sell‑side liquidity above.
Setup 2: Short on Retracement
Entry: ~$3,345–$3,350 (50% Fib + OB)
Stop-Loss: Above $3,352
Targets: Same as Setup 1.
Setup 3: Aggressive Long (Countertrend)
Entry: ~$3,300–$3,305 (demand + FVG)
Stop-Loss: Below $3,295
Target: $3,327
Note: Only valid if strong bullish reaction occurs in demand.
The Golden Setup
Sell at ~$3,332–$3,334 (active 4H imbalance) with a target of $3,300.
This setup offers maximum confluence — bearish FVG, BOS, and supply rejection — with tight risk parameters and favorable reward/risk ratio.
Summary Table
Bias Levels of Interest
Directional Bias Neutral-to-Bearish
Strong Sell Zones $3,330–$3,334 and $3,345–$3,350
Strong Buy Zones $3,300–$3,305 and $3,280–$3,290
Closing Notes
Gold continues to respect Smart Money footprints on the 4‑hour chart, suggesting more downside unless bulls reclaim $3,350 decisively. Today’s focus remains on short opportunities at premium levels into supply and imbalances, targeting well‑defined demand areas below.
Watch price action closely in the $3,332–$3,334 zone for the highest‑probability short entry of the session — The Golden Setup.
XAUUSD Outlook: How Risk Sentiment Could Shape the Next MoveI’m currently analysing XAUUSD (Gold) 🟡, which has come under bearish pressure 📉, showing signs of downside momentum. In the video 🎥, we also explore the inverse correlation between Gold and risk assets like the NASDAQ 📊.
Keep a close eye on NASDAQ movements—if risk assets break bullish 🚀, we may see further weakness in Gold. On the other hand, if risk sentiment shifts and risk assets break bearish 🛑, Gold could attract safe-haven demand and gain strength 💪.
We also dive into the price action, market structure, and pull up the volume profile 🧩. Gold is currently trading around the Point of Control (POC) ⚖️—a key level where significant volume has accumulated. A clean break above or below this area could act as a technical trigger for the next move 📈📉.
As always, this is not financial advice ⚠️—just my market view.

GOLD H2 Intraday Chart Update for 8 July 2025Hello Traders
Gold is still in a range between 3300 - 3350 Psychological level, all eyes on breakout of both mentioned psychological levels for now
Intraday Strong support zone is located 3290-3300
Intraday Strong Resistance zone is located 3350-3360
US TARIFF WAR remains agenda for now
Disclaimer: Forex is Risky

XAU/USD Eyes Key Resistance Amid Fresh Tariff Fears🟡 TVC:GOLD Gold Price Forecast: XAU/USD Eyes Key Resistance Amid Fresh Tariff Fears
OANDA:XAUUSD Spot gold (XAU/USD) is recovering from intraday lows near $3,296, now trading around $3,330 as fears over renewed U.S. tariffs fuel safe-haven demand. President Trump has begun issuing formal letters announcing fresh import tariffs—25% on South Korea, additional measures on Japan, and a 10% universal tariff on countries aligning with BRICS. With the 90-day tariff pause expiring August 1 and no trade progress in sight, geopolitical and economic uncertainty continue to support gold’s floor.
📉 Technical Structure
XAU/USD remains within a descending channel on the 1H chart, with price currently approaching the $3,338–$3,340 Resistance Zone 1. A clean breakout above the upper channel boundary could trigger a move toward the broader $3,364 Resistance Zone 2. Conversely, failure to break above Resistance Zone 1 would keep the bearish channel intact, with downside targets toward the $3,302–$3,305 support zone.
📌 Key Technical Zones
Resistance Zone 1: $3,338–$3,340
Resistance Zone 2: $3,364
Support Zone: $3,302–$3,305
Channel Structure: Bearish unless broken to the upside
📘 Strategy Summary
XAU/USD is showing signs of short-term recovery, but remains technically capped unless it breaks through $3,340 resistance. As long as the descending channel holds, rallies may be sold into. A confirmed break above $3,340 could shift bias toward $3,364, while rejection may reopen the path to $3,305 and potentially lower.
⚠️ Disclaimer
This analysis is for informational purposes only and does not constitute investment advice. Please consult a licensed financial advisor before making trading decisions.

XAU/USD – 45-Minute Chart Breakdown **Date:** July 7, 2025 # 📊 XAU/USD – 45-Minute Chart Breakdown
**Date:** July 7, 2025
**Current Price:** $3,326.97
**Bias:** 📈 Bullish Breakout
---
## 🔹 Key Market Structure:
- **Trendline Breakout**: ✅
Price broke cleanly out of the descending trendline that had held since the $3,362 high.
- **LL → HL Shift**:
The structure is transitioning from Lower Lows to potential Higher Lows (HL) – a strong sign of **reversal**.
- **BOS Zone** (Break of Structure):
BOS has been confirmed; further upside is now **probable**.
---
## 🔸 Trade Zone:
| Type | Level | Description |
|------------|------------|--------------------------|
| **Entry** | ~$3,326 | Breakout confirmation 🔓 |
| **SL** | ~$3,319 | Below recent HL 🛡️ |
| **TP1** | $3,362 | Top of previous range 🎯 |
| **TP2** | $3,385+ | Momentum extension 📈 |
---
## 📌 Indicators & Labels:
- **Structure:** `Bullish` 🟢
- **Efficiency:** `Efficient` ✅
- **MSU:** Bearish (short-term countertrend, being invalidated)
- **VTA:** Active ⚡️
---
## 🧠 Strategy Note:
This breakout is occurring **after a full liquidity sweep** and a **strong bullish reaction** off the $3,290s. Volume is supporting the move and **confluence** builds toward continuation.
> 💬 *"The best trades come when structure, liquidity, and timing converge."* – Let's ride this wave with confidence.
---
### 👑 For Persian Princes of the Market 🇮🇷
We don’t guess. We **track, adapt, and lead**.
---
## 🟢 Potential Breakout from the Descending Channel
As observed in the **45-minute timeframe**, Gold (XAU/USD) has been respecting a classic **descending channel** formed by a sequence of Lower Highs (LH) and Lower Lows (LL), leading to an overall bearish structure.
However, in the latest candles, price has **broken above the upper boundary of the channel**, signaling a potential shift in market structure.
---
### 🔍 Technical Highlights:
- ✅ **Breakout above the channel** = First sign of bullish reversal
- ✅ **Formation of Higher Low (HL)** after a strong rally = Added confirmation
- ✅ **Efficient bullish move** with momentum pushing toward previous Highs
---
### 🎯 Forecast Scenario:
If price holds above the breakout zone (around **$3,327**), we can expect a bullish continuation toward:
- 🥇 **Target 1:** $3,362
- 🥈 **Target 2:** $3,385+
A **successful retest** of the broken channel would serve as a powerful confirmation for this setup.
---
> ⛳️ *This move reflects not just a breakout — but a disciplined journey through structure, liquidity, and price behavior. Pure technical elegance.*
> — *Mohsen Mozafari Nejad*
---
📈 **Structure:** Bullish
⚡️ **Momentum:** Efficient
🕰 **Timeframe:** 45 Min
💰 **Current Price:** ~$3,327

#XAUUSD: Early Mitigation Or Sellers Trap! Let's See Gold dropped after touching 3365 taking price to 3318.Currently ranging market showing confusion over how gold would react to NFP data which is coming out tomorrow. At this moment we are quite certain that price would drop tomorrow either from entry one or entry two. Please use accurate risk management while trading.
Good luck and trade!
Team Setupsfx_
GOLD H2 Intraday Chart Update For 7 July 2025Welcome to the new week traders
as we have FOMC meeting minutes report due this week so firs market is fell down from 3350 Psychological level now is testing 3300 psychological level
all eyes on breakout of 3300 level for now if market breaks 3300 level then it will move towards 3280 then 3350
only clear breakout of 3335 will clear path for towards 3368 level
Disclaimer: Forex is Risky

XAUUSD – High-Precision Sell Setup with 1:2.70 R/RGreetings, traders.
After a brief tactical pause, we’ve identified a **high-conviction short setup** on **XAUUSD**.
Despite the U.S. Independence Day holiday, structural momentum suggests there’s still room for meaningful movement in gold during today’s session. The risk-to-reward profile on this setup is exceptional — clocking in at **1:8.70**, it meets our highest-tier execution standards.
If momentum stalls or price consolidates excessively, the trade will be manually closed by **23:00 (UTC+4)**, regardless of outcome.
🧠 Trade Parameters:
• **Timeframe:** 1-Hour (H1)
• **Direction:** Sell
• **Entry:** 3337.09
• **Take Profit:** 3312.16
• **Stop Loss:** 3345.63
• **Risk/Reward Ratio:** 1:2,70
• **Trade Management Note:** Will be closed manually by 23:00 (UTC+4) if momentum conditions are not met.
🔗 Signal Source
All trade setups are published directly by Velatrix Capital — a high-discipline trading desk focused on FX, crypto, and global indices.
No opinions. No hype. Just statistically-grounded execution.
All signals are posted via our TradingView desk:
👉 (www.tradingview.com)
📈 **We don’t chase hype. We build edge.**
🔔 **Subscribe for future setups and institutional-grade trade intelligence.**
**Velatrix Capital**

Consolidating Below Trendline Resistance, Bearish Bias IntactTechnical Structure:
OANDA:XAUUSD Gold (XAU/USD) continues to trade below the descending trendline TL1, having failed multiple times to breach the $3,338–$3,345 resistance zone. After retesting Support Zone 1 ($3,303–$3,310), the price is showing signs of a short-term bounce. However, the broader structure remains bearish unless the price can break above TL1.
Key Technical Levels:
Resistance Zone: $3,338 – $3,345
Support Zone 1: $3,303 – $3,310
Support Zone 2: $3,260 – $3,253
Trendline: TL1 continues to act as dynamic resistance
Strategy Insight:
If TVC:GOLD gold remains below the descending TL1, bearish pressure is likely to resume. A short opportunity may arise if the price retests the resistance area and stalls. A confirmed break below Support Zone 1 would expose targets at $3,260 and $3,253.
Disclaimer:
This analysis is for educational purposes only and does not constitute investment advice. Please consult a qualified financial advisor before making trading decisions.

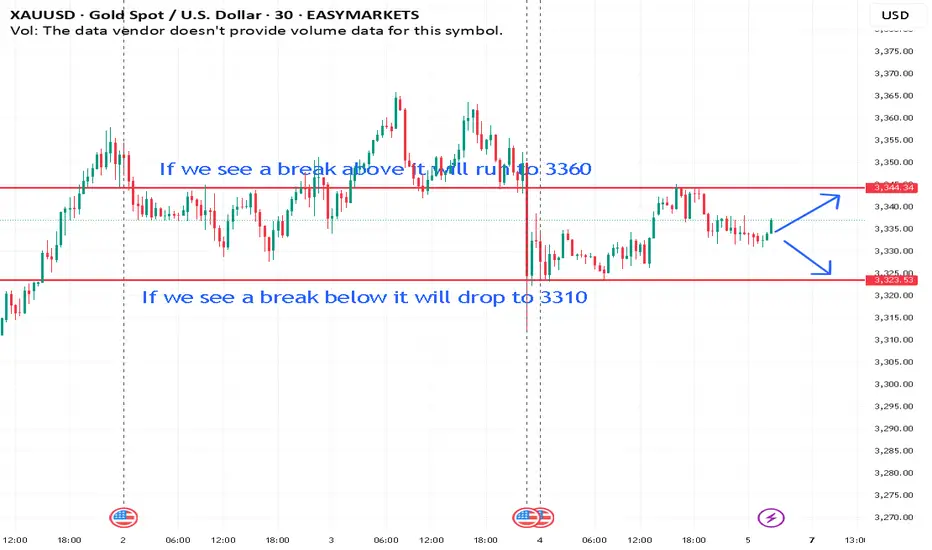
Current outlook for XAUUSD for the july 7th -11th 2025Support and resistance tells us to watch for price action around $3325 - $3345. Either a possible short at 3345 if rejected, or possible further downside if it breaks below 3325.
Gold Spot / U.S. Dollar (XAUUSD) 2-Hour Chart2-hour chart from OANDA displays the recent price movement of Gold Spot (XAUUSD) against the U.S. Dollar. The current price is $3,336.615, up by $10.585 (+0.32%). The chart highlights a recent upward trend with a buy signal at $3,336.970 and a sell signal at $3,336.260. Key price levels include a resistance zone around $3,364.828 and a support zone near $3,309.957, with the price showing a potential breakout above the recent consolidation range.
