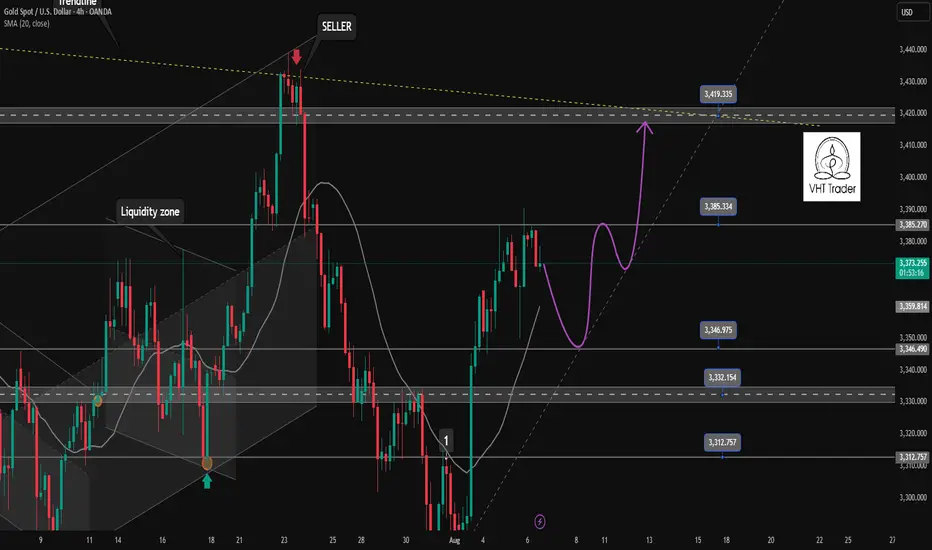
Correction in Tokyo, London session. And return go up in NewYork✏️Gold prices saw some selling pressure in the Tokyo session. Yesterday's US session saw strong buying pressure, leading to a psychological profit-taking session early today. The possibility of a correction in the Asian and European sessions today and the buying pressure will return in the London session. The SELL signal is triggered at the moment and the Target is aimed at the reaction of buyers at the support areas for the BUY strategy.
📉 Key Levels
SELL now 3375 (Scalping)
BUY trigger: Price rejection at the support areas 3346-3333-3315
Target 3420
Leave your comments on the idea. I am happy to read your views.
Xauusdshort
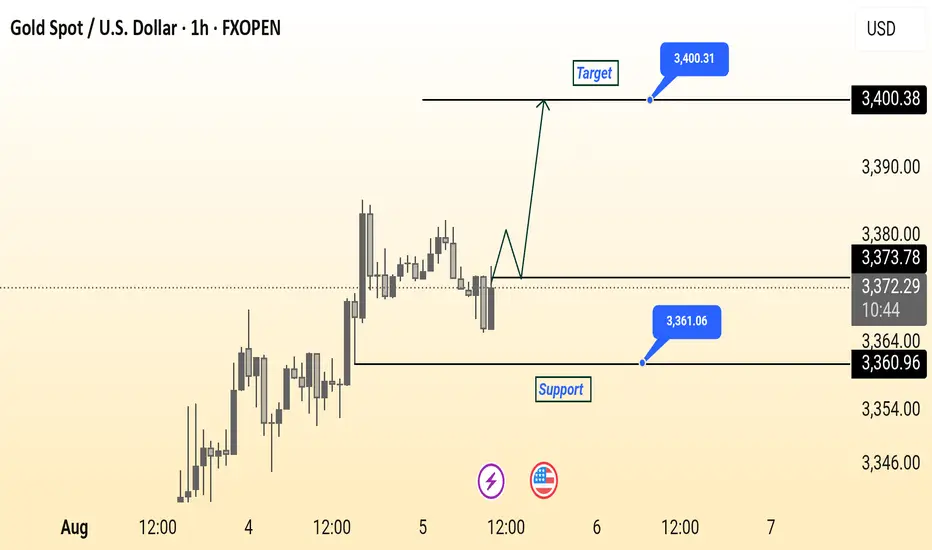
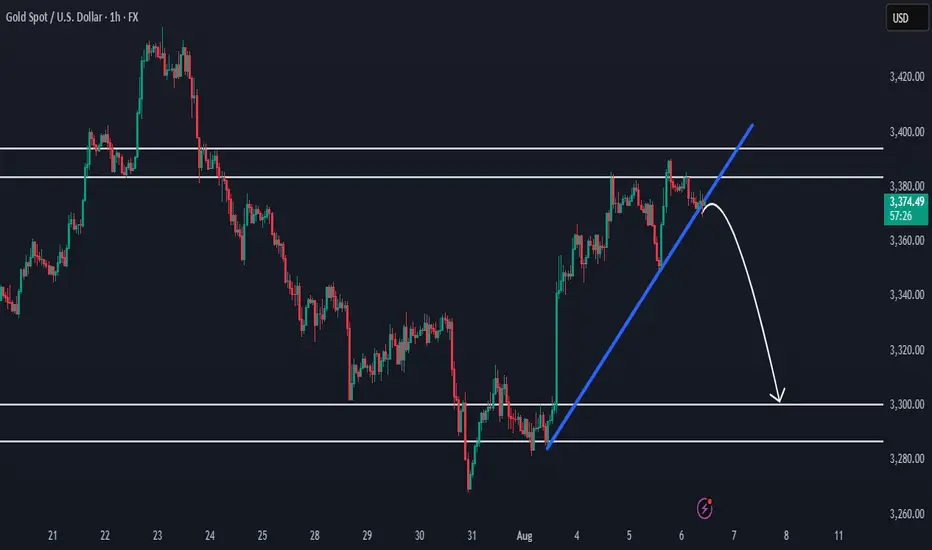
Gold Spot (XAU/USD) 1-Hour Chart Analysis – Potential Upside TowThis 1-hour chart for Gold Spot (XAU/USD) from FXOPEN shows a key support level at $3,360.96 and a potential target at $3,400.31. The current price is hovering around $3,372.04, just below the minor resistance of $3,373.78. A bullish breakout from this zone could initiate a move toward the target, as illustrated by the projected upward path. The support zone marked in blue suggests a strong buying interest that could act as a rebound area if prices dip. Watch for price action confirmation near support for potential long entries.
Gold XAUUSD Analysis 06.08.2025Entry: 3373–3378 (on retracement into 1H supply zone)
Stop Loss: 3385 (above recent swing high)
Take Profit: 3352 (targeting previous low / 1H demand)
Bias: BearishRRR: ~2.5:1
Analysis:
Price showed strong rejection from the 3373–3378 supply zone. Expecting a pullback into this area before continuation lower. Bearish structure remains intact with clean lower highs. Plan is to sell the retracement, with SL above 3385. Targeting 3352, which aligns with prior demand and liquidity.
Kindly show support by following liking and commenting your favourite pair for analysis.

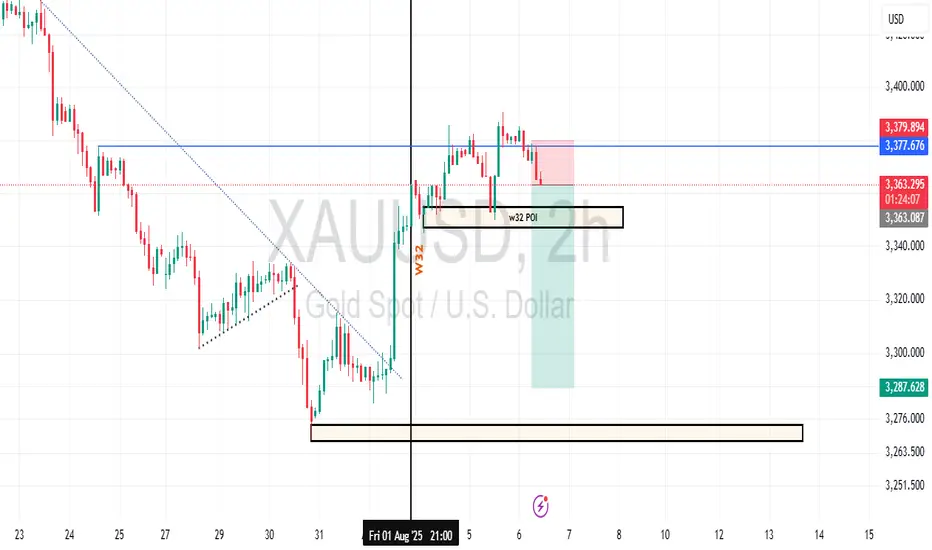
Gold Week 32 Possible reversalGold prices are in a clear downtrend, with critical support at $3,287.628 and resistance at $3,379.874. The 'W32 POI 2H' on Aug 1 highlighted a volatile 2-hour period with a sharp drop and recovery, signaling potential support strength. Fibonacci retracement levels could play a key role in identifying retracement targets. Stay disciplined with risk management as you navigate these levels.
The bullish outlook remains unchanged, go long with the trend!Yesterday, the gold bulls refreshed the high point, and the daily line closed in the form of a medium-sized Yang line with a long lower shadow. The idea of continuing to be bullish in the short term remains unchanged, and what needs to be paid attention to is the strength of the retracement, which is similar to yesterday. The current support below is maintained at the 3355-3350 line of yesterday's rise. This position is also today's key support level, and the key suppression point above is maintained at the integer level of 3390-3400. This position may not be the end point. It was also mentioned yesterday that under the range of the previous large range of fluctuations, if either side does not break through, it will likely continue to fall into fluctuations. The current bullish trend is still relatively obvious, so we still maintain the idea of low-long operations. If your current operation is not ideal, I hope I can help your investment avoid detours. Welcome to communicate!
From the 4-hour analysis, the important support below is the 3355-3350 line. If the daily level stabilizes above this position, the bullish rhythm of falling back to lows and buying on the trend will remain unchanged. Before the daily level falls below the 3350 mark, you need to be cautious about shorting against the trend. I will provide you with the specific operation strategies at the bottom, please pay attention to them in time.
Gold operation strategy: Go long on gold when it retraces to around 3360-3350, target 3375-3385 area, and continue to hold if it breaks through.

XAUUSD INTRADAY ANALYSIS – AUGUST 6, 2025Gold OANDA:XAUUSD is currently consolidating around the 3,371 zone after breaking above a descending trendline formed from late July highs. A strong bullish impulse on August 2nd with significant volume suggests renewed buying pressure. Price is now retesting the breakout area — a critical moment to determine if the bullish continuation is sustainable.
- Technical Breakdown:
1. Price Structure & Trendline:
The former resistance at Peak 1 (3,376) is now acting as new support.
A new ascending channel has formed following the breakout.
Price structure is showing higher highs and higher lows, indicating short-term bullish momentum.
2. Fibonacci & EMA:
The Fibonacci retracement of the recent bullish wave (Aug 1–5) aligns the 0.382 and 0.5 zones with strong support around 3,365 – 3,352.
Price is hovering near the EMA20, and a close above this level will further confirm upside potential.
3. RSI Indicator:
RSI is stabilizing around 50–55, reflecting neutral momentum with room for bullish continuation.
- Key Price Levels:
3,352 – 3,365: Major Support (Fib + EMA + previous lows)
3,376 – 3,380: Immediate Support (breakout retest area)
3,390: Minor Resistance
3,438: Bullish Target (Peak 2)
- Suggested Trading Strategy:
Primary Bias: BUY if price holds above 3,365
Entry Zone: Around 3,369–3,372 (retest + trendline confluence)
Stop Loss: Below 3,352
Take Profit: 3,438 (previous peak)
Risk/Reward: ~1:9 (very favorable setup)
- Look for bullish confirmation (e.g., bullish engulfing or pin bar around 3,365–3,370) for a high-probability entry.
- Alternate Scenario:
If price breaks below 3,352 with strong volume, the bullish thesis may be invalidated. In that case, consider short-term short positions targeting 3,320 area.
This chart setup presents a promising trend-continuation opportunity, with technical confluences supporting further upside. As always, wait for clear price action signals before entry and manage risk accordingly.

Correction first and then rise during the day, TP3400Yesterday, gold hit the bottom near 3350 and then quickly rose to break the high. It fell back slightly in the evening and closed with volatility. The daily line closed with a long lower shadow bullish line. The short-term correction process has been completed, and there is still momentum for an upward impact. The overall structure is still a bullish trend. Focus on 3365-3355 below. As long as the bullish thinking above this level remains unchanged, any decline will provide an opportunity to enter the market. The target can be around yesterday's high of 3390. Once it breaks through 3390, the gold price is expected to reach 3405-3415.
OANDA:XAUUSD

Gold: Yesterday’s Surge & Today’s Session StrategyDuring yesterday’s U.S. trading session, gold surged to around 3390 🚀, driven by a series of tariff-related remarks from Trump, Fed personnel changes, and market expectations that the probability of a September rate cut has risen to 91% ⚡️. We successfully took profit near 3355 yesterday, locking in close to maximum gains 💰.
Today’s trading strategy:
Go short at highs during the Asian session 📉
Go long at lows during the European session 📈
Go short at highs again during the U.S. session 📉
⚡️⚡️⚡️ XAUUSD ⚡️⚡️⚡️
🚀 Sell@ 3390 - 3380
🚀 TP 3375 - 3366 - 3356
Daily updates bring you precise trading signals 📊 When you hit a snag in trading, these signals stand as your trustworthy compass 🧭 Don’t hesitate to take a look—sincerely hoping they’ll be a huge help to you 🌟 👇
8/6: Watch for a Potential Double Top FormationGood morning, everyone!
Yesterday, gold experienced its first significant supply pressure around the 3386 level, but with support near 3350—helped by positive data—prices rebounded and climbed back toward 3390, resulting in solid overall gains.
From the 1-day chart (1D) perspective, the technical structure remains bullish, with MA20 providing firm support. Although short-term moving averages are currently converging, the overall bias remains towards a bullish divergence, suggesting further upside potential. There's a possibility for price to test the 3400–3420 zone in today’s session.
That said, the 3386–3398 region may still pose minor selling pressure, although it is not expected to be particularly strong. Key intraday support is seen in the 3378/3372–3362 range. If the market encounters another wave of heavy selling that damages the daily bullish setup, then the 3343–3348 area will become a critical battleground between bulls and bears.
📌 Trading Strategy for Today:
Maintain a sell-on-strength approach, especially if prices approach the 3418–3438 resistance area, where short opportunities become more attractive;
If a pullback occurs, monitor the aforementioned support zones for potential buy-on-dip opportunities, contingent on stability.
⚠️ Market Risk Reminder:
There will be key economic speeches during the US session, which could trigger heightened volatility. Ensure proper risk management and stop-loss settings are in place.

Gold rebounded near the key support level of $3,350.Spot gold edged higher during the US trading session after finding strong support near $3,350, reversing an earlier pullback. During the European trading session, gold prices briefly dipped due to improved risk appetite and a slight rise in US Treasury yields, failing to extend Monday's rebound. However, buyers stepped in near the 50-day simple moving average (SMA), pushing prices back from the day's low. The continued weakness of the US dollar, fueled by market confidence in a September Federal Reserve rate cut, supported gold's rebound.
Spot gold struggled to extend last week's rebound and is currently hovering around $3,350.
Last week, gold broke below an ascending triangle pattern, briefly hitting a one-month low, before finding support above the 100-day simple moving average (SMA), suggesting continued bearishness.
Currently, gold is trading slightly above the 50-day SMA, providing immediate support, followed by the 100-day SMA. Further declines could lead to targets near $3,275 and $3,200.
The Relative Strength Index (RSI) on the daily chart is in neutral territory around 55, indicating a lack of clear momentum. Meanwhile, the MACD indicator shows a golden cross with the DIFF crossing the DEA, and the MACD-histogram is positive, indicating accumulating bullish momentum. However, the overall reading is low, and further upward momentum is needed. A sustained golden cross and a larger candlestick pattern would be bullish.
On the upside, if bulls can reclaim the bottom of the broken triangle and decisively push above $3,380, the market could potentially move towards $3,450, or even revisit the all-time high. PEPPERSTONE:XAUUSD VELOCITY:GOLD FXOPEN:XAUUSD CMCMARKETS:GOLD VANTAGE:XAUUSD ACTIVTRADES:GOLD ACTIVTRADES:GOLD ICMARKETS:XAUUSD

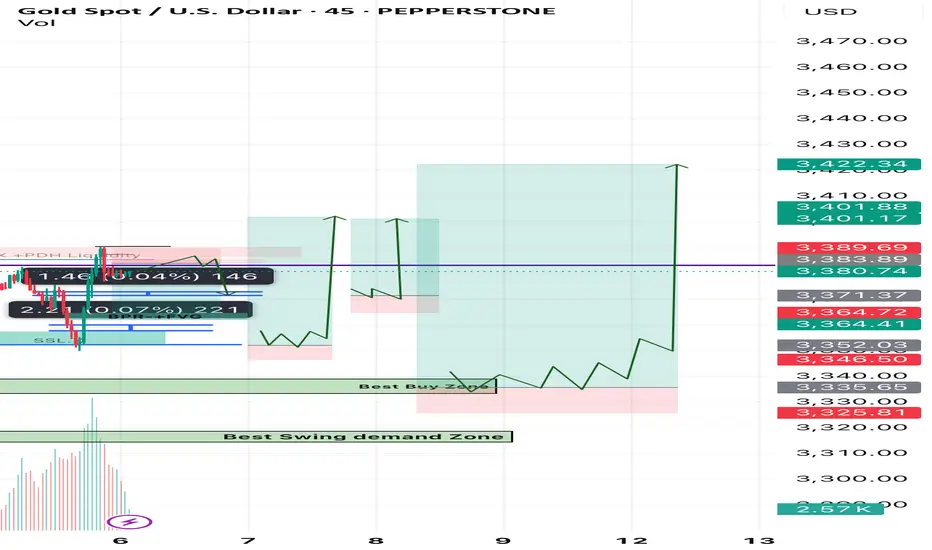
Gold h4 Based Setups Short Gold and Long analysis Market tapped above previous high (BSL + PDH Liquidity), then rejected → classic liquidity sweep
• Formed FVG + BPR zone (red box) and price consolidated below it
• You’re in a short trade targeting ~3365 (blue/green zone) where a new BPR + FVG block is formed (possible demand zone)
If price holds below 3383–3387 zone (FVG + BPR) and breaks 3375 support zone clearly
• We might see a drop toward:
• 3365 (1st TP – already marked)
• 3356–3352 (next demand & SSL area)
🟡 Bullish Rejection Possibility:
• If price reclaims 3387 with a strong candle close
• Then:
• Stops above 3388–3390 may get swept
• Upside potential = 3396–3402 (but less likely unless fundamentals support)
Golden Buying zone for Swing trade 3335-3330 zone
Second buy Golden Zone 3315-3318
Sl Below 3295 For Swing trader
Mange your Risk Alwayse use strick Stoploss
Happy Trading Best Of Luck
Gold Showing Distribution Signs – Is a Bearish Reversal in Play?Technical Analysis
1. Key Support & Resistance Levels
Short-term Resistance: 3,375–3,380 USD (previous consolidation zone now acting as supply)
Major Support: 3,300 USD (prior breakout base, possible Fibonacci target zone)
Intermediate Support: 3,335 USD (intraday low during the current correction)
2. Structure & Trend
The chart shows a strong bullish impulse on August 2, breaking out of a prolonged consolidation base.
After the breakout, price entered a distribution phase around 3,375 where momentum stalled and volume declined.
A clear breakdown from the distribution zone is now underway, suggesting increased selling pressure and a possible retest of lower demand areas.
3. Price Action Behavior
Price is currently attempting a pullback retest toward the broken structure near 3,370–3,375.
There’s potential for a small head and shoulders pattern, with the neckline near 3,335. A confirmed break below this level could accelerate the move down to 3,300.
4. EMA & RSI Outlook
EMA20 is beginning to turn downward and may soon cross below the EMA50, hinting at a short-term bearish trend shift.
RSI (not shown but worth watching) is likely cooling off from overbought levels, providing space for further downside.
Trading Strategy Ideas:
Sell on pullback to resistance:
Entry zone: 3,370–3,375
Target: 3,335 and 3,300
SL: 3,382
Short-term Buy if RSI oversold + bullish price action: 3,335
Target: 3,370
SL: 3,325
Gold is showing signs of weakness after a sharp rally. The breakdown from the distribution zone indicates a shift in sentiment. If price fails to reclaim 3,375 and confirms below 3,335, the 3,300 support could be the next key destination.
Follow to receive more high-quality trading strategies in upcoming sessions. Save this idea if you found it useful!
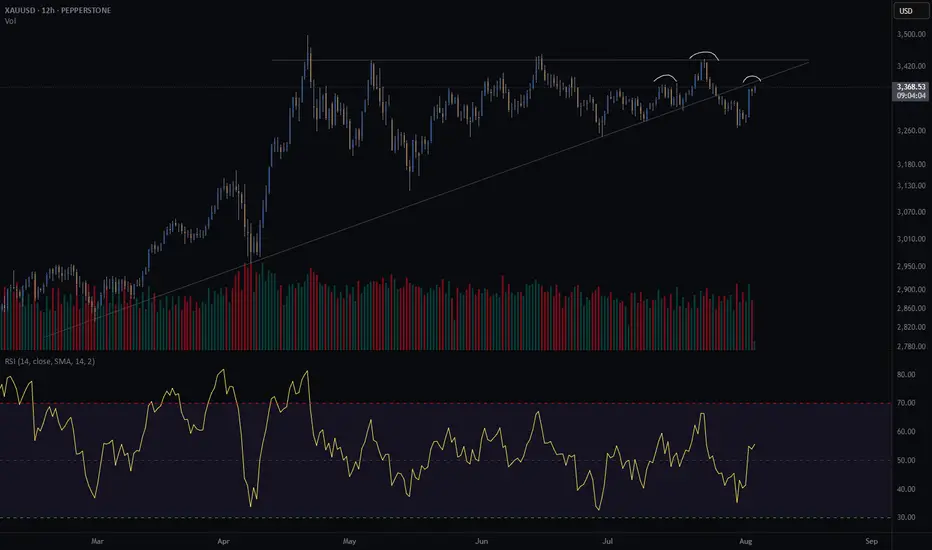
Gold crash (SHORT) - head and shouldersGold is at an interesting crossroad.
It broke through its diagonal support on Friday the 25th of July.
Price is retesting previous support. Does it turn into resistance?
Further confluence is a head and shoulders of the H8 and H12, with the right shoulder coinciding with the retest of the diagonal.
Since I am long gold with my investments, I am hesitant to short gold through my trading business. However, if my pattern is available, I take the trade. This will be a very short term trade - a few days at most if the trade goes in my favour.
Risk/reward = 12.6
Entry price = 3382.5
Stop loss price = 3396.2
Take profit level 1 (50%) = 3230
Take profit level 2 (50%) = 3181
The risk reward is exceptionally high. However, I have taken a more conservative approach with my entry because of my apprehension to short gold. For this trade I will enter at the extreme end of the range in which I will look for entries. This is the reason for such a high RR. It might result in me missing an entry.
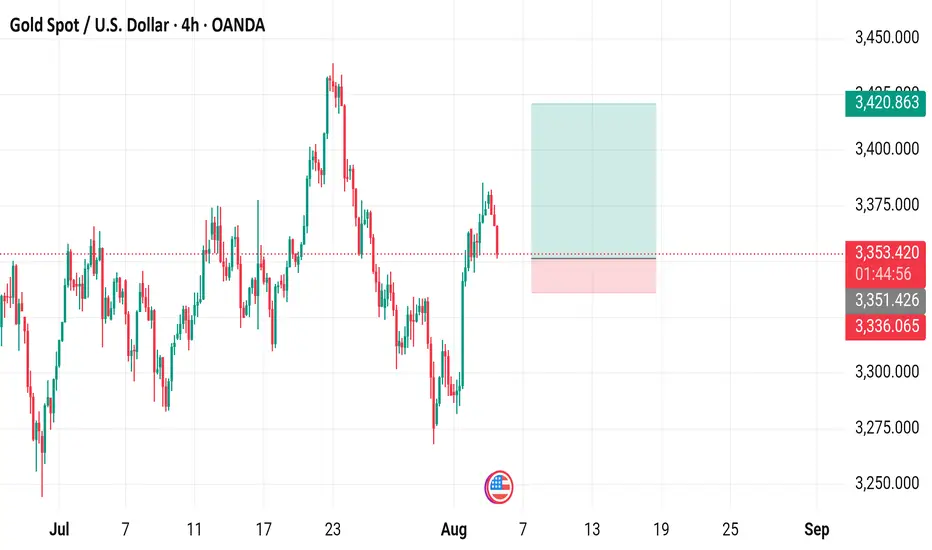
Gold Spot / U.S. Dollar (XAU/USD) - 4 Hour Chart (OANDA)4-hour chart from OANDA shows the recent price movement of Gold Spot (XAU/USD), currently at $3,353.240, down $20.395 (-0.60%). The chart highlights a sell price of $3,353.010 and a buy price of $3,353.450, with a shaded area indicating a support/resistance zone around $3,351.426 to $3,353.240. The data reflects trading activity from July to early September 2025.
Gold Technical Analysis - Bearish Bias Below $3,384Gold is currently trading near $3,373 within an ascending channel but showing signs of weakness. A rejection near the $3,384–$3,390 resistance zone could trigger a downside move toward key supports at $3,350, $3,338, and $3,326. If price breaks below the channel midline, bearish momentum may strengthen. However, a bounce from support could push gold back toward the upper range. Keep an eye on breakout zones for the next move.
🔑 Key Levels to Watch
- Resistance: $3,384 → $3,390: Strong resistance zone
- Support: $3,350 → $3,338 → $3,326
- Breakout Zones: Below $3,338: Opens room to $3,310 and below. Above $3,390: May lead to fresh highs toward $3,410+
🧭 Trend Outlook
- Short-Term: Bearish bias within the ascending channel, especially if price breaks below mid-channel.
- Medium-Term: Neutral to bullish as long as the lower channel trendline holds.
- Momentum: Losing bullish momentum; potential for downside correction.
Price is at a decision point within the ascending channel. A clean break below the mid-channel and $3,365 area can accelerate downside correction. Stay alert to key support zones and any reversal signals.
Note
Please risk management in trading is a Key so use your money accordingly. If you like the idea then please like and boost. Thank you and Good Luck!

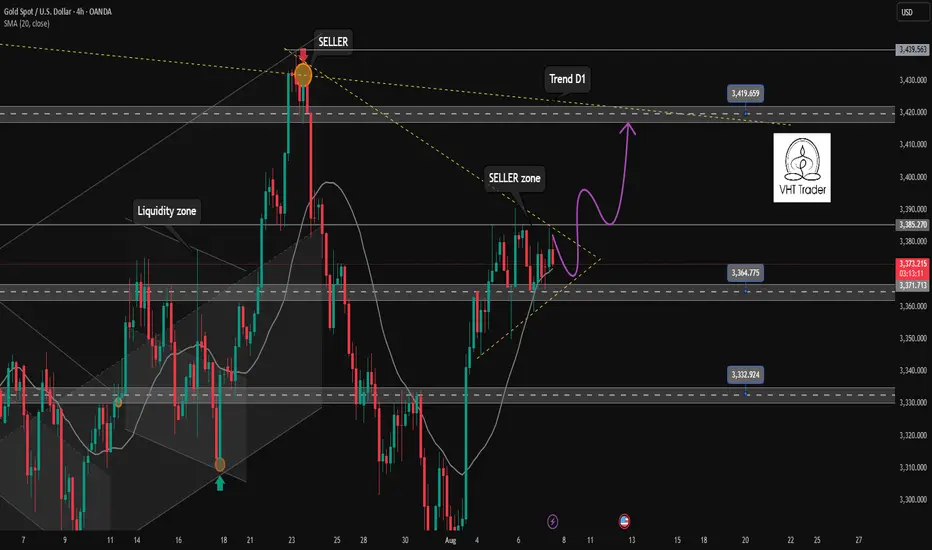
Ascending triangle pattern is formed✏️Gold is consolidating in a triangle pattern. This is likely an ascending triangle pattern. We can wait for strong enough buying pressure to break the upper boundary to trigger the BUY strategy. Or wait for a reaction at the lower boundary of the triangle pattern to trigger the BUY. 3365 is broken to confirm a corrective downtrend towards 3333.
📉 Key Levels
Buy trigger: Breakout of the upper triangle pattern 3385
Buy trigger: Reaction of the buying candle at 3365
Target 3419
SELL Trigger Break and Retest bellow 3365
Leave your comments on the idea. I am happy to read your views.
Gold Price Trend Analysis and Trading Guidance (Exclusive)📣📣📣A technical analysis of gold's recent performance reveals that it has formed a four-day winning streak, demonstrating the strength of the upward trend and indicating that short-term upside potential has not yet been exhausted. Of note, the upper Bollinger Band at 3430 on the daily chart is acting as a key resistance level, and this level is likely to be tested this week. However, when it comes to a sharp rise in the market, there is no clear signal at present. We need to wait for the opening pattern of the daily Bollinger band to be confirmed before we can open up a new round of upward space.🧐🧐🧐🤔🤔🤔
Switching to the H4 cycle for observation, the unilateral upward trend continues to consolidate, the moving average system shows a perfect upward divergent arrangement, the Bollinger Bands simultaneously maintain an open state, and a short-term high pressure is formed near the upper rail of 3415. Based on this, the bullish logic for gold remains unchanged on Wednesday, with the intraday high range likely to be between 3415 and 3430. There's no need to overestimate whether the price will break through previous highs at this point, and trading strategies should be adjusted dynamically based on real-time market performance. From a short-term perspective, intraday support should focus on two key levels: 3360 and 3350.
👊👊👊On the operational level, it is recommended to adopt a strategy of placing long orders in batches when the price falls back to the 3365-3360 range, relying on the support level to seize the opportunity of trend continuation.⭐️⭐️⭐️
⚠️⚠️⚠️The market is risky, so participate rationally. If you need real-time trading references and trading advice, please leave a message to Charlie.🛫🛫🛫 FOREXCOM:XAUUSD VELOCITY:GOLD PEPPERSTONE:XAUUSD CMCMARKETS:GOLD ICMARKETS:XAUUSD CMCMARKETS:GOLD FXOPEN:XAUUSD
Gold Rejected from Supply - Clean Sell SetupHello traders!
This is a clean, textbook sell setup.
Gold has an overall bearish structure.
It has reached an important supply area and been rejected.
We are aiming for a sell position here upon breaking the upward trendline.
The target is around 3300.
Gold is waiting to break through near the dense pressure rangeGold (XAU/USD) prices fell slightly during Wednesday's Asian trading session, retreating to around $3,370, snapping a four-day winning streak. Previously, gold prices had hit a nearly two-week high on Tuesday.
Gold's recent rally was driven by the Federal Reserve's policy outlook and safe-haven flows, but a recent shift in market sentiment toward optimism and a slight rebound in the US dollar index have put downward pressure on gold prices.
Risk assets generally rose, including a rebound in Nasdaq futures, temporarily cooling demand for safe-haven assets. Furthermore, the dollar's slight rebound also put pressure on non-interest-bearing gold.
Weak US data heightened economic concerns, supporting expectations of a rate cut this year.
Last Friday's weaker-than-expected US non-farm payroll data, coupled with Tuesday's release of the July ISM Services PMI, which fell to a multi-month low of 50.1, have fueled market concerns about the US economic outlook.
"Both the weak employment index and new orders suggest weakening momentum in the services sector, further strengthening the likelihood of a September rate cut by the Federal Reserve," analysts noted.
The market currently expects the Federal Reserve to implement a 25 basis point interest rate cut at its September policy meeting, with the possibility of a total rate cut exceeding 50 basis points this year. While this expectation has dampened dollar bullish sentiment and provided support for gold, the optimistic stock market sentiment has weakened gold's appeal as a safe-haven asset.
In trade-related news, the US President announced a new round of tariffs on imported semiconductors and pharmaceuticals, accelerating the pace of tariffs on areas such as automobiles, steel, and aluminum.
This move has heightened market concerns about global supply chain risks, maintaining cautious investor sentiment and potentially providing safe-haven support for gold in the medium term.
From a technical perspective, gold prices encountered clear resistance before reaching the $3,400 mark and failed to break through, shifting into a short-term consolidation pattern.
The 4-hour chart shows that gold found support at the 100-period simple moving average (around $3,350) and rebounded, indicating that bulls are still trying to maintain the initiative.
"Currently, hourly and daily oscillators remain positive, but if gold fails to hold above $3,400, it is likely to remain volatile in the short term," market participants noted.
Upward resistance lies at the key resistance zones of $3,400 and $3,430, respectively. A break above this would open an upward trend, targeting the all-time high of $3,500 reached in April.
Initial support lies at $3,350. A break below this would target the intermediate support of $3,322 and the $3,300 mark. A further break below this level could test the one-month low of $3,268.
Although gold prices are currently under short-term pressure, they remain supported in the medium term amidst a slowing US economy, rising expectations of interest rate cuts, and ongoing potential trade frictions. In the short term, the price is expected to fluctuate around the $3,400 level. Focus on speeches by Federal Reserve officials and next week's US CPI data, which may provide new direction for gold. OANDA:XAUUSD VELOCITY:GOLD EIGHTCAP:XAUUSD CMCMARKETS:GOLD PYTH:XAUUSD ACTIVTRADES:GOLD FX:XAUUSD

gold on sell#XAUUSD price third range have been broken, now we wait for reverse below 3355.
Sell from 3375-3373 on H1 closure, target 3355, SL 3384
If price touch 3371 and reverse back close, bullish range between.

GOLD (XAU) SHORT - Double top 30minRisk/reward = 2.8
Entry price = 3382.5
Stop loss price = 3390.5
Take profit level 1 (50%) = 3361.7
Take profit level 2 (50%) = 3356
I am considering a short on gold.
Still need some variables to fall into place before I enter the trade.
There is nice RSI negative divergence showing declining momentum.
Further confluence:
- Potential head and shoulders on higher time frame
- At area of previous diagonal support which could be turned into resistance if the 30min double top plays out
Can technical factors boost gold? (Must-read for traders)After three consecutive days of strong rebounds, spot gold has entered a period of sideways trading, trading around $3,370 in the European session, with a short-term seesaw pattern. A slight rebound in the US dollar index has weighed on gold prices, but market expectations of a September Fed rate cut remain supportive. Furthermore, lingering global trade uncertainty has prevented a significant decline in safe-haven demand.
Fundamentals:
Gold's recent upward momentum has been driven by weak US economic data and rising expectations of rate cuts. Last week's non-farm payroll data showed a significant weakening in the labor market, reinforcing market bets that the Fed will begin another round of rate cuts in September. The CME FedWatch tool shows that the market's expectation of a September rate cut has exceeded 90%. Meanwhile, US factory orders plummeted 4.8% in June, further highlighting economic weakness.
On the other hand, US President Trump signed an executive order last week raising tariffs on imports from dozens of countries, with the minimum tariff rate reaching 15% for countries with trade deficits with the US. With these measures about to take effect, this uncertainty continues to weigh on global market sentiment and supports gold's safe-haven properties.
However, a slight rebound in the US dollar partially offset gold's upward momentum. Traders will be watching the upcoming US ISM Services PMI data to determine whether the economic slowdown has spread to the services sector.
Technical Analysis:
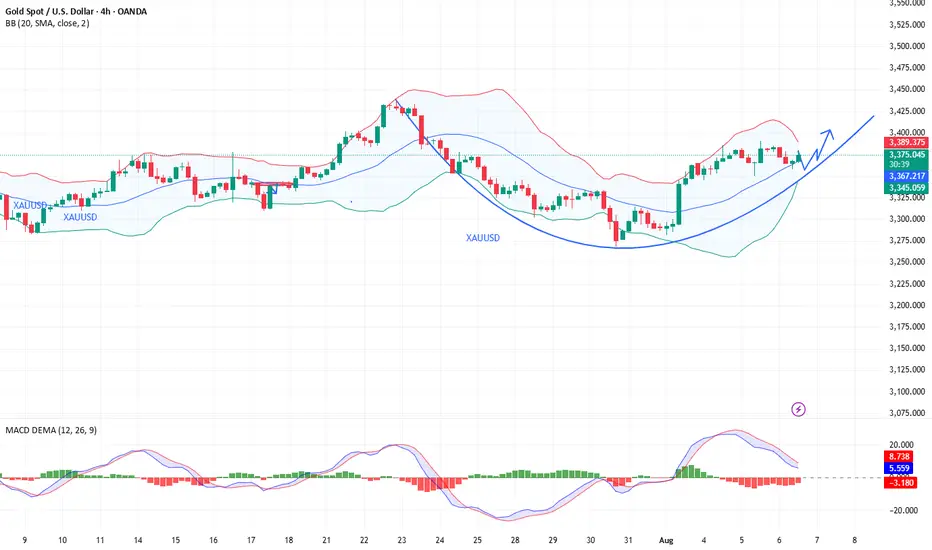
On the daily chart, gold prices have recently traded between the middle and upper Bollinger Bands (3343.59) and 3411.09, failing to break through key resistance. The overall trend remains within the medium-term range, with no clear trend emerging.
The recent candlestick chart pattern forms a typical "sideways fluctuation" pattern, indicating significant pressure near the previous high of 3438.80, while the lower Bollinger Band (3276.09) provides support, suggesting a short-term "box consolidation" pattern.
On the MACD indicator, the fast and slow lines are near the zero axis, while the DIFF and DEA lines have formed a slight golden cross, but the angle is gentle. The red bar has limited momentum, indicating insufficient upward momentum and a lack of a strong rebound.
The Relative Strength Index (RSI) remained at 54.81, within the neutral to strong range, indicating a lack of clear short-term price direction. Market sentiment remains cautious. Further attention will be paid to whether the price stabilizes above the middle Bollinger Band or retreats to test previous support levels.
Market Sentiment Observation:
Current gold market sentiment is cautiously optimistic. Traders are pricing in a high level of interest in the Federal Reserve's rate cut, driving a short-term rebound in gold prices. However, the dollar's resilience remains, limiting gold's upside potential. Indicators show a lack of significant inflows into gold ETFs, suggesting the market has not yet fully shifted to a defensive position.
The technical chart shows a typical "consolidation platform," indicating that the market is awaiting clearer policy or data guidance. Investors remain interested in safe-haven assets, but their willingness to chase higher prices is weak. In the short term, market sentiment may continue to be constrained by fluctuations in external macroeconomic data and shifting policy expectations.
Market Outlook:
Bull Perspective:
Analysts believe that if gold prices break through the upper Bollinger Band at 3411.09 and the MACD indicator expands, further upside potential is expected, with the previous high of $3450 in sight. If the Federal Reserve signals a clear interest rate cut or if the US economy continues to weaken, gold could see a mid-term trend reversal and resume its upward trend.
Bear Perspective:
Analysts believe that if gold prices remain constrained in the 3400-3411 range and fall below the middle Bollinger Band and moving average support, a short-term pullback could occur, testing the lower support band at $3276. If the ISM Services PMI exceeds expectations and the US dollar strengthens again, gold could return to bearish momentum. FOREXCOM:XAUUSD ACTIVTRADES:GOLD ICMARKETS:XAUUSD CMCMARKETS:GOLD PYTH:XAUUSD FOREXCOM:GOLD ICMARKETS:XAUUSD CMCMARKETS:GOLDZ2025 CMCMARKETS:GOLD
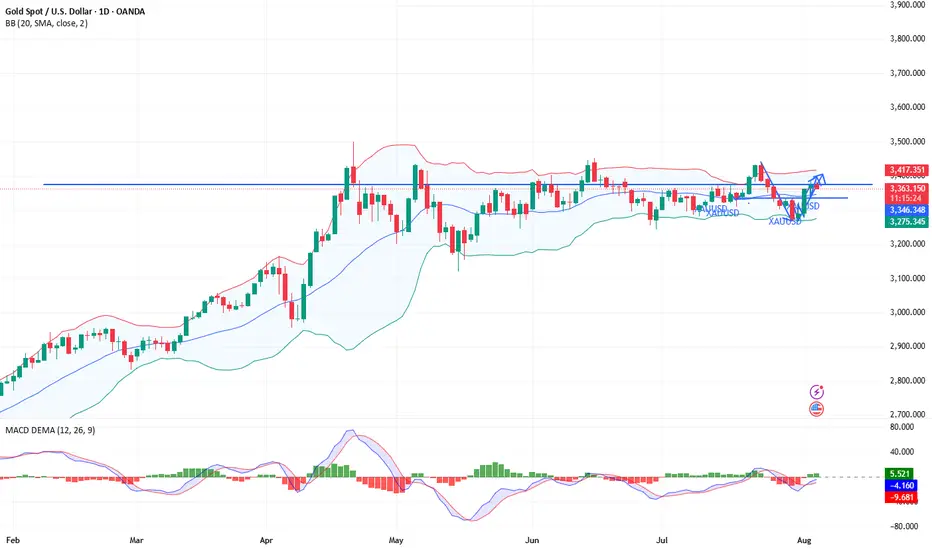
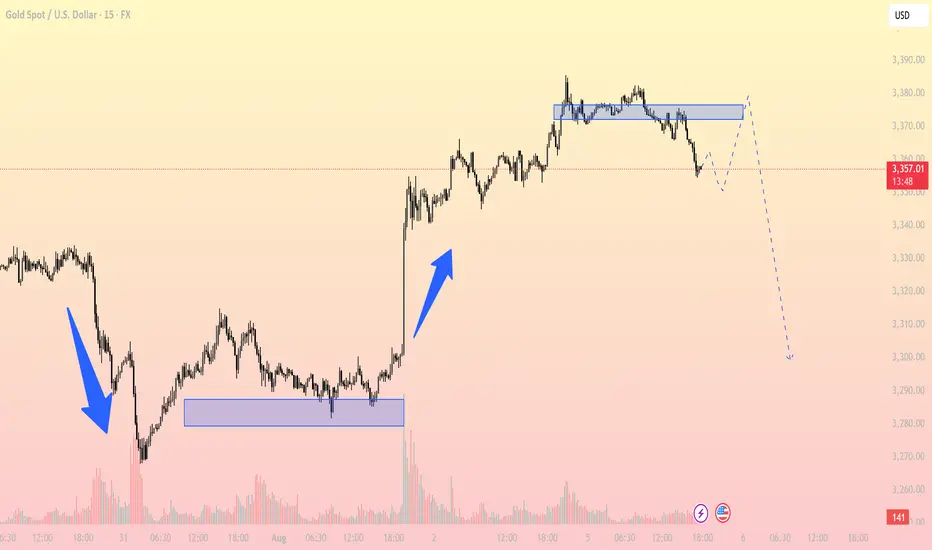
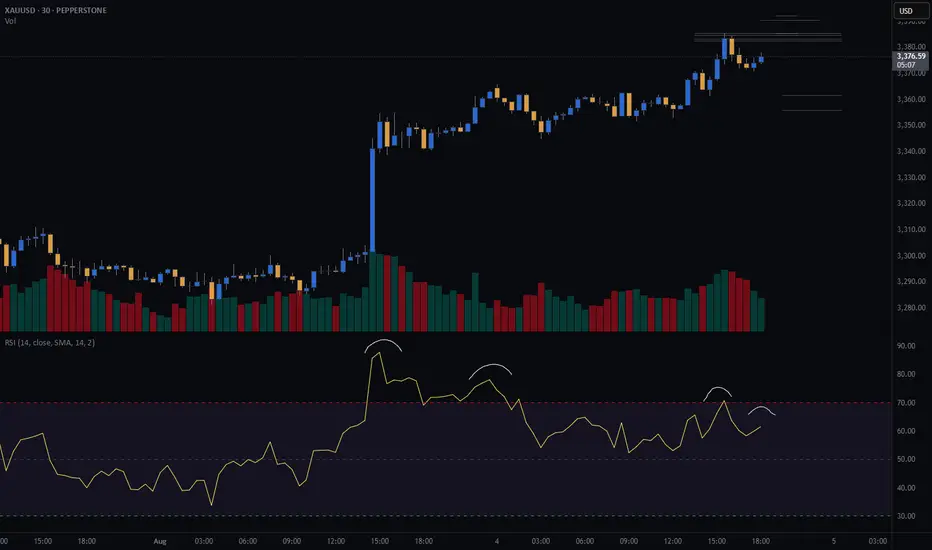
XAUUSD shows bearish divergence. Minor correction or sign of a rXAUUSD shows bearish divergence. Minor correction or sign of a reversal?
On August 4 gold continued bullish momentum, started on August 1 after disappointing nonfarm payrolls report came out that heightened fears about the U.S. economy’s health. Investors now see a 94.4% likelihood of a Federal Reserve rate cut in September. Gold gained further support due to doubts about the Fed’s autonomy after Governor Adriana Kugler resigned on August 1, opening the door for President Trump to appoint a successor who may support his push for lower interest rates. The metal’s safe-haven status was also bolstered by trade tensions, as Trump’s new tariffs on exports from numerous trading partners are scheduled to begin on August 7.
Despite this, in short term gold looks bearish. The price has failed to break through the intermediate level of 3,380.00 and currently trades slightly below this level, showing bearish divergence. The decline towards the SMA50 with further rise towards 3,440.00 is expected here. Second option (less probable) is the price comes back to a level of 3,300.00.
