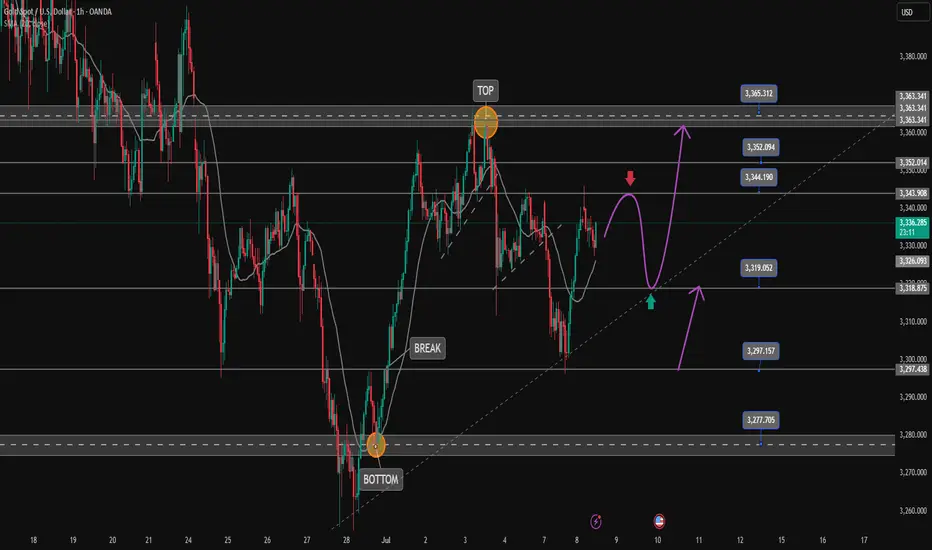
Short-term gold bulls and bears are anxious,3330 becomes the keyAt present, the market has been fluctuating narrowly in the range of 3330-3320, and both bulls and bears are in a stalemate. However, gold has formed a double-layer head and shoulders bottom pattern, so the short-term bullish trend is definitely unchanged. In the previous post, I also mentioned that if the rebound in the European session is weak and gold continues to be below 3345, then the short-term NY session may usher in a retracement and a second bottom. Therefore, I still hold a long order of 3325-3315, and temporarily modify the TP to the 3335 line. I expect that there may be a retracement here, but there may also be a direct retracement. No matter what the situation is, we need to stabilize before entering the market.
In addition to investment, life also includes poetry, distant places, and Allen. Facing the market is actually facing yourself, correcting your shortcomings, facing your mistakes, and exercising strict self-discipline. I share free trading strategies and analysis ideas every day for reference by brothers. I hope my analysis can help you.
PEPPERSTONE:XAUUSD FOREXCOM:XAUUSD FX:XAUUSD FXOPEN:XAUUSD OANDA:XAUUSD TVC:GOLD
Xauusdshort

How to solve the problem of order being trapped in a loop📊 Gold Day Trading Strategy (Recommendation index ⭐️⭐️⭐️⭐️⭐️)
📰 News information:
1. The lasting impact of new tariffs
2. The impact of geopolitical conflicts
3. The Fed’s interest rate cut
📈 Technical Analysis:
The recent market conditions have been volatile. Many brothers have reported that they have been trapped recently. They have just been released from short positions, but have fallen into the situation of being trapped by long orders again. I have also encountered such a situation recently. Brothers who follow me must know that I have been trapped, but in the process of being trapped, I still share my trading ideas for the brothers who are trapped to check, so that we can all get out of the trap.
Gold fell as expected and hit the lowest point of 3287 before rebounding. The current 3300-3290 range given at the bottom has certain support. At present, I have answered it. As long as it does not fall below 3285, we can still go long and look for rebound correction. TP can temporarily look at 3305-3310. At present, the short-term upper watershed is near the 3321 line. As time goes by, the medium-term point can be seen at 3345. Only when the price stands above 3345 can the upward momentum continue to touch the 3380 line, or even 3400. In the short term, you can go long if you look at the support below. In the short term, pay attention to the resistance above 3315-3320. If it encounters resistance under pressure, it will fall back. On the contrary, after breaking through the first level of resistance, the upward trend will continue.
🎯 Trading Points:
BUY 3300-3290-3285
TP 3305-3315-3320-3345
SELL 3315-3321
TP 3300-3290
In addition to investment, life also includes poetry, distant places, and Allen. Facing the market is actually facing yourself, correcting your shortcomings, facing your mistakes, and exercising strict self-discipline. I share free trading strategies and analysis ideas every day for reference by brothers. I hope my analysis can help you.
TVC:GOLD OANDA:XAUUSD FXOPEN:XAUUSD FX:XAUUSD FOREXCOM:XAUUSD PEPPERSTONE:XAUUSD
XAUUSD Short / Sell Setupwait for the entry and place tp & SL, must use SL, never exceed more than 2% on SL of your portfolio on any trade. If tp is achieved first then trade setup will be invalid.
Gold Price Setup: Bullish Continuation or Rejection? 🧠 Chart Analysis (XAU/USD – 1H):
Key Structure Highlights:
CHoCH (Change of Character) zones marked both up and down indicate a battle between bulls and bears.
Recent bullish CHoCH followed by a fair value gap (FVG) retest suggests potential continuation to the upside.
Price recently bounced strongly from demand zone, shown by the green arrows and strong candle reaction.
Ichimoku Cloud:
Price is trying to break back above the Kumo (cloud), a sign of bullish momentum building.
However, resistance is still present with the Kijun and Tenkan lines converging.
FVG (Fair Value Gap):
The current price is attempting to fill and break above the FVG zone.
A successful breakout above this area confirms bullish intention.
Fibonacci Levels:
Price is hovering around the 0.5 - 0.618 retracement zone, often a strong reversal or continuation point.
Upside targets lie near the 0.786 retracement (3352) and ultimate target at 3391, a major resistance level.
Risk Management:
Trade setup shows an excellent Risk:Reward ratio.
Stop-loss placed just below the last structure low.
Potential downside to 3290–3258 if breakout fails.
🟢 Possible Next Move:
Bullish Scenario: If price clears the FVG and breaks above 3353, expect continuation to 3391.
Bearish Rejection: If rejected at FVG/0.618 level, watch for a drop back to 3290 or even 3259.

Gold is bullish and needs more momentum at 3320The buying pressure in the US session pushed the price up and formed a bullish hammer candle on D1. Today's bearish recovery is seen as a buying opportunity to head towards the uptrend again.
3344 is the immediate resistance zone in the European session that Gold faces. Breaking this resistance zone will head towards 3365. According to the wave structure, it would be great to have a retest of 3320 to find some buying momentum and then break 3344.
SUPPORT: 3320-3297
RESISTANCE: 3345-3352-3365
SELL Trigger: Break 3320 ( Trendline & break zone)
Do you have any comments on the trading plan? I would love to hear your views.
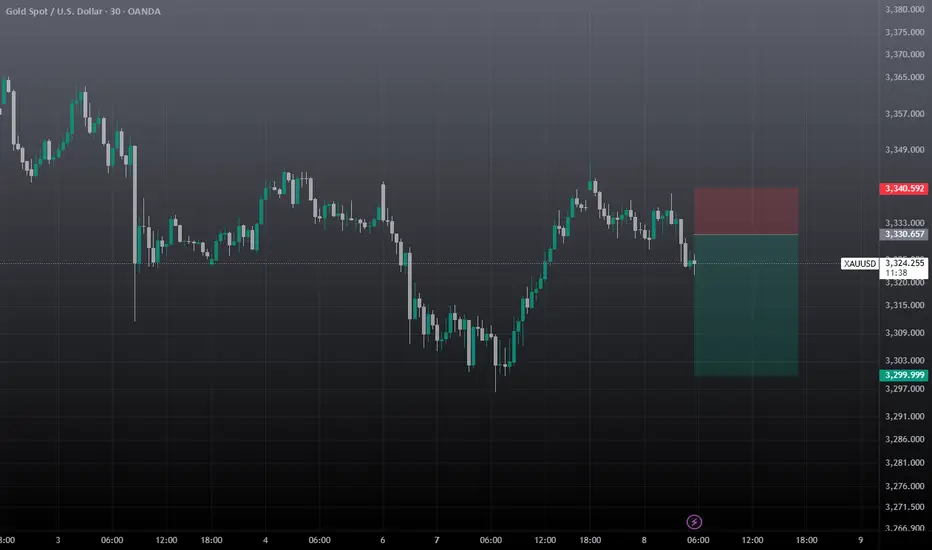
Setupsfx_ | XAUUSD(Gold):07/07/2025 Update | Gold dropped nicely when the market opened last night, dropping around 600 pips. However, it couldn’t hold on to the gains and came right back to the selling zone. There are two entry points and two potential targets.
Good luck and trade safely!
Team Setupsfx_

GOLD ON BUY FROM 3316#XAUUSD price we expect drop till 3316 for bullish range to form.
Buy limit 3316-3315.5, target 3330, stop loss 3310.
Below 3306 holds bearish continuation, target 3290-3280.
Bullish range can form above 3330 on 2 times breakout, target 3345

Gold Spot / U.S. Dollar (XAU/USD) 4-Hour Chart4-hour chart from OANDA displays the recent price movement of Gold Spot (XAU/USD) against the U.S. Dollar. The current price is $3,325.120, reflecting a decrease of $11.320 (-0.34%). The chart highlights a recent upward trend with a buy signal at $3,325.410 and a sell signal at $3,324.830, indicating a potential trading range. A shaded area suggests a possible price target or support/resistance zone around $3,355.478, with historical price levels marked on the right side. The timeframe covers the period around July 7-8, 2025.

XAUUSD Trading Strategy – July 8, 2025Gold (XAUUSD) is trading around 3,331 USD as global markets react to a series of critical economic data releases. The recent rally has brought prices back to a key resistance zone, but selling pressure remains strong due to the following factors:
- The Dollar Index (DXY) TVC:DXY holds steady near 97, its highest level in five weeks. A strong USD continues to weigh on gold, a non-yielding asset.
- U.S. 10-year Treasury yields remain stable at 4.35%, reinforcing expectations that the Federal Reserve will maintain higher interest rates for longer to tame inflation.
- Robust U.S. labor market data and June’s Core PCE figures staying above the Fed’s 2% target further reduce the likelihood of a rate cut in Q3 or Q4.
- Geopolitical tensions remain muted, with no significant escalations in the Russia–Ukraine conflict or Middle East unrest, weakening gold’s safe-haven appeal.
➡ Collectively, these factors suggest that gold’s recent rebound could be a technical pullback within a broader downtrend, unless a new catalyst drives a breakout.
1. XAUUSD Technical Analysis – Daily Chart (D1)
Price is currently testing the 3,331 – 3,340 USD resistance zone, which includes:
A previous supply zone that has rejected multiple rallies.
- Fibonacci retracement 0.5–0.618 from the recent high at 3,405 USD.
- A key Change of Character (CHoCH) area, where trend reversals have previously occurred.
- EMA20 and EMA50 remain aligned downward, confirming the dominant bearish trend.
- RSI hovers around 50 with signs of mild bearish divergence, reflecting weakening bullish momentum.
➡ The current price action fits a classic “sell on rally” setup, with repeated rejections at technical resistance zones.
2. Key Price Levels to Watch
Technical Significance
- 3,340 – 3,331 Confluence resistance (Fibo 0.5–0.618 + supply + CHoCH)
- 3,310 – 3,300 Nearest support – role reversal zone
- 3,275 – 3,260 Short-term target support – June’s low
- 3,223 – 3,205 Strong medium-term support – April’s low + extended Fibo
3. Suggested XAUUSD OANDA:XAUUSD Trading Strategy
Primary Strategy: SELL if price rejects 3,340 – 3,345
Entry: 3,340 – 3,345
Stop Loss: 3,356
Take Profit 1: 3,335
Take Profit 2: 3,330
Take Profit 3: 3,325
Ps : Gold is trading at a critical price zone. If XAUUSD fails to break above the 3,340 USD resistance, there’s a high probability of a pullback toward the lower support levels. Selling at resistance and targeting support remains the preferred approach in the current macro environment, which continues to favor bearish momentum.
This strategy will be updated regularly – save it and follow to avoid missing upcoming opportunities.
Analysis by @Henrybillion

XAUUSD Short-Term Correction From the Top ZoneOn the 15-minute chart, XAUUSD showed a strong upward momentum starting below the 3,300 USD mark, reaching a peak near 3,346 USD. This rally was supported by a clear bullish structure and an ascending trendline.
However, once the price hit resistance at the top, selling pressure intensified, pushing the price into a downward correction. A clear pullback zone has formed between 3,346 USD and the support area around 3,318 USD — currently acting as a buy-side liquidity pocket.
Crucially, the price broke below the previous uptrend line and is now being capped by a descending resistance trendline, indicating a short-term bearish bias. Multiple failed attempts to break above the 3,332 – 3,335 USD area confirm that sellers still have the upper hand.
Additionally, the price action within this correction zone hints at a potential distribution pattern. Without strong buying interest to reclaim the 3,335 USD level, further downside remains possible.
Suggested Trading Strategy:
In the short term, traders may consider a “Sell on Rally” approach if price continues to fail at the 3,332 – 3,335 USD resistance zone.
Conversely, if a clear breakout occurs above the descending trendline and especially above the 3,336 – 3,338 USD area, the bullish trend may resume.
Conclusion:
XAUUSD is undergoing a technical pullback after a sharp rise. The market is currently in a tug-of-war between profit-taking pressure and recovery attempts. How price reacts at the current resistance will determine the next key move.

XAUUSD Analysis todayHello traders, this is a complete multiple timeframe analysis of this pair. We see could find significant trading opportunities as per analysis upon price action confirmation we may take this trade. Smash the like button if you find value in this analysis and drop a comment if you have any questions or let me know which pair to cover in my next analysis.

GOLD H2 Intraday Chart Update for 8 July 2025Hello Traders
Gold is still in a range between 3300 - 3350 Psychological level, all eyes on breakout of both mentioned psychological levels for now
Intraday Strong support zone is located 3290-3300
Intraday Strong Resistance zone is located 3350-3360
US TARIFF WAR remains agenda for now
Disclaimer: Forex is Risky

XAUUSD SELL OR BUY (READ CAPTION)Hi trader's what do you think about gold
current price: 3340
gold is rest now in resistance zone i think gold retest down side and giving retrcement
resistance zone 3345_3350
target point :3316_3310
stop loss 3362
please like comment and follow thank you

Gold price analysis July 8In the previous US session, strong buying pressure pushed gold prices up and formed a bullish hammer candlestick pattern on the D1 chart - a potential sign for an uptrend recovery.
🔄 Today's scenario: The correction in the early session is considered a good opportunity to buy, expecting the price to continue the uptrend.
📍 Nearest resistance zone:
The price is currently facing the resistance zone of 3344 in the European session. If gold breaks 3344, the next target will be 3365 - the gap zone that has not been filled.
However, according to the wave structure, it would be more optimal if the price has a retest to the 3320 zone, accumulates more buying momentum and then breaks out strongly through 3344.
📉 Bearish scenario:
If 3320 is broken, especially with a trendline and support zone breakout signal, a sell strategy can be activated with a lower target.
🔸 Support: 3320 – 3297
🔸 Resistance: 3345 – 3352 – 3365
🔸 Sell is triggered if: Price breaks 3320, confirms breaking trendline & support zone.
💬 Do you have any comments on this trading plan? Leave a comment!

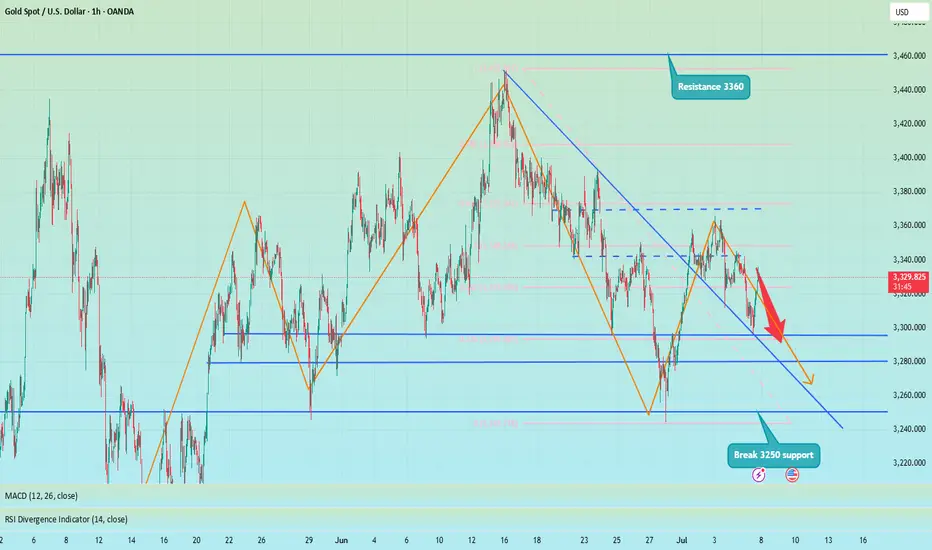
XAUUSD D1 – Gold Under Long-Term Bearish PressureGold is currently trading around 3,328 USD after failing to break above the descending trendline that started from the mid-June peak. On the chart, the price forms a series of lower highs and lower lows — a classic signal of a medium-term downtrend.
The descending trendline (green) acts as dynamic resistance. Each time price approaches it, strong selling pressure pushes it back down, showing sellers are in control.
In the short term, the 3,300 – 3,310 USD area serves as immediate support. If this zone is broken, price could drop further toward the major support zone around 3,260 – 3,270 USD.
Conversely, a confirmed reversal would only be valid if price breaks above the descending trendline and closes sustainably above 3,371 USD — a historically significant distribution zone.
The most recent daily candle is a small-bodied red candle with a long lower wick, indicating weak buying pressure and market indecision — typical in a consolidation phase before further downside.
Strategy Summary:
Favor short positions on pullbacks to the descending trendline.
Avoid bottom-fishing until a confirmed breakout above major resistance.
Traders should monitor the 3,300 USD zone closely in upcoming sessions.
Note: The analysis above is for informational purposes only and does not constitute investment advice. Stay tuned for further updates and adjust your trading plan accordingly.
What’s your take on the next move for gold? Share your thoughts in the comments!

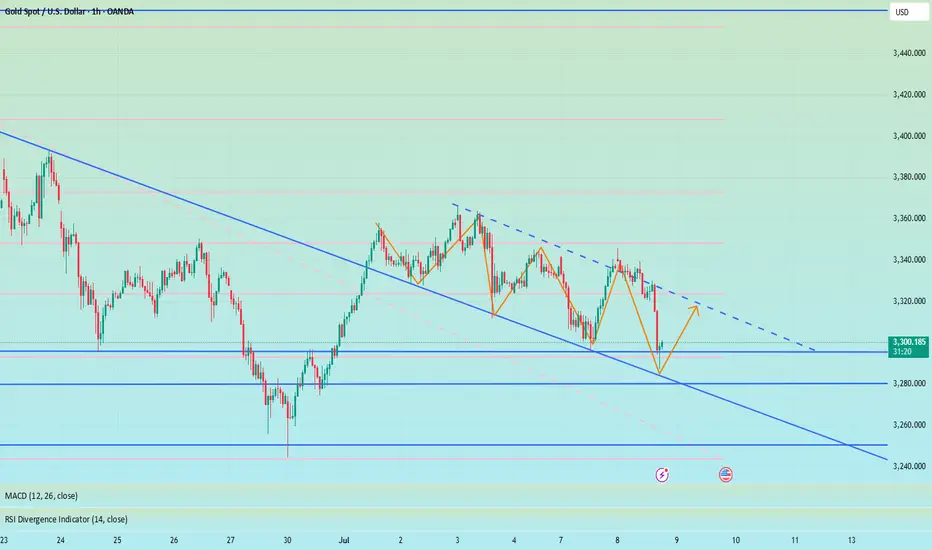
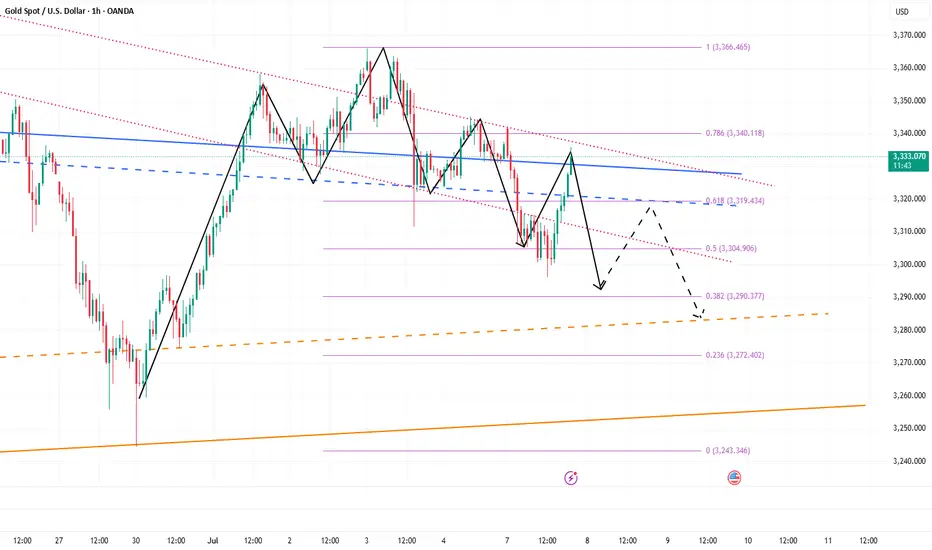
Shorts trapped? No, the head and shoulders top is still downOver the weekend, I gave a trading strategy for going long at 3315-3305. Today, I updated and optimized the long order trading, maintained the high-short-low-long trading strategy, and began to rebound near the 3300 line, and successfully touched the long TP 3333. At present, I am executing short trades again according to the trading strategy and holding short orders.
Although gold has only retreated to around 3330, I am not worried about losses and failures in short trades. As I wrote in today's post, the daily K-line chart has a head and shoulders top pattern. As long as the bulls fail to recover 3360, it is still a short trend. Therefore, in the short term, I still think that the rebound is a good opportunity for us to go short.
At present, the short-term bullish momentum of gold has been consumed and the downward trend continues. Therefore, I still insist on holding short orders in the short term.
In addition to investment, life also includes poetry, distant places, and Allen. Facing the market is actually facing yourself, correcting your shortcomings, facing your mistakes, and being strict with yourself. I share free trading strategies and analysis ideas every day for reference by brothers. I hope my analysis can help you.
FXOPEN:XAUUSD PEPPERSTONE:XAUUSD FOREXCOM:XAUUSD FX:XAUUSD FXOPEN:XAUUSD OANDA:XAUUSD TVC:GOLD
The short position is losing money. What should we do?Gold hit the intraday low of around 3296 and then began to rebound. We can see that the rebound of gold is not strong, but it is relatively sustained, so gold has rebounded to around 3335. To be honest, I did short gold according to my plan and still hold a short position.
Although gold has rebounded to around 3330, I don’t think my short gold trade has failed. As I said in the previous point of view, gold is facing technical suppression of the head and shoulders in the short term, which will suppress the rebound limit within the 3335-3340 area. So before gold stabilizes at 3340, I think the gold shorts still have the upper hand. So as long as gold stays below 3340, I think the gold rebound is a good opportunity to short gold.
At present, gold is facing the resistance area of 3335-3340 and begins to show signs of stagflation. After consuming a certain amount of bullish momentum, the gold shorts may counterattack strongly again and stimulate gold to fall rapidly. Therefore, before gold breaks upward through the 3335-3345 area, we can still consider shorting gold, or continue to hold a short position in gold!
90-day tariffs expire, how to position gold next week📰 News information:
1. 90-day tariffs are about to expire
📈 Technical Analysis:
With the Trump administration's massive tax cut and spending bill officially implemented, the U.S. Treasury may start a "supply flood" of short-term Treasury bonds to make up for the trillions of dollars in fiscal deficits in the future. Concerns about the oversupply of short-term Treasury bonds have been directly reflected in prices. The yield of 1-month short-term Treasury bonds has risen significantly since Monday this week. Slowing wage growth, falling total work hours, stagnant wage income growth and concerns about consumer spending are all signs that support gold.
From a technical perspective, Friday's closing long shadow small candle body, the price closed at a high of 3345 and a low of 3224. The overall idea for next week is to follow the trend and rely on the first short-term support of 3323 below to participate in long positions. Secondly, 3315-3305 is given below. If the support point is lost, then 3300 below is also in danger, and there is no need to overly insist on continuing to do more at low levels in the short-term rhythm. The key pressure above is 3340-3350, and the limit is the pressure of 3360 above.
🎯 Trading Points:
BUY 3325-3323
TP 3333-3340-3350
BUY 3315-3305
TP 3325-3333-3340
In addition to investment, life also includes poetry, distant places, and Allen. Facing the market is actually facing yourself, correcting your shortcomings, confronting your mistakes, and strictly disciplining yourself. I hope my analysis can help you🌐.
FXOPEN:XAUUSD PEPPERSTONE:XAUUSD FOREXCOM:XAUUSD FX:XAUUSD OANDA:XAUUSD TVC:GOLD

GOLD TODAYHello friends🙌
🔊Due to the weakness of buyers and the strength of sellers, the price continues to fall...
We have identified two supports for you that will not be seen if the price continues to fall, and if the selling pressure increases, we will update you.
🔥Join us for more signals🔥
*Trade safely with us*

Gold: update hello friends✋️
According to the recent growth of gold, you can see that it is constantly resisting and forming a falling pattern.
For this reason, it can be a warning that the fall can continue and the price will fall to the specified limits.
🔥Follow us for more signals🔥
*Trade safely with us*

7/7: Key Zone – 3320 to 3350Good morning, everyone!
Due to the U.S. market closure on Friday, price movement remained relatively subdued, and the week concluded with modest gains. As of this morning, gold opened higher but has since pulled back, and the price remains in a consolidation phase.
Key technical levels for today:
Resistance: around 3350
Support: near 3321
Short-term traders may focus on range-bound strategies between these levels. If a breakout occurs, follow the trend accordingly:
If price breaks above and stabilizes above 3338, the market may shift its focus toward the 3400 psychological level;
If price drops below and holds under 3332, there’s potential for a retest of the 3260 support zone.
In terms of broader trend analysis, the MA20 and MA60 on the daily chart should be watched closely, as they currently serve as key dynamic resistance and support levels.
Lastly, stay alert to any developments related to trade tariffs, as such news may significantly impact market sentiment and gold price direction.

Gold fluctuates, beware of rebound caused by new tariffs📊 Gold Day Trading Strategy (Recommendation index ⭐️⭐️⭐️⭐️⭐️)
📰 News information:
1. 90-day tariffs are about to expire
2. New unilateral tariffs
3. Geopolitical situation
📈 Technical Analysis:
As I said this morning, shorting gold is divided into two times, the first time is near 3324, and the second time is at 3340 or 3345. If there is a short-term retracement after breaking through 24, you can follow up with a long order to look at 3335-3340. If gold is in a very weak state, you can consider shorting near 3315 and look at 3300. Because during the European session, 3300 has strong support, and the European session repeatedly tests this support. If it falls below 3300, we will go to 3295-3285, or even 3250. But at the same time, we need to pay attention to the rebound of gold that may be caused by tariff policies and geopolitical situations.
🎯 Trading Points:
SELL 3315-3325-3335
TP 3305-3295-3285
BUY 3290-3285
TP 3300-3310-3320
In addition to investment, life also includes poetry, distant places, and Allen. Facing the market is actually facing yourself, correcting your shortcomings, facing your mistakes, and being strict with yourself. I share free trading strategies and analysis ideas every day for reference by brothers. I hope my analysis can help you.
TVC:GOLD OANDA:XAUUSD FX:XAUUSD FOREXCOM:XAUUSD PEPPERSTONE:XAUUSD FXOPEN:XAUUSD

New tariffs are coming. How should gold respond?📰 News information:
1. 90-day tariffs are about to expire
2. New unilateral tariffs
3. Geopolitical situation
📈 Technical Analysis:
On July 4th local time, there were constant turmoil in American politics and trade. Trump declared that the US government would send letters to trading partners that day to set new unilateral tariff rates, which would most likely take effect on August 1. He also revealed that the new tariff rates could soar to 70%. At the same time, Japan-US trade negotiations encountered obstacles, India planned to impose retaliatory tariffs on the United States, and the China-EU tariff war had also begun. At present, the news seems to be more favorable to the bulls.
From a technical point of view, gold closed higher last week, showing that there is still upward momentum this week. In the short term, we need to pay attention to the pressure in the 3365 and 3375 - 3380 areas, and the 3400 mark is a key position where bulls and bears are fighting fiercely. Before breaking through this position, we must be alert to the risk of falling back after a high rise. Pay attention to the support of 3310-3305 and 3295-3285 below. If effective support is obtained, we can consider going long. If it breaks, it may go to 3270-3260. Gold jumped to 3342 at the opening of the Asian session and then fell back. 3345 is the key in the short term. The news may affect its subsequent trend. In the short term, pay attention to the suppression of 3345 on the upper side, and further to the strong resistance area of 3365-3380. If there is resistance and pressure, you can short at a high level. The impact of recent news is erratic, so enter the market with caution and be sure to set TP and SL strictly.
🎯 Trading Points:
SELL 3330-3345
TP 3320-3310-3295
BUY 3310-3305
TP 3320-3330-3345
In addition to investment, life also includes poetry, distant places, and Allen. Facing the market is actually facing yourself, correcting your shortcomings, confronting your mistakes, and strictly disciplining yourself. I hope my analysis can help you🌐.
TVC:GOLD OANDA:XAUUSD FX:XAUUSD FOREXCOM:XAUUSD PEPPERSTONE:XAUUSD FXOPEN:XAUUSD
