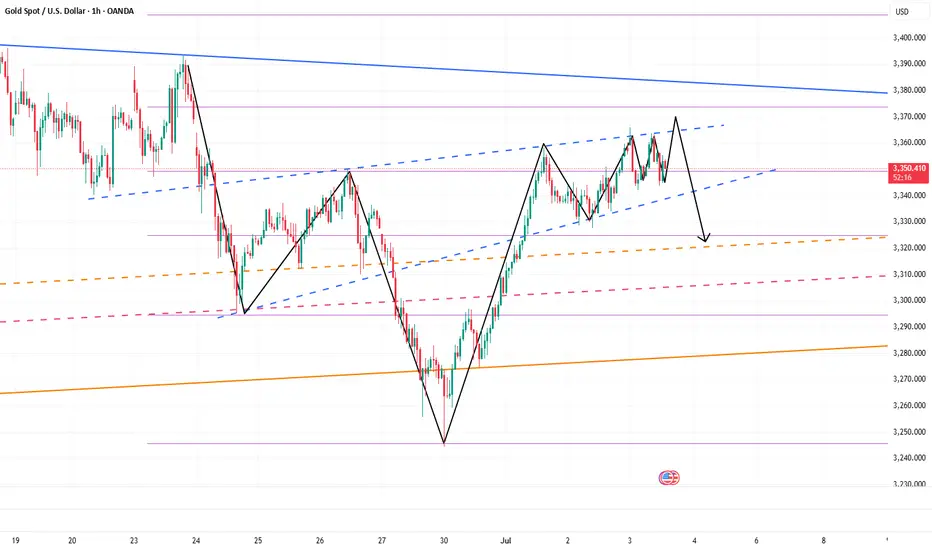
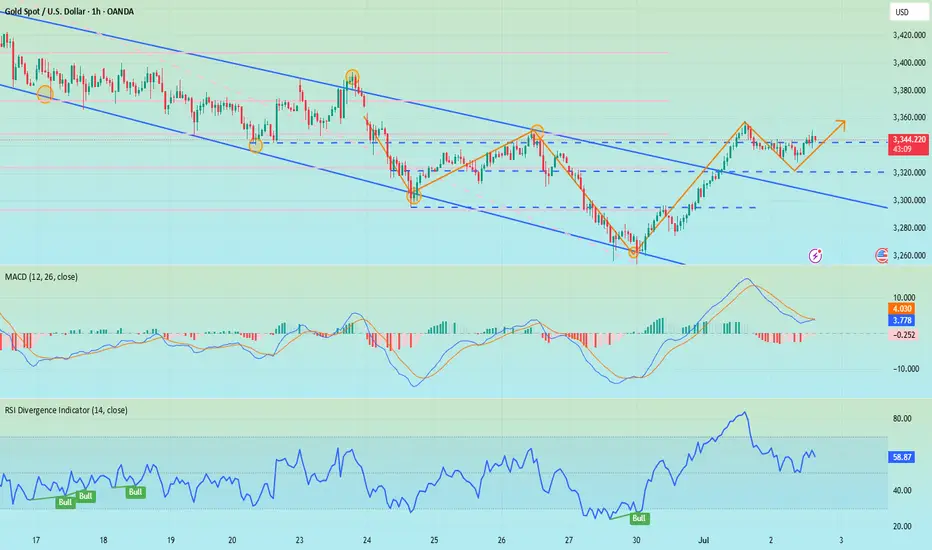
7/4: Trade Within the 3313–3346 RangeGood morning, everyone!
Yesterday’s intraday trades delivered solid profits. Since the U.S. market will be closed today, news-driven volatility is expected to be limited. Therefore, today’s trading focus will primarily revolve around technical setups.
Current structure:
Key support: 3321–3316
Immediate resistance: 3337–3342, followed by 3360
If support holds and resistance breaks, a potential inverse head-and-shoulders pattern may form on the 4H chart, with the next target near 3380
If support breaks, focus shifts to the 3303–3289 support zone
Given the likelihood of range-bound price action today, the suggested intraday range is 3313–3346, with a preference for selling near resistance and buying near support.
If an upside breakout occurs, consider using the MA20 on the 30-minute chart as a guide for pullback entries.
Xauusdshort

XAUUSD (GOLD): Sell setupXAUUSD (GOLD): Sell setup. It is ready for a sell, it will open in Asian session, and also market is complex now, but here is my plan.
Cheers

Will the NFP impact cause the bear market to dominate?📰 News information:
1. Initial jobless claims and NFP data
2. The final decision of the Federal Reserve
📈 Technical Analysis:
In the previous post, I have stated that if the hourly line closes above 3320, gold will fall into high consolidation in the short term. Currently, gold fluctuates narrowly in the short term. I think now we just need to be patient and wait for key points to enter the market. The daily and weekly lines clearly show that the high point of the oscillation range is constantly moving up, and the center of gravity continues to rise. The current market is quietly accumulating momentum, and a new round of weekly and monthly lines are about to rise. Therefore, first of all, I will pay attention to the defensive point below 3320, and then refresh the point below is the previously mentioned 3315-3305. If the point below is touched to get effective support, you can consider going long. Bros who trade independently must strictly set TP and SL to avoid the impact of market fluctuations.
🎯 Trading Points:
BUY 3320-3315-3310
TP 3330-3340-3360
In addition to investment, life also includes poetry, distant places, and Allen. Facing the market is actually facing yourself, correcting your shortcomings, confronting your mistakes, and strictly disciplining yourself. I hope my analysis can help you🌐.
FXOPEN:XAUUSD PEPPERSTONE:XAUUSD FOREXCOM:XAUUSD FX:XAUUSD OANDA:XAUUSD TVC:GOLD

NFP unexpectedly broke out, where will gold go?📰 News information:
1. Initial jobless claims and NFP data
2. The final decision of the Federal Reserve
📈 Technical Analysis:
The unexpectedly negative NFP data caused a sudden plunge in gold prices, which forced me to terminate the transaction urgently. Currently, gold has not fallen below the 3,300 mark. Therefore, I will still pay attention to the closing of the hourly line. If gold closes below 3,320, the downward trend will continue. On the contrary, if it closes above 3,320, gold will consolidate at a high level in the short term. Two days ago, I gave the support level of 3315-3305 below. Please be cautious in trading at the moment.
🎯 Trading Points:
For now, let’s focus on the hourly closing situation
In addition to investment, life also includes poetry, distant places, and Allen. Facing the market is actually facing yourself, correcting your shortcomings, confronting your mistakes, and strictly disciplining yourself. I hope my analysis can help you🌐.
TVC:GOLD OANDA:XAUUSD FX:XAUUSD FOREXCOM:XAUUSD PEPPERSTONE:XAUUSD FXOPEN:XAUUSD

Continue to maintain the rhythm of short tradingUnder the influence of NFP, gold fell sharply as expected. What I had suggested before was proven correct by the market again. "Gold rose in advance to reserve room for the NFP market to fall." After NFP, gold fell to around 3311 and the decline narrowed. Therefore, we accurately seized the opportunity to go long on gold near 3312 and set TP: 3330. Obviously, gold successfully hit TP during the rebound and made an easy profit of 180 pips.
From the current gold structure, gold encountered resistance and retreated twice near 3365, and built a double top structure in the short-term structure. In order to eliminate the suppression of the double top structure, gold still needs to continue to fall after the rebound. After the cliff-like decline of gold, the short-term resistance is in the 3340-3345 area, and the short-term support below is in the 3320-3310 area.
So I think that gold can still continue to short gold after the rebound, and I have already shorted gold around 3336 with the 3340-3345 area as resistance. Now we just need to wait patiently for gold to hit TP. Let us wait and see!

Gold Latest Market Trend AnalysisThe data released by the U.S. Bureau of Labor Statistics showed that the U.S. seasonally adjusted non-farm payroll employment in June was 147,000, with the consensus forecast at 110,000. The previous value was revised up from 139,000 to 144,000. The annual rate of average hourly earnings in June stood at 3.7%, below the expected 3.90%, while the prior figure was revised down from 3.90% to 3.8%.
Following the release of the non-farm payroll report, interest rate futures traders abandoned their bets on a Federal Reserve rate cut in July. Currently, the market-implied probability of a Fed rate cut in September is approximately 80%, down from 98% prior to the report. On Thursday, gold exhibited a seesaw pattern, surging initially to hit resistance near $3,365 per ounce before retreating. During the U.S. session, it broke below support levels and further declined to hover around $3,311, where it staged a rebound. Gold remains in a high-range consolidation under selling pressure.
you are currently struggling with losses,or are unsure which of the numerous trading strategies to follow,You have the option to join our VIP program. I will assist you and provide you with accurate trading signals, enabling you to navigate the financial markets with greater confidence and potentially achieve optimal trading results.
Trading Strategy:
sell@3350-3355
TP:3320-3325

XAUUSD 4H SHORTPrice broke out of the bearish trend line and moved sideways in a range forming two tops or a double top.
Fundamentally, US jobs data came out positive keying into hawkish tone on interest rate and influenced CPI.
Price broke the neckline after 4H closure giving signal for bearish move to $3250 support.
Here’s my little idea on GOLD. Follow for more.

Revealed: Beware of a strong counterattack from gold bears!Perhaps due to the impact of the NFP market later, gold fluctuated relatively cautiously today, and neither the long nor the short side showed signs of breakthrough, and the overall trend remained volatile. However, as gold rebounded, the market bullish sentiment gradually tended to be optimistic. In the short term, the lower support area was relatively obvious, that is, the second pull-up point 3335-3325 area, followed by 3315-3305 area;
However, as gold rebounded twice and fell after touching 3365, the suppression above was also obvious. In the short term, it faced the suppression of 3375-3385 resistance. If gold cannot effectively break through this area, gold bears may make a stronger counterattack, so I don’t think gold bears have no chance at all.
Therefore, I think there is still a good profit opportunity to try to touch the top and short gold. You can consider trying to short gold in the 3365-3375-3385 area and look at the target: 3340-3330-3320.
7/3: Focus on Short Positions, Watch Support Near 3320Good morning, everyone!
Yesterday, gold tested support near 3328 but failed to break below it effectively. The price then rebounded toward the 3350 level. At today’s open, gold briefly extended to around 3365 before pulling back.
Technically:
On the daily (1D) chart, the price remains capped by the MA20, with no confirmed breakout yet.
Support levels below are relatively dense, and moving averages are increasingly converging, suggesting a breakout in either direction is approaching.
Key intraday support lies in the 3321–3316 zone.
On the 2-hour chart, we are seeing the first signs of a bearish divergence, indicating a need for technical correction. Much like Tuesday’s setup, there are two possible scenarios:
If 3342–3334 holds, the price may extend slightly higher, intensifying divergence before pulling back;
If 3337 breaks, we could see a drop toward 3320, where correction would occur through a direct decline.
From a fundamental perspective, several high-impact U.S. data releases are scheduled for the New York session, which may increase volatility and make trading more challenging.
Trading suggestion:
For most traders, the safest approach is to wait for data to be released, then look for oversold rebounds or overbought corrections following sharp market reactions.
This style requires patience and strong risk control—avoid being overly aggressive or greedy, as such behavior can easily lead to trapped positions or even liquidation.

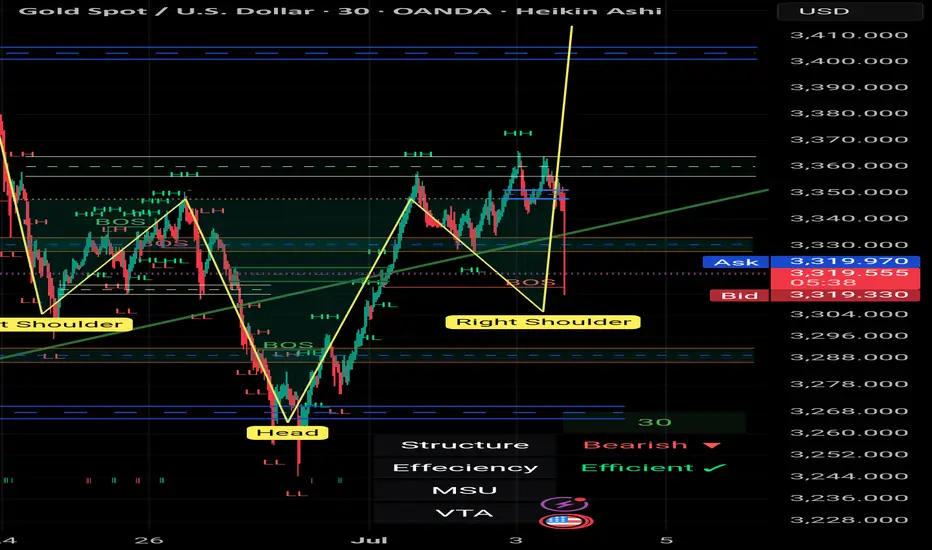
I say nothing , you say me any thing about 📌 **Gold Spot (XAU/USD) – 30m | 2h | Smart Money Perspective**
🔍 After weeks of precision tracking and structural validation, price has now tapped the **Right Shoulder** of a clean *Reverse Head & Shoulders* formation — with absolute respect to structure, liquidity, and OB zones.
💥 This wasn't just a random bounce.
It was:
- A confirmation of **previous BOS & CHoCH**
- A retest of **TLQ/ILQ liquidity zones**
- A reaction from the *Extreme OB* within a compression channel
- And a final push fueled by **inefficiency fills** on the left
🎯 The bullish intent remains strong, and if momentum follows through, we're looking at:
- **TP1** → 3345–3355 (minor OB & void fill)
- **TP2** → 3375–3390 (liquidity sweep target)
- **TP3** → 3420+ (range expansion goal)
🧠 This analysis has not just been correct.
It’s been **respected by the market.**
I take pride in every reaction the chart gives us when we respect the language of price, structure, and timing.
There’s no shortcut here — just observation, logic, and discipline.
We don’t chase the trend. We wait for it to **bow in confirmation**.
Like it just did.
— *Mohsen Mozafari Nejad* 🧭
#SmartMoney #GoldAnalysis #XAUUSD #TradingView #MarketStructure #BOS #OB #MSU #ReverseHeadAndShoulders #Forex #TechnicalAnalysis
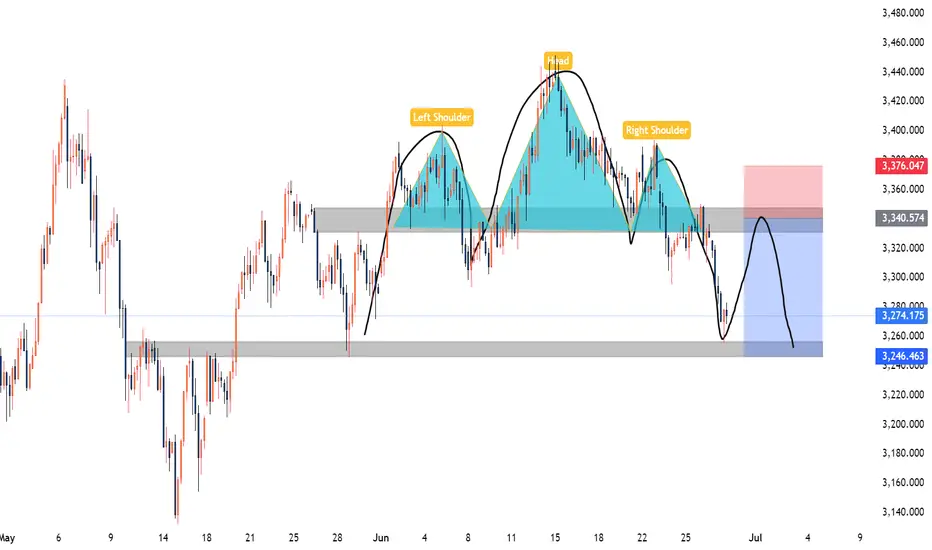
XAUUSD Weekly Analysis 30 June 4 July 2025Gold has formed a Head and Shoulders (H&S) pattern on the H4 timeframe. While the pattern is not perfectly symmetrical, it is still valid and clearly recognizable. The price has broken below the neckline, confirming a potential shift in market structure to the downside.
Analysis Insight:
The 3340–3350 area, previously a support zone, is now acting as resistance following the neckline break. A pullback to this zone may present a high-probability short opportunity for swing traders, especially if price shows rejection or bearish structure in that zone.
Trade Type: Swing
Trade Setup – Sell on Retracement:
Bias: Bearish on confirmation of retracement rejection
Entry Zone: 3340 – 3350
Stop Loss: 3376 (above right shoulder/high)
Take Profit: 3320/3300/3285/3260
Risk-Reward Ratio: Approximately 1:2
Kindly follow, share, like, support and comment.
GOLD - High placed? Short now?#GOLD... market placed 3362-64 after our last idea regarding gold buying.
And market behaved indicate us that that is a final high for now and below that a dip can be possible.
So keep close and don't buy until market holds..
Good luck
Trade wisely
Gold Price Analysis July 3GOLD Technical Analysis - D1 Frame
On the D1 frame, the uptrend is still being maintained with momentum towards the price gap zone. During the European session, selling pressure started to appear around the resistance zone of 3365 - showing that this is the area where the sellers are making counter-moves.
On the chart, the gold price is accumulating and forming a triangle pattern, indicating the possibility of a strong movement phase.
If the price breaks the upper border of the triangle (above the 3363 zone), it will likely open up an opportunity to approach the next resistance at 3388.
On the contrary, if it breaks the lower border (below the 3330 zone), the correction trend may be triggered, heading towards deeper support zones.
Important Zones:
Resistance: 3363 – 3388
Support: 3330 – 3311 – 3297 – 3277
Trading Strategy:
BUY Breakout: When price breaks above 3363
SELL Breakout: When price breaks below 3330

XAUUSD Set for Strong Bullish Wave – Targeting 3,726?Gold (XAUUSD) is showing signs of a bullish recovery after a recent correction between the 3,290–3,340 USD zone. On the daily chart, a clear Elliott Wave formation is unfolding, with the price potentially entering wave 5 aiming for the 0.618 Fibonacci extension at 3,726 USD.
Clear Wave Structure:
The a-b-c corrective wave appears to have completed in mid-May.
The price is now in wave 3 and preparing for a potential extension in wave 5.
Candlestick and Buying Momentum:
Recent candles show strong buying pressure with four consecutive bullish sessions.
The current upward momentum is testing the 3,352 resistance – a breakout could open the path to 3,450 and eventually 3,726 USD.
Support & Resistance Levels:
Immediate support: 3,320 – 3,330 USD
Key resistance: 3,450 USD (recent swing high)
Extended target: 3,726 USD (Fibonacci 0.618 from wave 2 low to wave 3 peak)
Suggested Trading Strategy:
Favor buy on dip strategy, waiting for a minor pullback to the 3,330–3,340 area before entering long.
Set stop-loss below 3,300, with targets at 3,450 and 3,726 USD respectively.
Conclusion:
The XAUUSD chart suggests a potential strong bullish wave according to the Elliott Wave framework, with a breakout likely leading to the 3,726 USD zone. Traders should closely monitor price action around the 3,350 level for confirmation of continued upward momentum.
What’s your view on this analysis? Drop a comment and let’s discuss your trading strategy together!

Gold trend analysis and layout before NFP data📰 News information:
1. Initial jobless claims and NFP data
2. The final decision of the Federal Reserve
📈 Technical Analysis:
Due to the Independence Day holiday this week, the NFP data was released ahead of schedule today, while the policy differences within the Federal Reserve have brought uncertainty to the market. Judging from the market trend, the 4H level shows that the gold price tested the upper track yesterday and then turned to high-level fluctuations after coming under pressure. In the short term, the structure still has bullish momentum after completing the accumulation of power. Although there was a correction in the US market yesterday, it stopped falling and rebounded near 3335, further confirming the strength. At present, the upper resistance in the European session is at 3365-3375, and the short-term support is at 3345-3335 below. Intraday trading still requires good SL to withstand market fluctuations. In terms of trading, it is recommended to mainly go long on callbacks
🎯 Trading Points:
SELL 3365-3375
TP 3350-3340-3335
BUY 3335-3330-3325
TP 3350-3360-3375
In addition to investment, life also includes poetry, distant places, and Allen. Facing the market is actually facing yourself, correcting your shortcomings, confronting your mistakes, and strictly disciplining yourself. I hope my analysis can help you🌐.
FXOPEN:XAUUSD PEPPERSTONE:XAUUSD FOREXCOM:XAUUSD FX:XAUUSD OANDA:XAUUSD TVC:GOLD

Elliott Wave Analysis of XAUUSDOn the daily chart of XAUUSD, we are witnessing a clearly defined Elliott Wave structure, with the potential formation of an extended wave (5) targeting the $3,726 region — aligned with the 0.618 Fibonacci extension. This is a key technical signal that could capture the attention of both long-term investors and strategic swing traders.
1. Elliott Wave Overview:
Wave (3) concluded at the peak around $3,365, followed by a textbook a-b-c corrective pattern.
Waves "a" and "b" are clearly identifiable, with wave "c" appearing to have completed.
The current price action suggests a rebound from the bottom of wave c — a strong indication of a possible start to wave (5).
2. Wave (5) Target Zone:
The Fibonacci 0.618 extension projects a target near $3,726 — a significant price level the market could approach if bullish momentum builds up.
This level also serves as a psychological resistance zone, so expect possible volatility as the price nears this area.
3. Price Behavior & Confirmation Signals:
Recent candlestick formations reveal renewed buying interest, with multiple bullish candles showing long bodies and lower wicks.
Holding above the key support around $3,300 is crucial for confirming the formation of an uptrend.
A breakout above the $3,365 high (wave (3) peak) would be a strong signal that wave (5) is in motion.
4. Suggested Trading Strategies:
Buy limit: Consider entries around the $3,310 – $3,320 support zone on a retest.
Buy breakout: Trigger entries if price breaks decisively above $3,365 with strong volume.
Take profit: Gradually scale out positions around the $3,680 – $3,726 area.
Stop loss: Place stops below the wave c bottom — under $3,245.
5. Conclusion:
XAUUSD is currently in a sensitive phase with a high probability of a bullish breakout. The Elliott Wave structure shows that there is still considerable upside potential. However, traders should maintain strict risk management, as wave (5) formations often involve significant price swings.

XAUUSD Technical Analysis – 02/07/2025On the 1-hour chart, Gold (XAUUSD) has just confirmed the completion of corrective wave (4) around the 3,328.3 zone, which aligns with the 1.0 Fibonacci level and EMA9 support. Currently, price is rebounding with increasing volume, signaling that buying momentum is returning.
Key Technical Highlights:
Elliott Wave Structure:
Wave (4) found support at 3,328.3.
Wave (5) targets are forming, with Fibonacci extensions pointing to:
0.618: 3,360.05
1.0: 3,380.07
=> These are critical resistance zones to watch.
Fibonacci Retracement Zones:
The current rebound is heading toward the 0.5 and 0.618 retracement levels of the previous down leg, located at 3,362.4 and 3,354.4 – short-term upside targets.
Volume Analysis:
Rising volume on bullish candles confirms a legitimate buying interest, supporting the upward movement.
EMA9 Breakout:
Price has broken above the EMA9 at 3,338.2, shifting short-term trend bias to bullish.
Suggested Trading Strategy:
Favor Buy on Dip entries near the 3,340–3,342 zone if a minor pullback occurs.
Short-term targets: 3,354 – 3,362
Extended target: 3,380
Suggested stop loss below 3,328.0 to manage risk.
Conclusion:
A bullish impulse is forming following the end of wave (4). If price holds above 3,340 and breaks through the nearby Fibonacci resistance levels, wave (5) could extend towards the 3,380 area. This is a pivotal moment to watch for a confirmed short-term uptrend.

I have shorted gold as expected and held on patientlyEven under the influence of the ADP data, which is bullish for the gold market, gold has not effectively broken through 3350, and even showed signs of falling back after rising several times. The resistance above is becoming more and more obvious, which may further weaken the market's bullish sentiment and confidence, thereby strengthening the dominance of the bears.
Although gold has not effectively fallen yet, from the perspective of the gold structure, even if gold wants to rise, it still needs to be backtested and support confirmed before rising, and the current retracement is far from enough, so gold still has a need for structural retracement; and before the NFP market, gold rose slowly but was far from enough to break upward, and there was no volume support, so the illusion of gold rising may be to lure and capture more bulls;
Therefore, out of caution, I try to avoid chasing gold at high levels; and I believe that shorting gold is still the first choice for short-term trading at present. And I have executed short trades in the 3340-3350 area according to the trading plan, and held it patiently. I hope that gold can retreat to the 3320-3310-3300 area as expected.

ADP data has been released, how to position gold in the future📰 News information:
1. ADP data, for reference of tomorrow's NFP data
2. Interest rate cuts and Powell's dovish comments
3. Geopolitical impact on the gold market
📈 Technical Analysis:
The ADP data was significantly bullish after it was released, but gold did not rise sharply in the short term. Instead, it touched the resistance of 3350 that we gave and then fell back. I also saw a lot of fake traders in the market who immediately told their brothers to go long and look towards 3380 after the ADP data was released. To be honest, I think these people are typical hindsight experts. If everyone is like this, then anyone can be called a trader, right?
Back to the topic, I still hold short orders at 3340-3350. In the short term, gold will fluctuate and be bearish to seek restorative support, so the best place to go long is to look at the retracement below, which will at least touch 3333-3323. If it falls below this support, it will go to 3315-3305. On the contrary, if it gets effective support at 3333-3323, then gold will rebound as expected to form a head and shoulders bottom.
🎯 Trading Points:
SELL 3340-3350-3355
TP 3333-3323-3315-3295
BUY 3335-3325
TP 3345-3355-3375
In addition to investment, life also includes poetry, distant places, and Allen. Facing the market is actually facing yourself, correcting your shortcomings, confronting your mistakes, and strictly disciplining yourself. I hope my analysis can help you🌐.
FXOPEN:XAUUSD PEPPERSTONE:XAUUSD FOREXCOM:XAUUSD FX:XAUUSD OANDA:XAUUSD TVC:GOLD
#XAUUSD: +2000 Swing Sell In Making! Get ReadyGold has dropped to the 3330 region but has now reversed and is currently trading at 3350. The next potential move could be at 3380, followed by 3400. Our sell entry is at 3400, where we believe the price will reverse. Our long-term view is that gold will head towards 3100, but our first target will be 3200. Please use accurate risk management when trading gold, as it can cause serious financial issues if not planned properly. This analysis does not guarantee any price movement.
Good luck and trade safely!
Team Setupsfx!

Gold is moving in a range-bound consolidation.The ADP employment data in the U.S. unexpectedly cooled down, with private sector employment dropping by 33,000 in June, far below the market expectation of an increase of 95,000. The previous value was revised down from 37,000 to 29,000, marking the largest single-month decline since March 2023. Meanwhile, the Challenger Enterprise Layoff Report showed that the number of layoffs in June was 48,000, with a monthly rate decrease of 48.84% and an annual rate decrease of 1.6%. Compared with the previous value of 93,800, it has significantly declined, indicating that the layoff pressure has eased. After the release of the ADP data, the U.S. Dollar Index fell sharply in the short term, and gold, as a safe-haven asset, rose rapidly. Gold showed a high-level consolidation trend. After repeatedly stabilizing in the 3,327 area, it rebounded and hit the resistance at around 3,351 U.S. dollars, lingering there. It is expected that the range consolidation of gold may face pressure.
you are currently struggling with losses,or are unsure which of the numerous trading strategies to follow,You have the option to join our VIP program. I will assist you and provide you with accurate trading signals, enabling you to navigate the financial markets with greater confidence and potentially achieve optimal trading results.
Trading Strategy:
buy@3330-3335
TP:3360-3365

Gold Trading Strategy February 7✏️As expected from the analysis, after the D1 candle showed buying pressure again, the price continued its uptrend yesterday and reached 3357.
Currently, the price is consolidating within a relatively wide sideways range, extending from 3328 to 3344.
A trend-following trading strategy will be set up when the price breaks out of this range.
The BUY signal is expected to bring good profits if the price retests the support.
The SELL signal at resistance is considered to look for rebound points in an uptrend.
📈 Key Levels
Breakout Range: 3344-3328
Support: 3310-3298
Resistance: 3368-3386
📊 Recommended Trade Setups
BUY: 3310-3308 | SL: 3305
SELL: 3368-3370 | SL: 3373

XAUUSD Analysis – July 2–3, 2025: Resistance Holds Gold is currently trading around 3,337 USD, having tested the 3,350 USD resistance zone without a successful breakout. The price remains under pressure from key macroeconomic factors:
- The Dollar Index (DXY) is stable above 106 – a sign of continued demand for the greenback, which weakens gold.
- U.S. 10-year Treasury yields hold around 4.35%, reinforcing the view that the Fed will keep interest rates high.
- The Core PCE report for June remains above the Fed’s 2% inflation target, decreasing expectations of a rate cut in Q3.
- Safe-haven demand is weak, as geopolitical tension in the Middle East and Eastern Europe remains subdued.
➡ Overall, these factors confirm that XAUUSD remains under bearish pressure in both the short and medium term, especially while key resistance remains intact.
1. Technical Analysis – XAUUSD on D1 Chart
- Price recently tested the 3,340 – 3,350 USD resistance zone, a confluence of:
Previous supply zone
- Fibonacci retracement 0.5–0.618 from 3,399 USD
- Key Change of Character (CHoCH) level
- RSI is forming a mild bearish divergence, signaling weakening bullish momentum.
- EMA20 and EMA50 are both sloping downward – confirming the prevailing bearish trend.
This setup is typical of a Sell on Rally pattern, with each retracement being rejected at strong resistance.
2. Key Technical Zones to Watch
Technical Role
- 3,350 – 3,340 Major resistance (Fibo 0.5–0.618 + supply + CHoCH)
- 3,294 – 3,285 Nearest support – previously a resistance-turned-support
- 3,255 – 3,235 Short-term target zone – June low
- 3,223 – 3,205 Strong medium-term support – April low + extended Fibo
3. Suggested Trade Setup
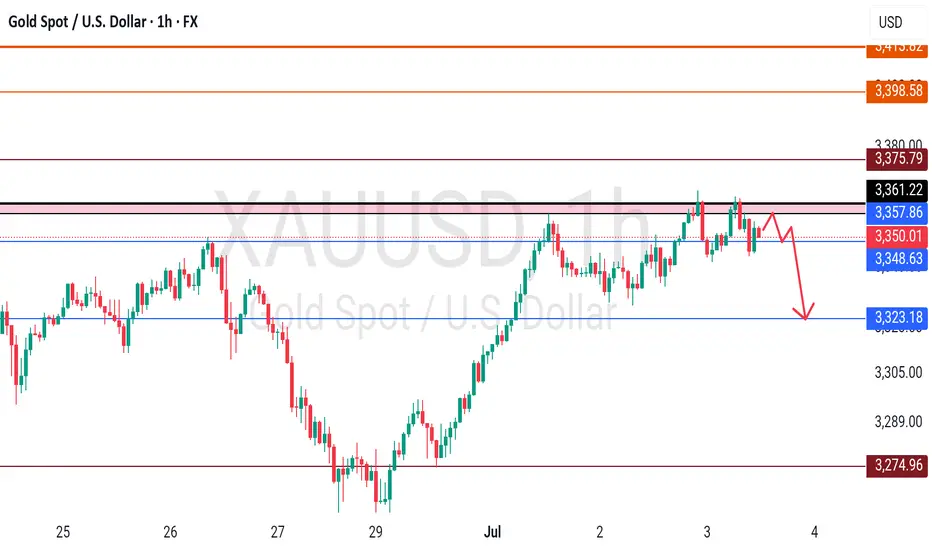
Preferred Scenario: SELL below 3,350
Entry: 3,345 – 3,347
Stop Loss: 3,351
Take Profit 1: 3,335
Take Profit 2: 3,330
Take Profit 3: 3,320
Ps : XAUUSD is retesting a major resistance zone without macro or technical catalysts for a sustained breakout. The best approach remains to sell at resistance and take profit near support, in alignment with the ongoing bearish trend.
The strategy will be updated regularly – don’t forget to save and follow to stay ahead of market opportunities.
The analysis was provided by @Henrybillion
