#XAUUSD #GOLD 30Min 📉📈 #XAUUSD 30m Analysis – Dual Setup Scenario
We’re monitoring two potential trade setups depending on how price reacts at key levels:
🔴 Sell Setup:
Price is entering a Sell-Side Order Block Zone between 3350–3360, aligned with a Fair Value Gap (FVG). This premium zone is likely to act as strong resistance, with potential rejection targeting downside liquidity near 3310 — an ideal area for short positions.
🟢 Buy Setup:
If price sweeps below and taps into the Liquidity Zone / Demand Area around 3305–3311, we’ll watch for a bullish reversal from this discount zone. This area offers a favorable setup for long entries, aligning with institutional buying levels.
📌 Be sure to mark these key zones on your chart for enhanced clarity and execution.
💬 What’s your outlook on Gold? Share your thoughts below 👇
Xauusdshort

XAUUSD:Short sell at 3340-45
Today's trading needs to narrow down the range. There are signs that the center of gravity below is gradually moving upward. During the Asian session, the highest point reached around 3343. Friends who have already bought short positions here can wait for 3320-25 to take profits and exit. Those who haven't bought can wait for 3340-45 to short, with the target also being 3320-25
Trading strategy:
SELL@3340-45
TP:3320-25
It can be considered to go long when it reaches around 3320-25
More detailed strategies and trading will be notified here ↗↗↗
Keep updated, come to "get" ↗↗↗

6/26 Gold Analysis and Trading ViewGood morning, everyone!
Yesterday, gold rose to around 3336 before pulling back, then revisited the same level again. The buy-on-dip strategy performed well, delivering solid profits.
At today’s open, prices have moved slightly higher but remain near resistance. Technically, there’s potential to test the 3350 area, and if the move is strong, a rally toward 3370 is also possible.
If gold reaches this zone, it may present a favorable short-term selling opportunity. Therefore, today's trading strategy should focus on range-based trading between 3326-3368, selling near resistance and buying near support.
Key levels to watch:
Resistance: 3348–3352
Support: 3326–3318
Lastly, be mindful: if a trending move emerges, adjust your strategy accordingly and avoid counter-trend trades. Stay flexible and manage risk wisely.

XAUUSD has been in a strong free fall following the sell strategXAUUSD has dropped sharply in a free fall, perfectly following the sell strategy from 3348–3350.
We have won.
Trading Strategy for XAUUSD OANDA:XAUUSD
Based on the current price structure and short-term bias, here are two tactical trade setups:
Sell Setup – If Price Rejects Resistance
Entry: 3,348 – 3,350 USD
Stop-loss: 3,357 USD
Take-Profit 1: 3,340 USD
Take-Profit 2: 3,335 USD
Take-Profit 3: 3,330 USD
Buy Setup – If Price Holds Support
Entry: 3,328 – 3,330 USD
Stop-loss: 3,320 USD
Take-Profit 1: 3,338 USD
Take-Profit 2: 3,340 USD
Take-Profit 3: 3,348 USD
Important: Always set a stop-loss in every trade to manage risk effectively.

XAUUSD Trading Strategy for June 26–27, 20251. Market Overview
In today’s session (June 26, 2025), XAUUSD OANDA:XAUUSD (gold spot) is trading around 3,339.6 USD, posting a modest +0.22% gain compared to the previous day. The intraday range has been confined between 3,330 – 3,350 USD, reflecting a tug-of-war between buyers and sellers in this short-term equilibrium zone.
Following a recent corrective move, demand has reappeared around the 3,330 USD support. However, the recovery momentum is currently facing resistance near 3,350 USD, and the market will require a clear breakout to establish the next directional move.
2. Technical Analysis
Price Behavior
- Gold is moving sideways within the 3,330 – 3,350 USD range, which has acted as both support and resistance in recent sessions. It is also a high-liquidity zone, indicating indecision among market participants.
- The rebound from the 3,291 – 3,317 USD support zone is still ongoing, but there is no confirmation yet of a completed downtrend or trend reversal.
RSI Indicator
- The RSI (14) is currently fluctuating within the neutral zone (49–54), suggesting a lack of strong momentum in either direction.
- A sustained move above 55 could signal the return of bullish strength.
3. Key Technical Zones
Resistance:
- 3,350 USD: Frequently rejected intraday, immediate resistance to watch
- 3,373 – 3,392 USD: A major confluence of the Fibonacci 0.618 retracement and previous supply zone from last week
Support:
- 3,330 USD: Intraday support and equilibrium zone
- 3,291 – 3,317 USD: Strong structural support in case of further pullback
4. Trading Strategy for XAUUSD OANDA:XAUUSD
Based on the current price structure and short-term bias, here are two tactical trade setups:
Sell Setup – If Price Rejects Resistance
Entry: 3,348 – 3,350 USD
Stop-loss: 3,357 USD
Take-Profit 1: 3,340 USD
Take-Profit 2: 3,335 USD
Take-Profit 3: 3,330 USD
Buy Setup – If Price Holds Support
Entry: 3,328 – 3,330 USD
Stop-loss: 3,320 USD
Take-Profit 1: 3,338 USD
Take-Profit 2: 3,340 USD
Take-Profit 3: 3,348 USD
Important: Always set a stop-loss in every trade to manage risk effectively.
Ps: XAUUSD remains in a short-term consolidation phase, oscillating within a narrow range of 3,330 – 3,350 USD. A breakout beyond this range will likely define the market's direction heading into the New York session. Traders are advised to monitor price action closely within these levels and wait for clear confirmation before executing any positions.
Stay tuned for more daily gold strategies, and don’t forget to save this analysis if it helps refine your trading plan.
Analysis by @Henrybillion

Gold Breakout Done New Short Entry Valid To Get 200 Pips !Here is my opinion on gold at he moment , in 15 mins T.F wr have a fake breakout but 3343.00 forced the price to go down which is a great res for this pair and we have avery good bearish price action and good closure below my res level 3341.00 so it`s my num 1 place to enter a sell trade if the price go back to retest it , and if not , 3383.00 will be my best place to sell it .

gold on bearish retest#XAUUSD price have retrace back 3350.2 which is retesting back below day low.
Below 3336 holds short sell which target 3330-3317, but main entry for selling 3330, SL 3346.
Breakout above 3350.2 holds strong buy which will reach 3366 for bearish reversal.

It’s the right time to short goldThe daily gold line presents a three-top gathering pattern. The historical trend shows that the 3290-3280 area has triggered technical pullbacks many times, all of which rebounded to around 3350. The current 4-hour chart trend line suppression level coincides with the Fibonacci 0.618 pullback resistance from the previous high of 3450 to 3300 in the 3350-3360 range. This area constitutes the core pressure zone. If the price fails to effectively break through and stand above 3360 when it probes this area again, it is highly likely to replicate the previous two resistance and fall patterns. At that time, short orders will be arranged based on the 3350 first-line resistance area, with the goal of breaking the key support of 3300 and further looking down at the 3280 and 3260 levels. The overall bearish tendency is maintained, and the resistance to rebound is a signal to enter the market and sell short.
Gold recommendation: Gold is short around 3345-3352, target 3330-3320

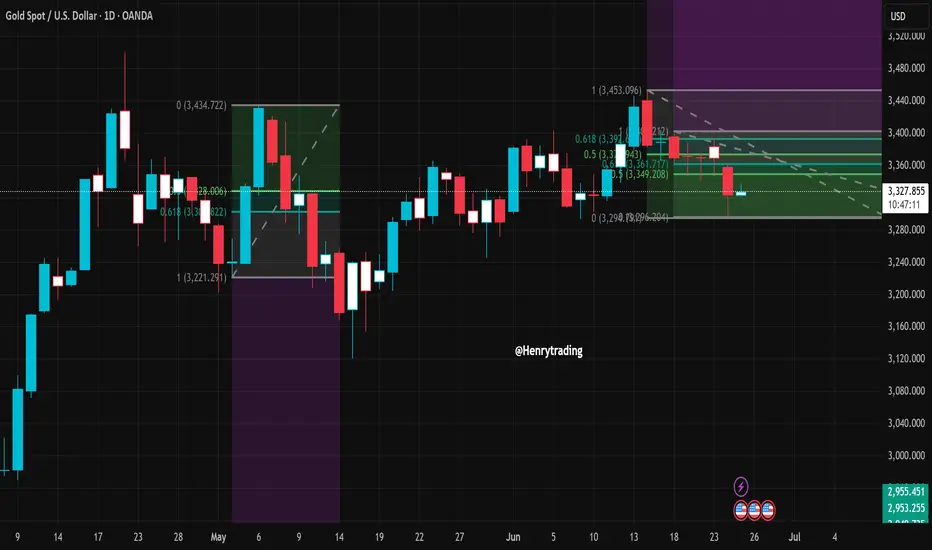
XAUUSD: Breakout or Bull Trap?Gold (XAUUSD) on the daily timeframe is showing signs of a temporary rebound after a sharp drop from the resistance zone at 3,452 USD. Specifically, the price has bounced back from the support area around 3,291 – 3,298 USD – a region aligned with dynamic EMA support and the 0.382 Fibonacci retracement of the previous bullish leg.
1. Key Technical Structure:
A clear reversal candlestick pattern has formed at a strong support zone, paving the way for a short-term technical rebound.
The 0.5 Fibonacci level at 3,346.5 is currently acting as the nearest resistance – aligning closely with today’s closing price.
EMA 20 and EMA 50 are beginning to converge, indicating market indecision on the next directional move.
2. Short-Term Price Scenarios:
Bullish Scenario: If price holds above the 3,291 – 3,298 support zone and breaks above 3,348, it could retest the 3,400 – 3,452 highs in the coming days. In this case, strengthening EMAs and bullish candle momentum would support this setup.
Bearish Scenario: Conversely, if the price fails to break through the 3,348 – 3,352 resistance zone and falls below 3,291 again, the market may head toward deeper support levels at 3,240 – or even as low as 3,167 USD.
3. Trading Recommendations:
Short-term Buy if there is a confirmed bullish candle closing above 3,348 with strong volume; stop loss below 3,291.
Sell on rally around 3,348 – 3,352 resistance if no clear breakout is confirmed.
Apply strict risk management, especially in a choppy market environment ahead of key macroeconomic data at the end of the month.
Conclusion:
XAUUSD is currently in a “trend re-evaluation zone.” Closely monitoring the 3,291 – 3,348 range will be the key to timing efficient entries in the short term.

The Direction After Sideways Fluctuation at 3330Trump's announcement of an Israel-Iran ceasefire dented safe-haven sentiment, curbing safe-haven buying 🛑. Gold opened with a sharp plunge, then extended losses as Powell later stated that more time is needed before considering rate cuts—dovish expectations eased, sending gold further lower ⬇️. The price briefly fell below the 3,300 level, nearing 3,295 at its lowest, but failed to breach the 3,290-3,300 support zone 📊. As I indicated yesterday, traders could test rebound strength near support; once news impacts faded, gold rebounded to close at 3,323 🔄.
Currently trading sideways around 3,330, gold faces resistance at 3,350 while downside support remains at 3,290-3,300 📈📉. We therefore maintain a bearish stance
⚡️⚡️⚡️ XAUUSD ⚡️⚡️⚡️
🚀 Sell@3345 - 3335
🚀 TP 3325 - 3315 - 3305
Accurate signals are updated every day 📈 If you encounter any problems during trading, these signals can serve as your reliable guide 🧭 Feel free to refer to them! I sincerely hope they'll be of great help to you 🌟 👇

GOLD Trading: trategy: Look to SELL at resistance zone,downtrend🎯 Trade Setup:
Entry Zone (Sell Limit): 3,353 – 3,357 USD
Stop Loss (SL): 3,375 USD
Take Profit (TP): 3,280 – 3,283 USD
Risk-Reward Ratio: Approximately 1:3 → suitable for 2–4 session swing trades.
📊 Technical Analysis:
1. Overall Trend:
GOLD is clearly in a downtrend, confirmed by:
A descending trendline connecting recent lower highs.
Price consistently forming lower highs and lower lows.
2. Indicator-Based Analysis:
🔹 SMA 89 (Purple Line):
Price is trading below the 89-period SMA, confirming bearish momentum.
SMA89 acts as a dynamic resistance, and the 3,353–3,357 zone aligns with this resistance level.
🔹 BB20 (Bollinger Bands):
The upper band sits near 3,383, close to the SL zone → validating 3,375 as a proper stop.
Price is currently bouncing from the lower BB, so a rejection from the mid-to-upper band is likely, supporting a SELL setup.
🔹 Volume Analysis:
Volume is decreasing during this recent rebound, indicating:
Weak bullish pressure, typical of a corrective move.
The rally lacks conviction → strengthens the bearish case.

XAUUSD Technical Outlook – Rebound or Trap?1. Market Overview
After a sharp rejection near the 0.618 Fibonacci level, XAUUSD has pulled back and is now trading around 3,323 USD. Although price has stabilized somewhat, technical indicators suggest this is likely a corrective move within a prevailing downtrend.
2. Technical Analysis
Price Action
XAUUSD is currently hovering near 3,323 USD after a failed attempt to break above the resistance zone at 3,373–3,392 USD — an area marked by:
The 0.618 Fibonacci retracement from the recent downtrend
Repeated historical rejections.
The upper boundary of a sideways consolidation range from early June.
Recent candlesticks show indecision and rejection from higher levels, suggesting sellers are still in control.
Support Zone Behavior
The price recently bounced from the 3,294–3,317 USD range, where strong historical support and the 0.382 Fibonacci level align.
This zone continues to hold, but if broken, could open the door to deeper declines toward the 3,250 or even 3,224 USD levels.
RSI Indicator
RSI remains flat around the neutral zone, indicating a lack of bullish momentum.
No significant divergence or breakout signals are currently visible on the daily RSI chart.
3. Key Technical Levels
Resistance:
3,373 – 3,392 USD: Confluence resistance zone (0.618 Fib + historical supply).
3,435 – 3,453 USD: Previous swing high – key medium-term benchmark
Support:
3,294 – 3,317 USD: Immediate support, holding for now.
3,250 – 3,224 USD: Potential next target zone if bearish pressure resumes.
4. Trade Setup Scenarios.
Scenario 1 – Buy if support holds and bullish confirmation appears
Entry: 3,295 – 3,305 USD.
Stop-loss: Below 3,289 USD.
Take-profit: 3,340 – 3,355 – 3,370 USD.
Condition: Look for bullish reversal patterns (e.g., Bullish Engulfing, Pin Bar) on H1–H4.
Scenario 2 – Sell on rejection from resistance zone
Entry: 3,370 – 3,375 USD.
Stop-loss: Above 3,392 USD.
Take-profit: 3,330 – 3,310 – 3,290 USD.
Condition: Clear bearish rejection candlestick with diminishing volume
Note:
XAUUSD remains in a vulnerable state. The current move may be a technical rebound rather than a true reversal. Traders should watch closely how price behaves around the 3,373–3,392 USD zone in the coming sessions. A breakout could signal a new bullish leg, while another rejection would likely confirm a continuation of the bearish trend.
Gold Price Struggles at Key Support ZoneTechnical Analysis – Data as of June 25–26, 2025
In the latest trading sessions, XAUUSD continues to move within a narrow range, reflecting a cautious market sentiment awaiting clearer signals. The daily chart shows price hovering around the 3,341 USD level — aligning with the 0.618 Fibonacci retracement and intersecting key descending trendlines and previous correction zones.
1. Notable Price Action:
Gold has bounced slightly from the 3,294 USD support and retested the 3,360–3,365 USD resistance but failed to break through.
Small-bodied candles with long wicks indicate indecision, suggesting that neither buyers nor sellers have a clear upper hand.
The descending trendline (blue line) is acting as a significant resistance barrier, with each bullish attempt being rejected.
2. Key Support and Resistance Levels:
Immediate Support: 3,294 – 3,296 USD
Nearby Resistance: 3,360 – 3,365 USD
Crucial Breakout Zone: 3,382 – 3,394 USD (Fibonacci 0.618 – 0.786 of the latest downleg)
3. Short-Term Trading Strategy:
If XAUUSD maintains support above 3,294 USD, a short-term technical rebound toward 3,360 – 3,394 USD is possible.
However, a clean break below 3,294 with strong volume could trigger further downside momentum, potentially targeting 3,265 USD or even 3,221 USD.
4. Overall Outlook:
The market is currently in a state of uncertainty, with neither side showing dominance. Traders are advised to wait for a decisive breakout in either direction before entering new positions. Breakout trading strategies with volume confirmation should be prioritized in this phase.

Gold Peaked, Deep Analysis: MACD & RSI, Targets: $3,131 & $2,904Gold (XAUUSD) already peaked. The 22 Apr session was a clear top signal. A very strong one at that. The chart is showing a lower (red arrows) and overall distribution channel. Trading volume continues to drop. Bearish volume is predominant.
Gold produced a strong rally, it lasted 159 days. Total growth amounts to +39% from bottom to top, starting November 2024, end April 2025.
It's been 64 days since the all-time high. No new highs, no bullish momentum. Geopolitical factors that would push Gold to new all-time highs, a war, did show up recently, a surprise event and yet Gold's price failed to move higher. This is a warning signal.
The RSI is weak now. Gold is trading very high, a very strong price but with a risk RSI. This is another warning signal, a strong one. Bullish would be the contrary, low price with a strong RSI. A weak RSI at this point can be interpreted as the bullish force being exhausted.
The daily MACD is pretty bad. Trending fully down with no possibility of anything bullish. Here is the chart.
This is a friendly reminder. Switch to Crypto.
You've been warned.
Namaste.

BTC continues to short at high levels during the day📰 Impact of news:
1. Geopolitical impact
📈 Market analysis:
BTC has reached an intraday high of 108,125, just one step away from the all-time high of 112,000. With the increase in trading volume and institutional sentiment turning bullish, the momentum seems to be in the bulls' favor. In addition to institutional buying, the ceasefire agreement in the Iran-Israel war is also an important factor in Bitcoin's sharp rebound. Trump's announcement of the end of the war almost immediately triggered a surge in the cryptocurrency market. However, the overall pattern has not changed, and the range resistance has not been broken, so we still keep the idea of shorting at high levels.
🏅 Trading strategies:
SELL 108000-107500
TP 104500-103500
If you agree with this view, or have a better idea, please leave a message in the comment area. I look forward to hearing different voices.

Continue to short gold!Gold prices rose modestly on Wednesday, mainly benefiting from the US dollar index hovering at a one-week low and the low US bond yields, which boosted the purchasing power of non-dollar investors. The market is closely watching the situation in the Middle East, and the fragile ceasefire between Israel and Iran is still uncertain. However, as the conflict between the two sides has temporarily eased, the geopolitical risk premium that had previously pushed up gold has gradually dissipated, and safe-haven funds have continued to flow out of the gold market, limiting the room for gold prices to rebound.
Technically, gold closed with a big negative line on the daily line, recording the seventh consecutive week of decline, which significantly undermined the recent bullish pattern. The current market sentiment is clearly bearish. After the sharp drop last night, there may be a technical adjustment today, but the 3347-level high point above has become a key resistance. If it cannot be broken, the short-term pressure situation will remain unchanged. The downward support focuses on the 3300-level area. If it is lost, it may further test the previous low of 3290, or even fall to the important turning point of 3274. Overall, the decline of the US dollar brings short-term respite, but the technical selling pressure and the fading of risk aversion continue to suppress the rebound momentum of gold. It is expected to maintain a weak and volatile trend in the short term.

Short gold after reboundGold rebounded after touching 3312, and has now rebounded to 3330, but the rebound strength is far less than the decline strength, so the overall performance of gold is still weak. Because gold fell sharply yesterday, the market bullish confidence suffered a heavy blow, and there are many resistances above after gold fell and broke, and it is under pressure at 3340-3350 in the short term, and there is a technical gap above that suppresses the 3360-3370 area.
Therefore, before gold stabilizes in the 3360-3370 area, the short-selling force still has the upper hand, so we still focus on shorting gold in trading. We can consider shorting gold with the 3340-3350 area as resistance, and look at the target area of 3320-3310.
The Premium privilege of my account will end on June 26, and it will stop updating here from tomorrow. Friends in the channel have already made a lot of money by following my trading strategies. Friends who have not joined yet can join and receive the latest trading strategies and trading signals in the first time to protect your trading!

Suppression remains unchanged, the latest layout of gold📰 Impact of news:
1. Powell's testimony
2. Geopolitical impact
📈 Market analysis:
The short-term rebound of gold is the release of energy for the accumulated bulls. From the current market trend, 3340 above is the key point of the short-term watershed between bulls and bears. The short-term resistance above is around 3342-3348, and the short-term support below is around 33220-3315. If it falls below this, it will continue to look towards yesterday's low of 3290-3280. The daily level is under pressure and continues to see a decline and adjustment. If it touches 3340-3350 above, you can try to short. After it retreats to 3320-3315 and obtains effective support, you can consider going long.
🏅 Trading strategies:
SELL 3340-3350
TP 3330-3320-3315
BUY 3320-3315
TP 3330-3340-3350
If you agree with this view, or have a better idea, please leave a message in the comment area. I look forward to hearing different voices.
OANDA:XAUUSD FX:XAUUSD FOREXCOM:XAUUSD FXOPEN:XAUUSD TVC:GOLD

Gold is overall dominated by bearish sentiment.On Wednesday, gold prices edged higher, mainly driven by the U.S. Dollar Index hovering near a one-week low and depressed U.S. Treasury yields, which enhanced purchasing power for non-U.S. dollar investors. The market remained focused on the Middle East situation, as the fragile ceasefire between Israel and Iran still held uncertainties. However, with the temporary de-escalation of conflicts between the two sides, the geopolitical risk premium that previously boosted gold gradually dissipated, and safe-haven funds continued to flow out of the gold market, limiting the upside space for gold prices.
Technically, gold's daily chart formed a large bearish candle, notching the seventh consecutive weekly decline, which significantly disrupted the recent bullish structure. Current market sentiment is clearly skewed toward bearishness. After last night's sharp decline, a technical correction may occur today, but the horizontal high at 3,347 has become a key resistance level. Failure to break through this level will maintain short-term selling pressure. On the downside, focus on the 3,300 support zone—if breached, it may trigger further declines toward the previous low of 3,290.
you are currently struggling with losses,or are unsure which of the numerous trading strategies to follow,You have the option to join our VIP program. I will assist you and provide you with accurate trading signals, enabling you to navigate the financial markets with greater confidence and potentially achieve optimal trading results.
Trading Strategy:
sell@3335-3340
TP:3300-3295
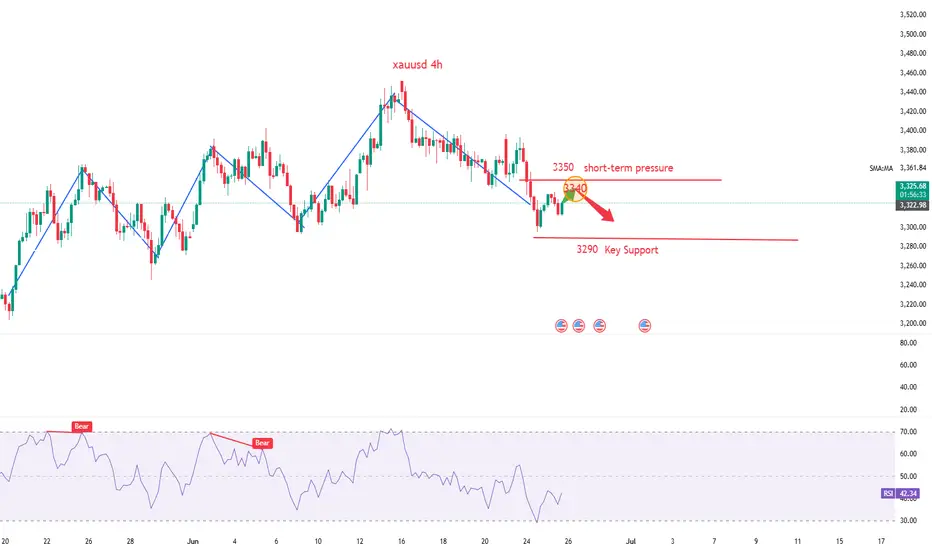
Gold Spot / U.S. Dollar (XAU/USD) 4-Hour Chart Analysis4-hour chart from OANDA shows the recent performance of Gold Spot priced in U.S. Dollars (XAU/USD), with the current price at $3,313.650, reflecting a decrease of $9.800 (-0.29%). The chart highlights a recent upward trend followed by a pullback, with a support zone around $3,301.186 to $3,313.650 and a resistance level near $3,380.030. The inset provides a zoomed-in view of the price action, indicating potential volatility with a lightning bolt symbol and U.S. flags, suggesting significant market movements or news

The downward trend is strong.The easing of the situation in the Middle East weakens the demand for safe havens
The direct trigger for the decline in gold prices was the news that Israel and Iran announced a ceasefire. This news quickly cooled the market's risk aversion, and the attractiveness of gold as a traditional safe-haven asset weakened. In the past few weeks, the military confrontation between Israel and Iran once pushed up the safe-haven buying of gold, but with the conclusion of the ceasefire agreement, the market quickly turned to risk preference mode, global stock markets rose, and the US dollar fell. This change in market sentiment directly led to the decline in gold prices.
This decline will still intensify, pay attention to your trading orders, I will continue to update this article, I wish you a smooth trading.

GOLD Made H&S Reversal Pattern , Chance To Sell To Get 200 PipsHere is My 15 Mins Chart On Gold and we have a very good reversal Pattern , Head & Shoulders , we have a 15 mins closure below neckline 3322.00 we can enter a sell trade and targeting at least 100 pips as scalping , we can enter after waiting the price to retest neckline and then enter . and the price can reach 3300.00 to 3296.00 again .

GOLD/XAUUSD SellGold price is still bearish in the short term. The US dollar is currently being boosted. There are also geopolitical talks and indirect ceasefires. Therefore, the short-term risk aversion sentiment has declined. The gold price is now quoted at: 3323. We can focus on the lower target of 3300-3290.
