Gold Spot / U.S. Dollar (XAUUSD) 2-Hour Chart2-hour chart displays the price movement of Gold Spot (XAUUSD) against the U.S. Dollar, showing a current price of $3,352.73 with a decrease of $16.20 (-0.48%) as of 01:22:11. The chart highlights a recent downward trend following a peak, with a shaded area indicating a potential support or resistance zone around $3,360 to $3,400. Key price levels are marked, including $3,400.00, $3,376.03, and $3,323.59, with candlestick patterns reflecting market volatility.
Xauusdshort

Gold Slips Below Key Support – Is $3,326 Next?OANDA:XAUUSD TVC:GOLD Gold has broken beneath the $3,365–$3,369 support zone, which now aligns with descending trendlines TL1 and TL2 acting as resistance. The 30-minute chart confirms a clean bearish breakout and retest, signalling potential continuation toward lower support near $3,326.
🎯 Short Setup
Entry: $3,365 (retest of broken support / trendline confluence)
Stop: $3,375 (above TL2 and intraday highs)
Target 1: $3,330
Target 2: $3,326
R:R: ~1:3.95
📊 Technical Context
• Price is capped below the $3,365–$3,369 supply zone
• Trendline resistance (TL1, TL2) remains intact from mid-June
• Structure favours continuation lower as long as price stays beneath the retest zone
🌐 Fundamental Backdrop
• Fed held rates steady, but Powell’s tone remained hawkish, warning of “elevated inflation” — supporting USD strength
• Rising Middle East tensions (Israel-Iran conflict) offer safe-haven bids, but not enough to break resistance
• Trump’s tariff threats and criticism of Fed policy add macro uncertainty — mildly supportive of gold in the longer run
📘 Trade Bias
As long as gold holds below $3,365, the bearish thesis remains intact. A sustained push above $3,375 would invalidate the setup and signal a potential reversal or breakout retest.
⚠️ Disclaimer
This analysis is for educational purposes only. Always do your own research and consult a licensed advisor before making financial decisions.

Gold Spot Price Analysis (4-Hour Chart)4-hour candlestick chart for the Gold Spot price in U.S. Dollars (XAUUSD). The chart shows a recent downward trend with a notable dip, followed by an upward correction. A technical analysis pattern is highlighted within a green rectangle, indicating a potential bullish reversal. The current price is $3,374.76, with a decrease of $13.40 (-0.40%). The chart provides insights into short-term price movements and potential trading opportunities.

6/19 Gold Analysis and Trading SignalsGood morning!
Yesterday, the Federal Reserve's interest rate decision aligned with market expectations, bringing no major surprises. The market had already priced in bearish sentiment in advance, which led gold to trade within the Bollinger Bands' upper, middle, and lower bounds, with all three bands trending sideways, indicating limited intraday volatility.
🔍 Technical Overview:
On the 30-minute chart, the Bollinger Bands began to tilt downward near the close, with price currently pressured by the middle band;
However, MACD structure suggests the middle band may be broken, with potential for price to challenge the upper band resistance near 3392–3400;
More importantly, on the 1D chart, the MACD is showing signs of a bearish crossover (death cross). If confirmed, it may break the bullish structure, weakening support from the weekly MA5;
If gold sustains below the weekly MA10 at 3317, it could open the door for a broader correction, with a drop toward 3200 becoming increasingly likely.
📊 Fundamental Factors:
Today’s U.S. market holiday means fewer economic data releases. As such, gold will likely be driven by technical structure and geopolitical headlines, especially those related to the Middle East. If no new developments emerge, selling on rallies remains the preferred strategy.
📌 Trading Plan (VIP-Focused):
✅ Sell Zone: 3392–3409
✅ Buy Zone: 3338–3321
✅ Scalp/Flexible Zones: 3387 / 3373 / 3364 / 3356 / 3345

Current Gold Trend Analysis and Trading RecommendationsOn Wednesday, the morning strategy suggested going long on gold at 3,375-3,365, perfectly seizing the pullback low and rebounding to the 3,400 level as expected. Today, there is also the Fed interest rate decision. Before the data release, short positions can be taken if the 3,400-3,405 level remains unbroken. If the 3,405-3,410 level is broken, we will continue to be bullish. Gold is in short-term oscillation, so try not to chase the market. Wait for a good entry opportunity. The upper level has also been repeatedly contested recently, and the Fed data is likely to break the range after its release.
For gold, continue to adopt an oscillating approach. In the 4H cycle, it is operating below the middle band. The short-term range is 3,405-3,365. If it breaks above 3,405, it can continue to target 3,420 and 3,450. Conversely, if it breaks below 3,365, it can fall to 3,350. In operation, prioritize long positions with short positions as a supplement, and adjust the strategy when a breakout occurs.
XAUUSD
buy@3370-3375
tp:3390-3400-3420
sell@3395-3400
tp:3380-3370
Investment itself is not the source of risk; it is only when investment behavior escapes rational control that risks lie in wait. In the trading process, always bear in mind that restraining impulsiveness is the primary criterion for success. I share trading signals daily, and all signals have been accurate without error for a full month. Regardless of your past profits or losses, with my assistance, you have the hope to achieve a breakthrough in your investment.

Expect gold to break 3400 for 3430 post-FedIn recent years, after the U.S. economy was hit by a round of high inflation, inflation data has gradually shown signs of easing 📉. Logically, the weakening inflation pressure should have paved the way for the Federal Reserve (Fed) to cut interest rates, but surprisingly, the Fed has chosen to remain on the sidelines and maintain its high-interest-rate policy ⚖️. The Fed's decision to keep rates high has had a significant impact on gold prices and the U.S. dollar 💱. First, high interest rates typically push up the U.S. dollar exchange rate, thereby dampening gold demand 💰↓.
Gold's price movement this week deviated from market news or expectations 📉≠📢. Driven by geopolitical conflicts, gold rallied on Friday 📈, and the momentum continued to simmer over the weekend, leading to a gap-up opening on Monday followed by a steady decline 📉. On the hourly timeframe, the low points are gradually shifting downward, with 3,400 becoming a short-term resistance level 📊. Although gold fell from 3,452, it is clearly oscillating around 3,380 🔄
I think the Fed's interest rate decision this time may cause gold to directly break through 3400 and reach around 3430 🌟📈
⚡️⚡️⚡️ XAUUSD ⚡️⚡️⚡️
🚀 Buy@ 3380 - 3385
🚀 TP 3400 - 3430
Accurate signals are updated every day 📈 If you encounter any problems during trading, these signals can serve as your reliable guide 🧭 Feel free to refer to them! I sincerely hope they'll be of great help to you 🌟 👇

Gold Spot / U.S. Dollar (XAU/USD) 4-Hour Chart4-hour candlestick chart displays the price movement of Gold Spot (XAU) against the U.S. Dollar (USD) from June 4 to June 18, 2025. The current price is 3,391.79, reflecting a +3.61 (+0.11%) change. The chart highlights a recent upward trend with a notable peak, followed by a slight pullback. Key price levels are marked, ranging from 3,320.00 to 3,420.14, with technical analysis indicators such as a resistance zone (pink) and a support zone (light green) overlaid.

Buy Signal at 3363 Support, Sell Signal at 3400 ResistanceToday's key resistance level for gold remains at 3400.00 🚦, with the support area around 3363.00 🛡️. The current price of gold is 3388, placing it in the middle of the range between the support and resistance levels ⚖️.
We can wait for opportunities to go long when the price drops to around the support area of 3363.00 - 3370.00 📉, accompanied by bullish candlestick patterns (such as a hammer with a long lower shadow 🔦, a bullish engulfing pattern 🐂) or positive fundamental news (such as dovish remarks from the Federal Reserve 🕊️, escalation of geopolitical conflicts in the Middle East 🔥).
Conversely, we can consider going short when the price reaches the resistance zone of 3400.00 - 3405.00 📈, along with negative fundamental news (such as strong U.S. economic data 📊, easing of geopolitical risks 🧘).
Gold Trading Strategies
sell@ 3400-3405
tp:3375-3365
buy@3365-3370
tp:3390-3400
Professional trading strategies are pushed daily 📊
Lock in precise signals amid market fluctuations 🚀
Confused about market trends? Stuck in strategy bottlenecks?
Real-time strategies serve as your "trading compass" 🌐
From trend analysis to entry/exit points, dissect market logic comprehensively
Refer now 📲
Help you move steadily forward in investments ✨
👇👇👇

Current Gold Trend Analysis and Trading RecommendationsOn Tuesday, gold dipped to around $3,374 in the early trading session, then rebounded to the intraday high. In the U.S. trading session, it is currently quoted at about $3,388, approaching the psychological level of $3,400. From the 4-hour chart of gold, the current upward momentum remains intact. The support below is focused on around $3,350, and the strong support is highlighted in the $3,350-$3,330 area, which is also the position of the 5-week moving average. Only by breaking the $3,350 area is there hope to reverse the trend and fall completely. If it does not break here, the bulls may still repeat.
Regarding the current trend, gold tends to continue to test the bottom and then rebound, maintaining a large range of sweeping. In terms of operation, it is recommended to go long when gold rebounds to the vicinity of 3370-3360, with the target looking at the 3490-3400 range. The short strategy is to go short near 3400, with the target looking at the 3370-3350 line.
XAUUSD
buy@3370-3360
tp:3390-3400
sell@3395-3400
tp:3370-3350
Investment itself is not the source of risk; it is only when investment behavior escapes rational control that risks lie in wait. In the trading process, always bear in mind that restraining impulsiveness is the primary criterion for success. I share trading signals daily, and all signals have been accurate without error for a full month. Regardless of your past profits or losses, with my assistance, you have the hope to achieve a breakthrough in your investment.

The interest rate remains volatile,and the gold operation layout📰 Impact of news:
1. Initial jobless claims data
2. US-Iran conflict continues
3. Pay attention to the Fed's decision
📈 Market analysis:
Gold has been trading sideways recently. It is expected that there will not be much fluctuation before today's Fed interest rate information and Powell's speech. It is expected to continue to fluctuate in the range of 3405-3365. At the same time, the escalation of geopolitical conflicts in the short term is also a point we need to pay attention to.
🏅 Trading strategies:
BUY 3380-3375-3365-3355
TP 3395-3400-3405
SELL 3405-3395
TP 3380-3375-3360
If you agree with this view, or have a better idea, please leave a message in the comment area. I look forward to hearing different voices.
TVC:GOLD FXOPEN:XAUUSD FOREXCOM:XAUUSD FX:XAUUSD OANDA:XAUUSD

Wide range fluctuations continue, the latest layout of gold📰 Impact of news:
1. Initial jobless claims data
2. US-Iran conflict continues
3. Pay attention to the Fed's decision
📈 Market analysis:
At present, the gold price is testing the 3380 line again, and the strong support below is 3365-3355. As long as it does not fall below this key support, the bulls will remain strong. At the same time, the two key points of 3405 and 3420 above are still short-term resistance. Breaking through may directly test 3450. In the short term, gold fluctuates repeatedly at the 3405-3365 level, temporarily maintaining a high-altitude low-multiple cycle. There is also initial jobless claims data released today. At the same time, the geopolitical situation in the short term is severe, so we need to be cautious. In addition, the New York Stock Exchange will be closed tomorrow. The focus this week is mainly on Friday, especially when it is superimposed with the Fed's interest rate decision, we need to be vigilant about the transmission effect of sudden changes in liquidity on the market.
🏅 Trading strategies:
BUY 3380-3365-3355
TP 33395-3400-3405
SELL 3405-3390
TP 3380-3360
If you agree with this view, or have a better idea, please leave a message in the comment area. I look forward to hearing different voices.
OANDA:XAUUSD FX:XAUUSD FOREXCOM:XAUUSD FXOPEN:XAUUSD TVC:GOLD

Stick to shorting goldGold is currently fluctuating in a narrow range of 3380-3385, and the trend is relatively slow. We also need more patience. In comparison, I think the current short-selling force has a slight upper hand, because gold has shown signs of accelerating decline after a difficult rebound many times, and has fallen below 3380 many times. According to the current gold structure, gold does not have sufficient room for decline, and it is still possible to continue to fall to the 3365-3355 area.
It is expected that gold will not fluctuate too much before the Fed's interest rate decision and Powell's monetary policy press conference. For this interest rate decision, I think the possibility of a rate cut is not great, and the current interest rate may still remain unchanged. The reduction in the expectation of a rate cut may stimulate a wave of gold declines in the short term. So in the short term, I still prefer a short trade in gold. Obviously, gold is currently under pressure in the 3395-3405 area, so we can still try to short gold in this area.

Gold Spot / U.S. Dollar (XAUUSD) 4-Hour Chart4-hour price movement of Gold Spot (XAUUSD) against the U.S. Dollar, covering the period from late June to early July 2025. The current price is $3,381.09, reflecting a slight decrease of $7.09 (-0.21%) over the period. The chart includes candlestick patterns, with a highlighted consolidation zone and a recent downward trend. Key price levels such as $3,401.46, $3,389.38, and $3,340.00 are marked, indicating potential support and resistance zones.

Strong support at 3365/3350In recent years, following the easing of high inflation pressures in the U.S., the Federal Reserve has maintained a high-interest-rate policy, a decision that has significantly impacted gold and U.S. dollar markets: high rates have boosted the U.S. dollar while suppressing gold demand 📉.
This week, gold prices defied market expectations: fueled by geopolitical conflicts, gold surged last Friday and opened higher on Monday, only to trend lower thereafter ⬇️. The hourly chart shows a series of lower lows, with 3,400 emerging as short-term resistance, while gold currently oscillates around 3,380 🔄. With key economic data pending release, gold may still rebound (the initial jobless claims data was advanced to Wednesday) ⏰.
Technically, gold remains in a unilateral uptrend on the daily chart, with strong support at 3,365/3,350 from the 5-day and 10-day moving averages—though not yet in an extremely strong trend 📈. Key resistances lie at 3,430/3,450: a break above 3,450 could pave the way for a challenge to the previous high of 3,500 🏔️!
⚡️⚡️⚡️ XAUUSD ⚡️⚡️⚡️
🚀 Buy@ 3365 - 3375
🚀 TP 3395 - 3405
Accurate signals are updated every day 📈 If you encounter any problems during trading, these signals can serve as your reliable guide 🧭 Feel free to refer to them! I sincerely hope they'll be of great help to you 🌟 👇

Middle East Tensions Intertwined with Fed Rate Cut SpeculationThe Middle East situation remains tense ⚠️, and with rumors of a Fed rate cut emerging 👂, gold is likely to see significant volatility in the near term 📈📉. Due to the war, we still favor going long at lower levels 💹. During the current U.S. trading session, another pullback may occur—we need to wait for the correction before continuing to go long ⏳
⚡️⚡️⚡️ XAUUSD ⚡️⚡️⚡️
🚀 Buy@ 3365 - 3375
🚀 TP 3400 - 3410
Accurate signals are updated every day 📈 If you encounter any problems during trading, these signals can serve as your reliable guide 🧭 Feel free to refer to them! I sincerely hope they'll be of great help to you 🌟 👇

Gold price analysis June 18Yesterday's D1 candle was a Doji candle. It shows the hesitation of buyers and sellers at the price near ATH.
The h4 structure is a sustainable bullish wave structure and is heading towards higher hooks.
The 3400 zone is the immediate resistance zone that Gold is heading towards. This zone will be the breakout zone for the confirmation of the candle closing above 3400.
The profit-taking reaction zone of sellers at 3415 acts as a price reaction when the price uptrend returns and creates momentum towards 3443.
On the other hand, the breakout point of 3472, if broken, will push the price to the support zone of 3343

XAU/USD Bullish Reversal Toward 3,449XAU/USD Technical Analysis (30-Minute Chart)
This chart shows a bullish breakout setup for Gold (XAU/USD) based on recent price action and technical indicators:
---
🔻 Support Zone & Trend Line:
A descending support trend line has been drawn from earlier lows, showing a falling wedge structure.
The key support zone between 3,367.825 and 3,388.370 has held firmly, confirming demand in this range.
📈 Bullish Reversal Formation:
Price bounced off the support zone, suggesting a potential reversal.
A breakout above the horizontal resistance near 3,388.370 is projected, with bullish momentum forming.
🎯 Target Levels:
Immediate resistance: Around 3,388.370, which price is currently testing.
Primary target: The yellow resistance zone near 3,449.485—if broken, it may confirm a strong upward trend.
📊 Volume Profile:
Volume bars on the right show higher trading activity above 3,400, indicating potential resistance in that region.
📝 Summary: Gold is showing signs of a bullish reversal from the support trend line and key demand zone. A sustained move above 3,388.370 may lead to a rally toward the 3,449.485 resistance area.

Short Opportunity on XAU/USD: Fed & Conflict Drive Next MoveTVC:GOLD OANDA:XAUUSD XAU/USD is showing multiple rejections at the key resistance confluence of the trendline (TL1) and the $3,396–$3,405 zone. Price remains capped below this level while supported by TL2, with downside potential toward $3,354 and $3,326 if bearish pressure persists. A short setup is in play: entry at $3,396, stop at $3,411, and targets at $3,354 and $3,326, offering a favorable 1:2.97 risk–reward. Invalidation occurs on a 4H close above $3,411, which could open the path to $3,450+. Geopolitical risk remains elevated as the Israel–Iran conflict enters day six, with airstrikes near Tehran and speculation of U.S. involvement following President Trump’s emergency security meeting. Meanwhile, the upcoming Fed decision is key; while no rate move is expected, markets are focused on the updated dot plot and Powell’s tone amid ongoing tariff uncertainty. Long-term support for gold is reinforced by a World Gold Council survey showing 95% of central banks expect global reserves to rise, with a record 43% planning to increase holdings. Short-term bias remains cautiously bearish while below resistance, but any dovish Fed surprise or escalation in conflict may reverse momentum.
Resistance : $3,396 , $3,405
Support : $3,354 , $3,325, $3,320

XAUUSD DAYTRADE SIGNAL!!!Hello Everyone i want share my trade for today at Gold/USD pair.
price moving slow downside, with liquidity, for today i will use Fibonacci.
Open Short position at 3390
Stop Loss 3396
Take profit 3366
The reason for this trade is catch liquidity and dollar is still bullish and that's the reason why i think gold will go down again.
Always make your research!!!!

XAUUSD!UP!As I expected, the market remains volatile. It needs an opportunity to continue to rise.
I will update this kind of information in the swing trading center. If you don't want to miss such precise trading opportunities, remember to stay tuned.

Key Event Today – FOMC Interest Rate DecisionAs risk-off sentiment cools, gold bulls failed to take control yesterday, resulting in a stalemate with the bears.
From the 4H chart perspective, bearish momentum currently appears stronger,
though bulls are not giving up easily.
Currently, price is rebounding off the 4H MA60 support,
with immediate resistance from the MA20 around 3405.
As time progresses, this resistance is likely to shift lower,
so for now, we’ll treat $3400 as the primary reference point.
For bulls to regain dominance,
they must hold steady above 3405,
and more importantly, protect the support at 3386–3378 during any pullback.
🔔 Key Event Today – FOMC Interest Rate Decision
Today’s trading will also be influenced by the Federal Reserve’s rate decision,
which, based on current expectations, is likely to weigh heavily on bullish sentiment.
📌 Strategy for Today:
Main Bias: Sell the rebound
Secondary Approach: Buy on pullbacks if strong support levels hold
Key support levels to monitor:
⚠️ 3382 zone (minor support)
🔻 Most critical: 4H MA60 around 3366
Stay cautious during the FOMC announcement window, and remember — in volatile markets, reacting with discipline is more important than predicting perfectly.
6/17 Gold Analysis and Trading SignalsGood morning!
Yesterday, gold opened with a gap-up and surged to around 3451, but failed to sustain above key resistance. After another failed attempt to break higher, prices gradually turned lower and finally broke below 3400, finding short-term support near 3382.
The primary driver of this decline was a waning of geopolitical risk sentiment, which had previously fueled the rally. Additionally, the market is now pricing in expectations that the Fed will keep rates unchanged, a factor that was likely preemptively reflected in price.
🔍 Fundamental Focus:
Today’s U.S. session will feature a key news release, which may prove decisive for gold’s next directional move. With yesterday’s advance pullback, market dynamics are likely to be more volatile today. We recommend caution, especially ahead of the announcement.
📉 Technical View:
Gold is currently in a post-decline consolidation phase.
The main resistance lies between 3430–3450, while 3415 on the 30-minute chart also presents a short-term cap.
For those entering long positions, target zones should remain conservative, ideally around 3412–3418, and then be adjusted depending on volume momentum and breakout structure.
📊 Weekly Structure Outlook:
The weekly chart shows that gold is at a key trend inflection point.
If no additional bullish catalysts emerge, the market is likely to develop into a bearish consolidation, with the next major downside target around 3200.
📌 Trading Plan (For VIP):
✅ Sell Zone: 3436–3466
✅ Buy Zone: 3347–3323
✅ Flexible Trade Zones: 3428 / 3415 / 3403 / 3392 / 3378 / 3362 / 3354

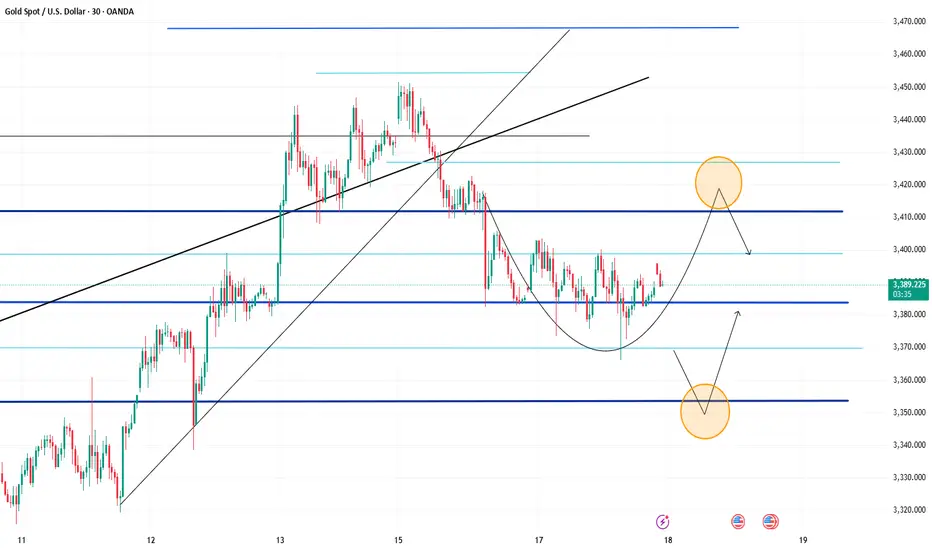
6/18 Gold Analysis and Trading SignalsGood morning, everyone!
Gold traded within a narrow range yesterday, and the buy signal shared during the session yielded profits. From a technical perspective, the market remains in a rebound phase, with key resistance around 3403. If the price breaks and holds above this level, there’s a good chance we’ll see a move toward the 3418–3428 zone today.
During the Asian and European sessions, the trading bias should remain on the buy side, while in the U.S. session, it may be more favorable to shift toward short setups, mainly due to expectations surrounding the upcoming Fed interest rate decision—an outlook we discussed yesterday.
Key intraday ranges to watch:
Asian–European session: 3362–3413
If price reaches the 3425–3435 zone before the U.S. session, short opportunities may emerge
As always, manage your positions carefully and adapt to key levels as price unfolds.
