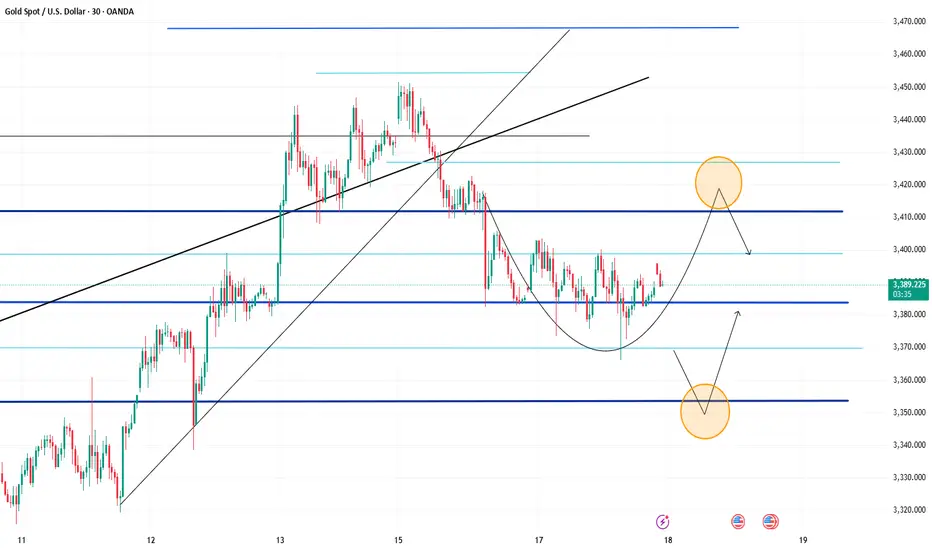
XAUUSD!UP!As I expected, the market remains volatile. It needs an opportunity to continue to rise.
I will update this kind of information in the swing trading center. If you don't want to miss such precise trading opportunities, remember to stay tuned.
Xauusdshort

Key Event Today – FOMC Interest Rate DecisionAs risk-off sentiment cools, gold bulls failed to take control yesterday, resulting in a stalemate with the bears.
From the 4H chart perspective, bearish momentum currently appears stronger,
though bulls are not giving up easily.
Currently, price is rebounding off the 4H MA60 support,
with immediate resistance from the MA20 around 3405.
As time progresses, this resistance is likely to shift lower,
so for now, we’ll treat $3400 as the primary reference point.
For bulls to regain dominance,
they must hold steady above 3405,
and more importantly, protect the support at 3386–3378 during any pullback.
🔔 Key Event Today – FOMC Interest Rate Decision
Today’s trading will also be influenced by the Federal Reserve’s rate decision,
which, based on current expectations, is likely to weigh heavily on bullish sentiment.
📌 Strategy for Today:
Main Bias: Sell the rebound
Secondary Approach: Buy on pullbacks if strong support levels hold
Key support levels to monitor:
⚠️ 3382 zone (minor support)
🔻 Most critical: 4H MA60 around 3366
Stay cautious during the FOMC announcement window, and remember — in volatile markets, reacting with discipline is more important than predicting perfectly.
6/17 Gold Analysis and Trading SignalsGood morning!
Yesterday, gold opened with a gap-up and surged to around 3451, but failed to sustain above key resistance. After another failed attempt to break higher, prices gradually turned lower and finally broke below 3400, finding short-term support near 3382.
The primary driver of this decline was a waning of geopolitical risk sentiment, which had previously fueled the rally. Additionally, the market is now pricing in expectations that the Fed will keep rates unchanged, a factor that was likely preemptively reflected in price.
🔍 Fundamental Focus:
Today’s U.S. session will feature a key news release, which may prove decisive for gold’s next directional move. With yesterday’s advance pullback, market dynamics are likely to be more volatile today. We recommend caution, especially ahead of the announcement.
📉 Technical View:
Gold is currently in a post-decline consolidation phase.
The main resistance lies between 3430–3450, while 3415 on the 30-minute chart also presents a short-term cap.
For those entering long positions, target zones should remain conservative, ideally around 3412–3418, and then be adjusted depending on volume momentum and breakout structure.
📊 Weekly Structure Outlook:
The weekly chart shows that gold is at a key trend inflection point.
If no additional bullish catalysts emerge, the market is likely to develop into a bearish consolidation, with the next major downside target around 3200.
📌 Trading Plan (For VIP):
✅ Sell Zone: 3436–3466
✅ Buy Zone: 3347–3323
✅ Flexible Trade Zones: 3428 / 3415 / 3403 / 3392 / 3378 / 3362 / 3354

6/18 Gold Analysis and Trading SignalsGood morning, everyone!
Gold traded within a narrow range yesterday, and the buy signal shared during the session yielded profits. From a technical perspective, the market remains in a rebound phase, with key resistance around 3403. If the price breaks and holds above this level, there’s a good chance we’ll see a move toward the 3418–3428 zone today.
During the Asian and European sessions, the trading bias should remain on the buy side, while in the U.S. session, it may be more favorable to shift toward short setups, mainly due to expectations surrounding the upcoming Fed interest rate decision—an outlook we discussed yesterday.
Key intraday ranges to watch:
Asian–European session: 3362–3413
If price reaches the 3425–3435 zone before the U.S. session, short opportunities may emerge
As always, manage your positions carefully and adapt to key levels as price unfolds.

Gold is weak, and there may be a low point yet to come!According to the current structure, gold is obviously in a weak position. Gold has failed to break through the high point of the previous wave after multiple rebounds during the day. 3400 has become a new round of pressure area; and gold has just accelerated its decline and fell below 3370. For the current trend, falling below 3370 will weaken the bullish sentiment to a certain extent and indicate that there is further room for decline, so I think gold should have a low point, and the low point we should first pay attention to is in the range of 3365-3355.
So in terms of short-term trading,
First, we can try to short gold with the short-term resistance area of 3395-3405;
But if gold first retreats to the support area of 3365-3355, we can first choose to go long on gold.

XAUUSD Long Setup – Retest of Broken Structure & Safe-Haven FlowGold has pulled back to retest a strong former resistance (now support) zone around $3,385–$3,390. This level aligns with a previous breakout and marks the neckline of an inverted head-and-shoulders pattern. The pair is now showing bullish structure with back-to-back continuation patterns (bull flags), suggesting further upside potential.
Given escalating geopolitical risk (Iran-Israel strikes, Trump-led evacuation urgency), slowing Fed cut expectations, and softening inflation-adjusted yields, gold remains in demand.
🔍 Technical Analysis:
Structure: Higher highs and higher lows maintained.
Support Zone: $3,385–$3,390 (retest zone) – bulls stepping back in.
Targets:
TP1: $3,451
TP2: $3,470
TP3: $3,495 (new local high)
Stop Loss: Below $3,369 (recent low)
Pattern Context: Bull flags continue to form and break bullish – reinforcing trend.
🧠 Fundamental Context (June 17):
Bullish Drivers:
Middle East escalation → safe haven bid surging (Iran missile launches, Israeli retaliation, US political chaos).
Fed on pause → real yields are subdued, favoring non-yielding assets like gold.
Convexity & bond volatility rising → investors hedging with hard assets (confirmed via CME sentiment reports).
Risks:
Sudden peace deal or ceasefire.
Unexpected US CPI spike → reawakens rate hike fears.
📅 Key Events to Watch:
Fed speeches (confirmation of dovish tone)
Any ceasefire or major diplomatic development
Oil movement (energy risk spillovers)

Gold (XAUUSD) – Demand Zone Holding, Silver Leading BreakoutGold has respected its demand zone near $3,367–$3,382 and is attempting to bounce higher. Importantly, Silver (XAGUSD in pink overlay) is leading the upside move, having broken out cleanly above $37.00 and still climbing. This confirms the bullish momentum across precious metals.
Geopolitical tensions, dovish Fed commentary, and risk-off market conditions continue to favor a move toward $3,451, $3,471, and possibly $3,495.
🔍 Technical Breakdown (4H)
Support Zone: $3,367–$3,382 (retest of broken resistance)
Bullish Structure: Rising lows, trendline holds, and higher timeframe support remains intact
Projected Targets:
🎯 TP1: $3,451 (recent high)
🎯 TP2: $3,471 (key extension)
🎯 TP3: $3,495 (top of range)
Stop Loss: Below $3,351 (invalidates demand structure)
🪙 Silver (XAGUSD) Overlay Insight:
Currently at $37.11+, showing leadership in the breakout.
Suggests gold will likely follow through — watch for Gold catching up.
🧠 Macro & Fundamental Context (June 17)
Bullish Drivers:
🔥 Ongoing Middle East war escalation (Iran-Israel, US troop buildup)
🏦 Dovish Fed tone, soft retail sales, rate cuts expected from Sept
🧾 Silver strength confirming demand across metals
Risks:
☮️ Unexpected ceasefire headlines could cause knee-jerk pullbacks
📈 Hot inflation data or hawkish Fed rhetoric could pressure upside
📅 Key Events to Watch:
FOMC members' speeches this week
US Core PCE inflation print
War headline velocity — particularly involving shipping or direct US-Iran confrontation
🧭 Strategy Suggestion:
Tactical Buy on Rejection Wick from current demand zone
Watch Silver momentum — if it breaks $37.50+, gold likely catches up fast
Consider scaling out around $3,451–$3,471 with final target near $3,495

Current Gold Trend Analysis and Trading RecommendationsGold showed a pullback after hitting a high yesterday, with a daily decline of nearly 70 USD. The daily candlestick pattern completely engulfed the previous day's gains and closed bearish. Combined with the current signals of geopolitical tensions, today's market is expected to be dominated by broad-range consolidation. From the 4-hour cycle perspective, the price broke below the middle Bollinger Band with consecutive bearish candles last night and continued to decline after being suppressed in the early morning, with technicals pointing to a consolidative and bearish pattern.
The key pivot level today is at 3,405: if the market effectively stabilizes above this level, the upper resistance will test 3,420 and 3,430 in sequence; conversely, if the suppression at 3,405 holds, the price is likely to repeatedly test the support at 3,380 and further dip to the 3,370-3,360 zone. It is recommended to wait for the decline momentum to clarify before initiating long positions, maintaining an overall range-trading strategy.
XAUUSD
buy@3375-3380
tp:3390-3400-3420
Investment itself is not the source of risk; it is only when investment behavior escapes rational control that risks lie in wait. In the trading process, always bear in mind that restraining impulsiveness is the primary criterion for success. I share trading signals daily, and all signals have been accurate without error for a full month. Regardless of your past profits or losses, with my assistance, you have the hope to achieve a breakthrough in your investment.

3365-3400: The Battle Zone for Bulls and BearsCurrently, gold trades at 3386 📊. Key levels: resistance 3400, support 3365 🛑. Watch real-time news (Fed speeches 🎙️, Middle East geopolitics 🌍), which can shift bull-bear balance 🐂🐻.
Long setup: If price drops to 3365-3370 with bullish news (Fed dovish 🕊️, geopolitical tension 🔥) and bullish K-lines (long lower shadows 🕯️), go long 💰. Stop below 3360 🛑. Target 3390-3400 🎯. Take partial profits if news cools 📦.
Short setup: If price rebounds to 3400-3405 with bearish news (strong US data 📈, geopolitical ease 🧘) and bearish K-lines (long upper shadows 🕯️), go short 💰. Stop above 3410 🛑. Initial target 3380-3375 🎯. Extend to support if bearish news persists 🔍.
Gold Trading Strategies
sell@ 3400-3405
tp:3380-3370
buy@3365-3370
tp:3390-3400
Professional trading strategies are pushed daily 📊
Lock in precise signals amid market fluctuations 🚀
Confused about market trends? Stuck in strategy bottlenecks?
Real-time strategies serve as your "trading compass" 🌐
From trend analysis to entry/exit points, dissect market logic comprehensively
Refer now 📲
Help you move steadily forward in investments ✨
👇👇👇

Gold is in a medium-term consolidation,The momentum of gold is weak. In the early trading, there was only a wave of upward momentum, while in the evening, it quickly fell below the 3,400 key level. As previously mentioned, if gold holds above the key level of 3,400, the bullish trend will continue. However, after breaking below 3,400, a small - level top has been formed in the short term, and the market is no longer so strong.
For our short - term operations, in the short - term correction, the gold price should focus on the support of the MA5 in the daily cycle and the MA5 in the weekly cycle for long positions. On the pullback, pay attention to the resistance level of 3,403 - 3,408 for short positions. A rebound can be followed by shorting, but it should be noted that it can only be a short - term operation!
Although gold has broken below 3,400 and the short - term direction has changed, the long - term direction has not changed. It is still in a bullish trend, and we still have the opportunity to see the high of 3,500 in the future. However, we need to wait until the bottom stabilizes. At present, we can only follow the trend and do what the market does. Short on the rebound in the next two days!
you are currently struggling with losses,or are unsure which of the numerous trading strategies to follow,You have the option to join our VIP program. I will assist you and provide you with accurate trading signals, enabling you to navigate the financial markets with greater confidence and potentially achieve optimal trading results.
Trading Strategy:
sell@3410-3420
TP:3380-3390

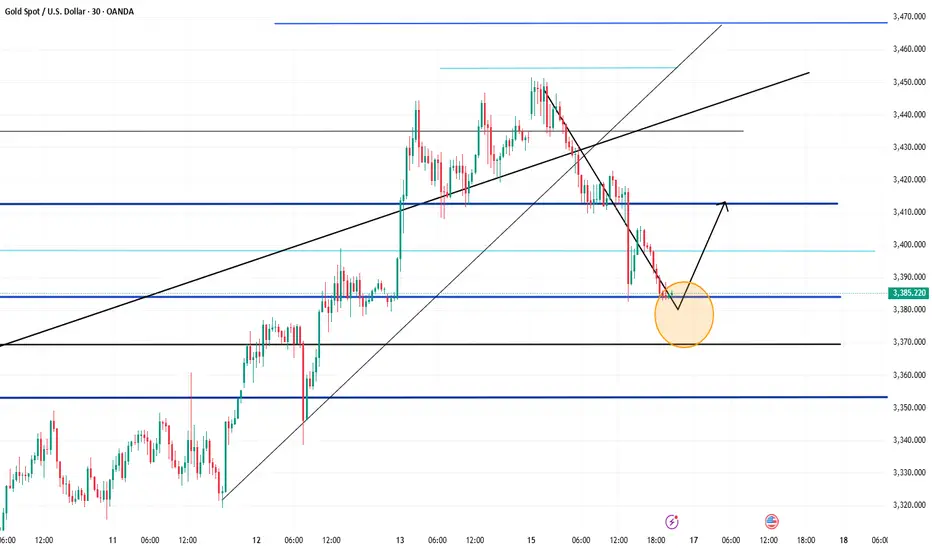
Continue to try to short gold,It's expected to touch 3355-3345 Gold has broken through 3380 twice, but recovered quickly, indicating that the bulls still have some defensive power. At present, gold has touched 3400 again; it can be seen that the bulls' potential defense is still good, but it is not enough to support the continued rebound of gold in the short term. Obviously, gold is still under pressure in the 3410-3420 area in the short term. If gold cannot break through this resistance area in the short term, gold may continue to maintain a volatile state and continue to seek strong support downward. Only after gold breaks through the 3410-3420 area, it is expected to continue to rise and touch the area near 3450 again.
When gold tested the support near 3380 several times during the day and tried to break through this area, after gold failed to break through the 3410-3420 area in the short term, I think gold will be more likely to choose a downward direction, or even continue to test the 3355-3345 area. Therefore, for short-term trading, before breaking through the 3410-3420 area, we should not chase gold too much, and we can try to short gold in this area appropriately.

gold on buy#XAUUSD price holds on 3398 for buy continuation.
Above 3398 will take bullish which will breakout 3406, entry 3398, SL 3384, TP 3406-3425.
If price breakout 3406 and H1 closes above there then bullish will continue till 3425, but reverse and closure below 3402 down will drop the price more.

Forward-looking trading, focus on 3380 support📰 Impact of news:
1. Geopolitical tensions in the Middle East
2. Iran nuclear talks
3. Retail sales data
📈 Market analysis:
Gold prices are currently in a narrow range of fluctuations again, and the signal of Iran restarting nuclear negotiations has weakened risk aversion, triggering a correction in gold prices during the session, but tensions in the Middle East remain an uncertain factor. In the short term, we still need to focus on the breakthrough of the 3380 support line. If the 3380 support line is strong, we can still maintain a long trading idea in the short term and look to 3400. On the contrary, once it falls below, it is expected to look to the 3350 line. Pay attention to the breakthrough of 3400 on the upside. If the Asian and European sessions cannot effectively break through this short-term resistance, gold will continue to fluctuate.
🏅 Trading strategies:
BUY 3380-3370
TP 3390-3400-3450
SELL 3400-3390
TP 3380-3370-3350
If you agree with this view, or have a better idea, please leave a message in the comment area. I look forward to hearing different voices.
OANDA:XAUUSD FX:XAUUSD FOREXCOM:XAUUSD FXOPEN:XAUUSD TVC:GOLD

Gold on the Rise! – Bullish Setup in Focus The chart shows a repeating consolidation‑then‑breakout pattern, with Gold forming ascending swing structures, consolidating in rectangles (green), then riding higher along a rising trendline (purple). Price has just bounced off that trendline again, signaling a possible new leg up—potentially targeting the upper range near $3,448–3,450. A clear breakout above that level could open the door toward $3,500+.
📍 Trading Plan
🎯 Entry
Long on breakout above recent consolidation highs (~$3,440–3,448).
Alternatively, buy the dip near the purple trendline (~$3,385–3,390), with confirmation (hammer candle, bounce).
🛑 Stop‑Loss
For breakout: just below the top of the rectangle consolidation (~$3,389).
For trendline entry: slightly below recent swing low (~$3,358–3,360).
🎯 Profit Targets
Primary: upper rectangle level (~$3,448–3,450).
Extension: historic all‑time high region (~$3,500) → next major zone.
🎥 Path
Potential minor pullback toward trendline.
Bounce establishes support.
Surge toward top of range.
Breakout with trend continuation to new highs.
📊 Trade Risk & Reward
Target ~60–100 pts above entry, stop ~50 pts below → ideal Risk:Reward ≥ 1:1.2.
📌 Key Levels to Monitor
Level Role
$3,360 Swift dip support (green base line)
$3,390–3,400 Trendline confluence zone
$3,440–3,450 Breakout area & top of rectangle
$3,500 Next major resistance/all‑time high
🧭 Market Context & Drivers
Broad uptrend remains intact amid geopolitical tensions, especially the Israel–Iran situation, which continues to support safe-haven flows
Markets are positioning ahead of Fed’s June 18 decision; dovish signals could fuel continuation toward new highs (~$3,500+)
.
Technical structure reflects bullish momentum—ascending wedge patterns with shallow dips and strong trendline bounces
.
✅ Summary
Bias: Bullish – uptrend intact.
Strategy: Go long on dip near trendline or on breakout above $3,445.
Stop‑Loss: Just below last swing low ($3,360).
Targets:
Near-term: $3,448–3,450
Medium-term: $3,500+

XAUUSD Analysis todayHello traders, this is a complete multiple timeframe analysis of this pair. We see could find significant trading opportunities as per analysis upon price action confirmation we may take this trade. Smash the like button if you find value in this analysis and drop a comment if you have any questions or let me know which pair to cover in my next analysis.

Short gold, it needs to retreat to the area around 3350!Gold is currently testing the support near 3380 again. According to the current trend of gold, gold is likely to break through 3380, and gold has stopped near 3400 many times during the rebound process, and the rebound strength of gold is lacking. If gold really wants to rebound, then after testing near 3380 many times and getting support at 3390, it should have rebounded to the 3410-3420 area, but it is obvious that gold has not yet touched the 3410-3420 area. Therefore, gold's performance is relatively weak and its correction trend should continue for now.
In terms of fundamentals, Iran is not decisive in its retaliatory behavior, so if the conflict in the Middle East does not escalate, gold may find it difficult to continue to rise. So according to the current trend and performance of gold, we should not be stubborn in long gold trading for the time being, and adjust our trading plan reasonably according to the market and price behavior. If gold continues to retreat, the first thing we need to pay attention to below is the 3355-3345 area, followed by the area near 3330. So for the next short-term trading, we can try to short gold in the 3395-3405 area.

XAUUSD: The beginning of range trading.Last week, I perfectly predicted the sharp rise in the market. At the beginning of this week, XAUUSD reached a high of 3451, which is the front pressure position. Due to the cooling of risk aversion in the international market, the New York market fell back to 3373 on Monday.
XAUUSD did experience a typical "news-driven callback", and the analysis of technical and fundamental aspects is very critical. The following is a professional analysis and operation suggestions for the current market:
Key points and technical structure
1. Pressure level: 3450 area
- The previous high pressure is effective. This is the resonance resistance area of the upper track of the daily level channel + Fibonacci 61.8% retracement level, and the demand for long profit-taking is concentrated.
2. Support level: 3370-3380 area
- Currently falling back to 3373, here is:
- 50-day moving average dynamic support
- 4-hour chart previous low level support platform
- Fibonacci 38.2% retracement level
- If the daily closing is above 3380, the technical structure is still a healthy correction.
News-driven logic
- Negative factors:
Geopolitical situation and peace talks ➜ Risk aversion cools down ➜ Gold's attractiveness as a safe-haven asset decreases.
- Potential risks:
The progress of peace talks may be repeated (such as the situation between Israel and Hamas and Russia and Ukraine). If the negotiations fail, safe-haven buying will return quickly. Need to keep an eye on news sources.
Key signals for long-short game
Long signal: long lower shadow candlestick appears in 3370 area, US dollar index (DXY) falls below 105.0
Short signal: rebound fails to break through 3400 integer mark, US bond yield rises above 4.3%
Trading strategy suggestion
- *Long order opportunity*: 3370-3380 light position to try long, stop loss 3355 (below the previous low), target 3400/3420.
- *Short order opportunity*: 3415-3425 to arrange short orders in batches, stop loss 3440, target 3390.
2: Break down
- Trigger condition: daily closing price <3365
The callback is upgraded to a deep correction
- Target: 3340→ 3300 (psychological barrier + trend line support)
- Operation: Chasing short needs to wait for a rebound to around 3400, stop loss 3420.
3: Restart the rise (probability 10%)
- Trigger condition: Break through 3440 and stand firm for 1 hour
- Possible driving force: Geopolitical conflict escalates/Fed rate cut expectations rise
- Target: 3480 (historical high psychological resistance) → 3500
- Operation: After breaking through 3440, step back to 3425 to chase longs, stop loss 3405.
Key event risks this week
1. Wednesday: US May CPI data (core CPI expected to be 3.5%)
- If data > expectations: expectations of rate hikes rise → bearish for gold
- If data < expectations: expectations of rate cuts come earlier → bullish for gold
2. Thursday: Fed interest rate decision + Powell press conference
- Pay attention to the dot plot's hints on the number of rate cuts in 2024 (current market pricing is about 2 times)
3. Geopolitical headlines: progress in the Iran nuclear agreement, black swan risks in the French election
Position management principles
1. Total risk exposure ≤ 5% of account net value
2. Reduce positions by 50% 3 hours before key events (avoid instantaneous fluctuations in CPI/FOMC)
3. Breakout strategy stop loss setting: 15 points outside the previous high/low to prevent burrs
Conclusion: The effectiveness of the current 3373 support needs to be verified by Wednesday's CPI data. It is recommended that the London market operate in the 3370-3420 range and reduce positions before the US market to wait for data guidance. If you hold long positions, 3380 is the last line of defense; if you hold short positions, consider taking profits in batches above 3400. The medium-term bullish trend of gold has not been broken, but the risk aversion premium needs to be digested in the short term.
If you need a more detailed entry point analysis or position management to solve your long-term loss problem, please feel free to tell me your trading cycle and risk preference, and I will provide you with a customized strategy.

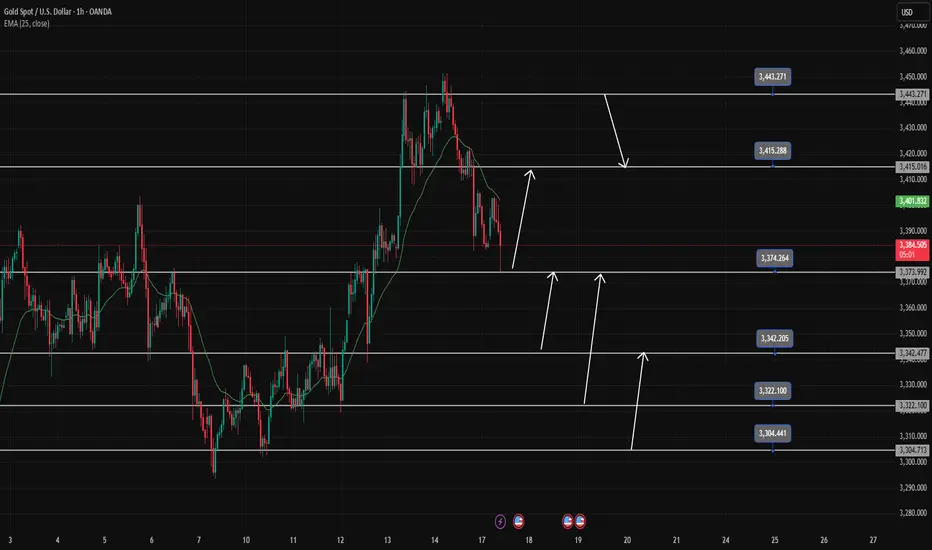
Gold trading strategy June 17D1 candle shows profit taking by sellers pushing the price back below 3400. In the current context, the pullback is only short-term and has not confirmed the reversal, but long-term Buy signals can still be noticed at important support zones.
Today, there are many price zones that can BUY Gold, so wait for confirmation before placing an order. Gold is heading towards the first support around 3375-3373 (this zone has just reacted 100 pips). This is also the Breakout zone. If it breaks this zone, Gold will reach 3343-3341 before it can BUY.
Note that to sell break 3373 and the SELL resistance point must wait for 3415 and the daily resistance 3443-3445
If there is a sweep to 3343 and bounces and closes above the 3373 breakout zone, it confirms that the uptrend will continue strongly in the near future.
The next BUY support zone to pay attention to is 3322-3320 and the 3305-3303 zone. The BUY target is always pushed further back to 3415 or to the peak around 3443.
SUPPORT: 3373;3342;3322;3304
RESISTANCE: 3415;3443
Fed Rate Decision May Trigger a Decline in Gold PricesDespite heightened tensions in the Middle East providing safe-haven support, gold failed to break through the 3450–3455 resistance zone today and instead pulled back to the 3400–3386 support area.
This decline was mainly driven by two factors:
Iran expressed willingness to resume nuclear talks, easing geopolitical tensions and weakening safe-haven demand.
Growing expectations that the Fed will keep rates unchanged this week strengthened the DXY, reducing gold's appeal.
That said, inflation concerns persist, offering medium-term support to gold. On the technical front, the 3378–3340 consolidation zone may serve as secondary support, while stronger trend support lies in the 3310–3289 range—a level that may only be tested under extreme bearish conditions.
For now, the primary support to watch is 3386–3373, with short-term rebound resistance around 3400–3420.
Trading Suggestion:
Ahead of the Fed’s rate decision tomorrow, consider buying on dips, as today’s decline may lead to a technical rebound. Then reassess the market’s response to key support and resistance levels to determine further action.

3400 3380 are the two points that determine the trend of gold📰 Impact of news:
1. Geopolitical risks
2. Expected Fed policy
📈 Market analysis:
This week, the Federal Reserve's policy meeting, retail sales data, initial jobless claims and geopolitical situation will be the core factors affecting global markets. In the short term, gold rebounded after hitting the 3383 line. This round of decline was relatively rapid. At the same time, there is a certain resistance at the 3405-3410 line above in the short term, which is also the main reason for our long orders to leave the market. In the short term, it is recommended to first look at the support situation at the 3380 line below, and then enter the long order after obtaining effective support above this position. On the contrary, if it falls below this short-term support, the gold price is expected to fall to the 3350 mark! For the evening layout, it is recommended to focus on the 3400 long-short watershed, pay attention to the 3410 line of resistance, and pay attention to the 3380 line of support below.
🏅 Trading strategies:
BUY 3390-3380
TP 3400-3410-3420
SELL 3400-3390
TP 3380-3360-3350
If you agree with this view, or have a better idea, please leave a message in the comment area. I look forward to hearing different voices.
TVC:GOLD FXOPEN:XAUUSD FOREXCOM:XAUUSD FX:XAUUSD OANDA:XAUUSD

Gold has broken below the $3,400 level.The gold price continued its steady retracement during the European session, pulling back from a two-month high to around $3,400. The positive performance of equity markets is regarded as a key factor undermining the safe-haven demand for precious metals, as gold's three-day winning streak appears to have come to an end. However, analysts believe the downside remains limited, as traders may avoid aggressive positioning ahead of Wednesday's crucial Federal Open Market Committee (FOMC) policy decision.
Meanwhile, growing market expectations that the Federal Reserve will further cut interest rates in 2025 have kept the U.S. dollar under sustained pressure after it hit a three-year low last Friday. This scenario, in turn, provides some support for non-yielding gold. Additionally, persistent trade uncertainties and escalating geopolitical tensions in the Middle East may emerge as drivers for gold prices, keeping bearish traders cautious before any meaningful downward moves.
Although gold has broken below $3,400 and the short-term trend has shifted, the long-term direction remains unchanged with a bullish bias. There is still potential to target the $3,500 high in the future, but it is necessary to wait for the bottom to stabilize before accumulating long positions. In the current market, we can only follow the trend—adapting to market movements. Consider initiating short positions during the rebound in the coming two days.
you are currently struggling with losses,or are unsure which of the numerous trading strategies to follow,You have the option to join our VIP program. I will assist you and provide you with accurate trading signals, enabling you to navigate the financial markets with greater confidence and potentially achieve optimal trading results.
Trading Strategy:
sell@3420-3430
TP:3380-3390

Gold: Key Levels Amidst Bull-Bear ClashDaily Technical Analysis
Daily Chart
Gold trended sideways-up last week, repeatedly testing upper resistance without a decisive breakout, though bullish momentum remains robust 🚀💪. The Bollinger Bands are expanding upward with price near the upper band, moving averages in bullish alignment, and MACD forming a golden cross above the zero axis with an expanding red histogram—signaling a dominant long-term uptrend 🔥📈!
4-Hour Chart
After reaching an intraday high of 3451, price corrected lower, forming small bearish candles that indicate short-term bearish momentum 📉🔻. However, moving averages still maintain a bullish order, with initial support at the psychological level of 3400. If price stabilizes here, further upside may resume 📈🚀. MACD has formed a bearish cross at high levels with a nascent green histogram, suggesting near-term correction is needed ⚠️🔄!
1-Hour Chart
Price is in a correction channel after retreating from highs, suppressed by short-term moving averages 📉🔽. Note that 3382 acts as a key prior support—if price pulls back to this zone, it may trigger bullish rebounds 💪🔥! RSI hovers around 50, indicating balanced long-short forces with an unclear near-term direction 🤷♂️🔀.
Gold Trading Strategies
sell@ 3430-3450
tp:3410-3400
buy@3400-3403
tp:3420-3430 (3450 if 3430 breaks)🚀
Professional trading strategies are pushed daily 📊
Lock in precise signals amid market fluctuations 🚀
Confused about market trends? Stuck in strategy bottlenecks?
Real-time strategies serve as your "trading compass" 🌐
From trend analysis to entry/exit points, dissect market logic comprehensively
Refer now 📲
Help you move steadily forward in investments ✨
👇👇👇
