Middle East tensions rise, gold eyes 3500 this week
🌍 Over the weekend, tensions in the Middle East escalated sharply, with geopolitical conflicts further intensifying. Multiple forces were drawn into the fray, the scope of conflict expanded continuously, and related military actions triggered widespread international concern, significantly increasing regional uncertainty. This geopolitical instability has had a profound impact on global financial markets, causing a notable decline in investors' risk appetite. Against this backdrop, gold, as a traditional safe-haven asset, has once again become the top choice for investors. The market expects that as the Middle East situation continues to ferment in the coming week, risk-averse sentiment will remain high, and gold is expected to continue benefiting from this trend, with a high likelihood of breaking through the key $3,500 mark 📈.
Additionally, this week's Federal Reserve interest rate decision and Chairman Powell's speech will also be key factors influencing the trend of gold prices. Recent U.S. economic data has been mixed, and fluctuations in inflation figures as well as subtle changes in the job market have left the market full of uncertainty about the Fed's monetary policy direction. If the Fed signals a dovish stance in its interest rate decision, hinting at the possibility of future rate cuts, gold prices will undoubtedly gain further upward momentum. A lower interest rate environment reduces the opportunity cost of holding gold while weakening the appeal of the U.S. dollar, thus prompting more funds to flow into the gold market. Conversely, if the Fed adopts a hawkish stance, emphasizing the maintenance of current interest rates or even hinting at possible future rate hikes, this will exert certain pressure on gold prices ⚖️.
Equally noteworthy is that U.S. President Trump will visit Canada from June 15th to 17th to attend the G7 Leaders' Summit. Trump's words and deeds in international affairs often carry significant influence and uncertainty. At this summit, his speeches and interactions with other world leaders may trigger a reassessment of the global economic and trade situation by the market, thereby causing fluctuations in gold prices 📊. For example, if Trump makes tough statements on trade policies, geopolitics, etc., it may exacerbate market concerns and push gold prices higher; if he conveys more positive signals of cooperation, market risk appetite may recover, and gold prices may face certain correction pressure. Therefore, investors need to closely monitor every move of Trump at the summit to timely grasp investment opportunities and risks in the gold market 👀
⚡️⚡️⚡️ XAUUSD ⚡️⚡️⚡️
🚀 Buy@ 3410 - 3415
🚀 TP 3480 - 3490
Accurate signals are updated every day 📈 If you encounter any problems during trading, these signals can serve as your reliable guide 🧭 Feel free to refer to them! I sincerely hope they'll be of great help to you 🌟 👇
Xauusdshort

Middle East Tensions Soar, Bulls Remain DominantBrief Update on Escalating Israel-Iran Conflict:
On June 14, Israeli forces airstruck Iran's Defense Ministry, nuclear facilities, and oil installations—causing a Tehran residential building to collapse and killing 60 civilians. 💥
Iran fired 50 ballistic missiles into Israel, damaging structures in Tel Aviv. A senior advisor to Iran's Supreme Leader died from injuries; Israel released a hit list of 9 Iranian nuclear scientists. ⚠️
Iran Nuclear Talks Developments:
Iran announced new nuclear safeguards without IAEA notice, warning NPT withdrawal if sanctioned. 🛑
June 15th U.S.-Iran talks canceled. ⏳
The Middle East situation is currently heating up 🌍💥. With the intensifying of geopolitical tensions in the Middle East over the weekend, gold is likely to continue to benefit from the boost of risk-averse sentiment next week and may break through the $3,500 mark 📈. The price of gold will also be affected by the Federal Reserve's decision and Powell's speech during the week 🏛️. In addition, US President Trump will visit Canada to attend the G7 Leaders' Summit from June 15th to 17th, and his speech at that time may also affect the fluctuation of gold prices, which is worthy of attention 🇺🇸🇨🇦
⚡️⚡️⚡️ XAUUSD ⚡️⚡️⚡️
🚀 Buy@ 3410 - 3415
🚀 TP 3480 - 3490
Accurate signals are updated every day 📈 If you encounter any problems during trading, these signals can serve as your reliable guide 🧭 Feel free to refer to them! I sincerely hope they'll be of great help to you 🌟 👇

Gold Spot / U.S. Dollar (XAUUSD) - 30m ChartA 30-minute candlestick chart showing the price movement of Gold Spot against the U.S. Dollar (XAUUSD). The current price is $3,433.88, reflecting a +$48.32 (+1.43%) increase. The chart highlights a recent upward trend with a shaded resistance zone around $3,460.06 and a support level near $3,400.06, as of 10:52 AM PKT on June 15, 2025.

GOLD H1 Intraday Chart Update For 16 June 2025Hello Traders,
Read GOLD intraday Chart carefully as WAR scenarios is still active, only if market breaks 3400 Psychological Level Successfully then we will consider or expect longer term selling
otherwise market remains Bullish
Disclaimer; Forex is Risky

Safe-Haven Demand Expected to Push Gold Prices Toward 3500Last week, intensifying conflict between Israel and Iran triggered a strong wave of risk-off sentiment in the markets.
As a result, we saw sharp rallies across major safe-haven assets and crude oil.
Over the weekend, tensions continued to escalate and even showed signs of further expansion.
Under such circumstances, it's clear that heightened geopolitical risk will continue to support gold prices.
However, 📍$3500 remains a major resistance zone at the moment.
If gold spikes to this level intraday, it’s very likely we’ll see a short-term pullback —
Whether due to profit-taking, cautious positioning by sideline capital, or selling pressure from trapped shorts above 3490,
⚠️ this kind of correction is a natural market reaction — driven by human nature.
Even with strong risk-off demand in place, after a $200 rally,
the market is still subject to volatility from profit-taking behaviors.
🔑 Trading Strategy for This Week
As long as tensions in the Middle East persist,
🎯 the primary bias remains bullish.
However, the entry point is crucial.
💡 Important notes:
Avoid chasing price after sudden spikes caused by breaking news.
Those spikes are not ideal buy zones — instead, look for short-term selling opportunities at those highs.
Once the price pulls back, assess the retracement level and key supports before looking to buy the dip.
We are now within a historically high price range,
which means any rally could trigger profit-taking from earlier longs.
While the overall trend may still head higher,
⚠️ you need to carefully evaluate the size of potential pullbacks and whether your account can withstand the associated risks.
📊 Technical Levels to Watch:
Resistance: 3450-3455 (minor), 3468-3474 (previous high), and 3487-3499 (major historical high)
Support: 3420–3410 zone, and the deeper 3400–3386 range
Stay alert, trade wisely, and remember — in volatile geopolitical environments,
timing and discipline are more important than ever.

Gold (XAUUSD) Trading Setup – Mid-June 2025 Analysis🔰 Gold (XAUUSD) Trading Setup – Mid-June 2025 Analysis
This chart represents a strategic price action-based setup on Gold (CFDs on Gold – US$/Oz) using a 15-minute timeframe. It includes clearly defined entry zone, support/resistance levels, and profit-taking targets (TP1, TP2) for both bullish and bearish scenarios.
🔍 Current Market Context
Current Price: ~$3431.77
Structure: The price has been in an upward trend with a consolidation phase forming near the key mid-zone.
Highlighted Zone: A decision zone is marked in red (between ~$3422 and ~$3418), acting as the key liquidity zone or breakout area.
📈 Bullish Bias
If price breaks and holds above the red zone:
✅ TP1: $3480
✅ TP2: $3580
These levels act as short- to mid-term bullish targets based on projected extensions of recent upward momentum.
📉 Bearish Bias
If price breaks and holds below the red zone:
✅ TP1: $3320
✅ TP2: $3260
This indicates a possible reversal or correction phase, with targets derived from recent swing lows and support areas.
📌 Trading Notes
The blue shaded areas represent target zones for partial or full exits.
Red zone is the critical breakout decision point.
Ideal for breakout or pullback traders.
Can be combined with volume/confirmation indicators (e.g., RSI, MACD, or price action candles) for entry timing.

XAUUSD: Still Bullish with improved entry zones! Gold experienced a sudden drop today, falling to 3335 after briefly reaching 3391. This unexpected decline was not anticipated given the bullish price momentum. However, it has provided clarity for buyers, particularly swing traders. The price could drop to 3340 once more before reversing and hitting our first target, followed by a second target later.
Another possible scenario arises if the price continues to drop further. In this case, the second entry scenario becomes more secure, as Asian session volatility could cause the price to go sideways.
Please use accurate risk management and consider liking and commenting on this idea.
Good luck and trade safely.
Team Setupsfx_

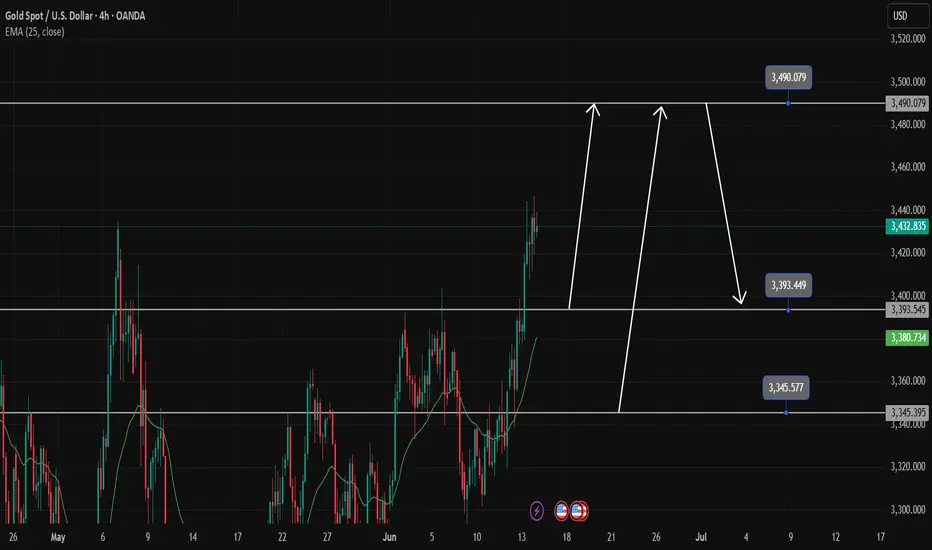
Gold price is sure to make ATH in the new weekGold confirms a long-term uptrend. The ATH 3500 zone is likely to have a reaction before 3490.
Any pullback in Gold next week is still considered a good opportunity to Buy Gold. And the bullish price gap is likely to continue on Monday.
3495 and 3345 are accumulated with many people waiting to Buy there, setting up a Buy signal with SL 10 price at the weekly support and resistance zones.
The possibility of breaking ATH next week is very high
Support 3393-3345
Resistance 3490
Current Gold Trend Analysis and Trading RecommendationsOn Friday, the strategy of going long on gold at relatively low levels was once again precisely fulfilled. The morning strategy clearly suggested opening long positions within the range of 3400 - 3410. As expected, the price of gold once again surged to around the 3445 level, and profits were successfully secured once more.
The hourly chart of gold shows a volatile upward trend. Driven by risk aversion in the early morning, it surged rapidly but fell back for correction after hitting resistance at 3444 during the European session. Before the U.S. session, it stabilized at 3412 and rallied again. The previous large bearish candlestick was more of a minor shakeout—after washing out floating chips, it has now regained its upward momentum.
Maintain a strongly bullish approach for now. The 3415-3410 range forms a key support zone, and long positions can be continued above this level. Upper resistance remains at 3445-3450; a valid breakout could lead to further gains toward 3475 and beyond. However, be aware that a sustained rally may trigger a pullback due to overbought indicators or divergences. For operations, consider going long near support and exercise caution when chasing highs near resistance
XAUUSD
buy@3405-3315
tp:3430-3450
Investment itself is not the source of risk; it is only when investment behavior escapes rational control that risks lie in wait. In the trading process, always bear in mind that restraining impulsiveness is the primary criterion for success. I share trading signals daily, and all signals have been accurate without error for a full month. Regardless of your past profits or losses, with my assistance, you have the hope to achieve a breakthrough in your investment.

Gold: Monitor Middle East Developments Over the WeekendAmid escalating tensions in the Middle East, risk-off sentiment surged,
sending gold soaring past the 3414 resistance and peaking near 3450,
before retracing and rebounding off the 3414 support zone.
⚠️ While this was a high-volume breakout, it was news-driven,
so keep in mind:
📌 If tensions ease over the weekend, a pullback on Monday is highly likely
📌 If tensions escalate, another bullish run would be expected
—
🔍 Technical Outlook:
🧭 4H chart: 9-count nearing completion — overbought signals building
🧭 2H chart: MACD showing early signs of a bearish crossover; potential divergence forming
🧭 1D chart: Breakout with volume confirms bullish trend, but risk of short-term correction remains
—
📌 Key Price Zones:
🔺 Resistance: 3468 – 3487 – 3500
🔻 Support: 3414 (critical) – 3400 – 3392
⚠️ If broken, next downside targets: 3378 – 3367
—
📈 Strategy Suggestions:
As we head into Monday:
✅ Consider selling on rallies if geopolitical tensions ease
✅ If tensions worsen, follow the momentum — but watch for reversal signs

May peace prevail on earthIf geopolitical conflicts continue to fester, gold prices may keep climbing due to safe-haven demand—yet this is far from our wish. 📈
When risk aversion pushes candlestick charts higher, we'd rather see battlefield fires cease by dawn, letting the rhythm of peace replace market volatility. 🌍✨

Bull market continues? Beware of the possibility of a pullback📰 Impact of news:
1. The geopolitical situation between Israel and Iran deteriorates
📈 Market analysis:
In the short term, gold is expected to rise further. Relatively speaking, there is still room for further increase. If it continues to rise today, it depends on the test of 3440 points, which is the opening position of the previous decline. In the short term, pay attention to the 3340-3350 resistance. If it can break through and stay above it, the 3468-3493 line we gave in the morning can still be used as a reference, and it is even expected to reach 3500. But at the same time, the RSI indicator in the hourly chart is approaching the overbought area, so we still need to be vigilant about the possibility of a pullback.
🏅 Trading strategies:
SELL 3440-3450
TP 3430-3420
BUY 3415-3400
TP 3420-3440
If you agree with this view, or have a better idea, please leave a message in the comment area. I look forward to hearing different voices.
TVC:GOLD FXOPEN:XAUUSD FOREXCOM:XAUUSD FX:XAUUSD OANDA:XAUUSD

XAUUSD: Analysis June 13This morning, the gold market witnessed a strong price increase after receiving two important news:
- US CPI was lower than expected, causing the USD to weaken.
- Israel continued to strike Gaza, raising concerns about escalating conflict in the Middle East.
🟨Trend: Strong increase - Break resistance
✅ Potential Buy Zone: 3410 – 3405: This is the breakout zone after the news, you can wait to buy if the price retests. SL 2399
❌ Potential Sell Zone (exit block or surfing):
✅ 3450 - 3455, SL 3461: Strong resistance, old accumulation zone (according to Bar chart, Resistance is determined at 3,455). If RSI/H1 shows overbought signal, consider taking profit or short Sell.

XAUUSD:Buy or SellRegarding the trend of XAUUSD (gold against the US dollar), it is completely in line with my expectations yesterday. The current price has reached the watershed of 3345. If it breaks through, continue to be bullish. If it does not break through. Then wait for the market to fall.
### Key analysis points
1. Confirmation of resistance breakthrough
- The importance of the 3345 level: If this position is a resistance that has been tested many times recently (such as previous highs, Fibonacci retracement levels or trend line suppression), it may trigger short-covering or new buying after the breakthrough, pushing the price further up.
- Verify the effectiveness of the breakthrough: It is necessary to observe the momentum at the time of the breakthrough (such as accompanied by a large positive line, increased trading volume) and whether the closing price can stand above 3345 to avoid false breakthroughs.
2. Upward target
- First target: If the breakthrough is established, the next resistance may look at the 3360-3380 area (previous high or extended Fibonacci level).
- Medium-term potential: If the trend reversal is confirmed, it may even challenge the 3400 psychological level.
3. Pullback risk management
- Support level: If it fails to break through 3345 or falls back after a false breakout, you need to pay attention to the support below (such as 3320-3300), which is the short-term long-short watershed.
- Stop loss reference: The stop loss of long positions can be set below 3300 to protect the safety of funds.
Trading strategy suggestions
- Aggressive strategy (breakthrough trading):
- Entry: Go long when the price breaks through 3345 and then confirms the pullback.
- Stop loss: Below 3320 (adjusted according to volatility).
- Take profit: Close orders in batches (3360, 3380).
- Conservative strategy (retracement trading):
- Wait for the pullback to the 3320-3300 support area to stabilize and then go long, stop loss 3280.
- The target is the same as the breakthrough strategy.
- Short warning:
If the 3345 resistance continues to suppress and a bearish pattern appears, consider shorting with a stop loss above 3360.
Variables to be added
1. Time frame: Is the above analysis based on the daily or 4-hour chart? Short-term trading requires a smaller cycle to confirm the signal.
2. Driving factors: Pay attention to the Fed's policy expectations, the US dollar index, the geopolitical situation, etc., which may suddenly change the technical pattern.
Summary
Whether the current rebound can continue depends on the effectiveness of the breakthrough of 3345. If successful, it can be bullish, but a strict stop loss is required.
If you need a more detailed entry point analysis or position management plan, please feel free to let me know your trading cycle and risk preference, and I will provide you with a customized strategy.

XAUUSD: Buy or sell now?Continuously update good transactions. Let members make rich profits. How to trade XAUUSD today?
Reference suggestions are as follows:
If it retreats to the range of 3318-3328, consider buying. Target 3345-3360
If it falls below 3310, chase the shorts and choose to sell. Target 3280-3265
For reference only. Do not trade independently.
If you need a more detailed entry point analysis or position management solution, please feel free to tell me your trading cycle and risk appetite, and I will provide you with a customized strategy.

XAUUSD: Buy or sell now?The price of XAUUSD has come to the position near 3345 again. The pressure at this position is very controversial. We need to observe. If this position is stable. Then we need to pay attention to the target of 3360-3385. If it is unstable, we will short and wait for the TP of 3320, which still needs to be emphasized. If you are not sure how to trade. Remember to leave us a message. We will lead you to make better and more accurate transactions, expand profits or recover losses. Do not trade independently. Create greater losses.
Remember to continue to pay attention to the core trading strategy updates of swing trading.
Gold Price Analysis June 13Yesterday's D1 candlestick increased, confirming the continuation of the uptrend. Following that uptrend, the Asian session saw a strong increase in price to the highest peak of 3443. If there is still confirmation from the h4 candlestick above 3395, today will still be a bullish candlestick with a large amplitude at the end of the day.
After reaching the highest peak of the month, Gold is having a downward correction at the end of the Asian session. This correction lasts until the support of 3397 to have a good BUY signal. In case you want to SELL, you must wait for a 50% test of the previous full-force downtrend H1 candle (around 3434) and the continuation of the Selling side.
If the 50% test does not appear, you must reverse to find a BUY Breakout point. Note that the False break at the peak of 3343 should wait for confirmation of the small-frame DOW wave to enter the order, which will be safer for this morning's break.
If you get a BUY order, the target will be 3364 and this area will have a profit-taking reaction from the Buyers, causing the price to decrease. Gold may touch the threshold before ATH 3394 and there will be a reaction.
In the opposite direction, there is a sweep to 3376, which is considered the daily support zone and you can buy in this area.
All SELL signals are considered obstacles, so set a short target and a new BUY signal sets a long expectation.

As conflict escalates, gold is cautiously long📰 Impact of news:
1. The geopolitical situation between Israel and Iran deteriorates
📈 Market analysis:
The worsening geopolitical situation caused a surge in gold prices. The intraday short-term support points of 3420, 3402, and 3380 will all become key support for testing bulls. If the European session is strong, 3420 cannot be lost. If it falls back and loses, it will move closer to the top and bottom conversion position of 3402. If you go long later, you must pay attention to the weakening of the upward momentum. If the European session continues to break the high of 3440, then the US session can be seen around 3468-3493. If the upward momentum in the European session weakens, we need to watch out for a short-selling counterattack and a sharp decline. The geopolitical situation is unstable. Bros must strictly control SL when trading independently.
🏅 Trading strategies:
BUY 3420-3402-3380
TP 3390-3400-3420-3460-3490
If you agree with this view, or have a better idea, please leave a message in the comment area. I look forward to hearing different voices.
OANDA:XAUUSD FX:XAUUSD FOREXCOM:XAUUSD FXOPEN:XAUUSD TVC:GOLD

Current Gold Trend Analysis and Trading RecommendationsThe tensions between the U.S. and Iran continue to intensify as the second U.S. nuclear-powered aircraft carrier enters the Persian Gulf. Iran's Defense Minister warned that it would attack U.S. bases if conflict broke out. However, the sixth round of talks between the two sides is scheduled for June 15 in Oman, a development that has raised market expectations for a de-escalation of negotiations. Geopolitical risks are time-sensitive, as if the conflict does not escalate, risk aversion may fade rapidly, and gold could give back its gains.
From a 4-hour technical analysis, the short-term support level below focuses on the 3365 area, with the 3340 level as key support. The main strategy remains to go long on pullbacks to these support levels and follow the upward trend. The key bullish threshold lies at the 3320-3325 zone – any pullback before the daily close breaks below this level presents a buying opportunity, maintaining the primary approach of trend following. We recommend prioritizing long positions on corrections and using short positions on rebounds as a supplement. The short-term resistance above is at the 3400-3405 area, while the short-term support below is at the 3360-3350 range.
XAUUSD
buy@3350-3360
tp:3380-3400
Investment itself is not the source of risk; it is only when investment behavior escapes rational control that risks lie in wait. In the trading process, always bear in mind that restraining impulsiveness is the primary criterion for success. I share trading signals daily, and all signals have been accurate without error for a full month. Regardless of your past profits or losses, with my assistance, you have the hope to achieve a breakthrough in your investment.

gold on sell retest#XAUUSD on price reverse, possible expect price to drop below those bearish zone before buying.
Entry on sell 3421, SL 3431, TP 3399-3378.
Below 3378 holds bullish reverse, if H1 and next H1 closes long above 3433 then bullish will reach 3470.

6/13 Gold Analysis and Trading SignalsGood morning, everyone!
Gold rallied to around $3399 during yesterday’s session, accurately reaching our preset sell zone at 3385–3403. Since then, the market has started pulling back, and today’s opening shows signs of accelerated downside movement. However, there are several strong support zones below, with immediate focus on 3378–3368, and further support around 3352–3343.
📉 Technical Outlook:
The current price action suggests the potential formation of a Head and Shoulders pattern. If confirmed, this could trigger a deeper correction towards 3340–3330. A break of these levels would significantly weaken the current bullish structure and open further downside risk.
🌍 Fundamental Drivers:
Today’s inflation-related data releases may add significant volatility;
Additionally, stay alert to any developments in the Middle East geopolitical situation, which could quickly shift market sentiment toward risk-off if escalations occur.
📌 Today’s Trading Recommendations:
✅ Sell Zone: 3410–3420
✅ Buy Zone: 3338–3326
🔄 Intraday Key Reaction Levels:
3403 / 3378 / 3362 / 3355 / 3343
🔒 Recommendation: Market is at a technically sensitive zone. Consider entering positions in batches and maintain strict risk control.

Watch Out for Weekly-Level ResistanceAs news of Israel's strike on Iran’s nuclear facility continues to spread, a surge in risk-off sentiment has driven noticeable gains across safe-haven assets. The escalation of tensions in the Middle East has clearly become a key trigger for current market sentiment. Should the conflict intensify further, oil and other safe-haven assets may see continued upside; conversely, if tensions ease, the retreat of risk aversion could lead to price corrections.
From a technical perspective, gold is currently facing downward pressure from the weekly trendline. If geopolitical tensions persist, gold may potentially rally toward the 3500–3550 range. However, without stronger fundamental support, a significant correction could follow once that level is reached.
On the intraday chart, the price has now broken below the middle Bollinger Band on the 30-minute timeframe and is near lower band support around 3413. MACD and moving average alignment suggest there may still be room to test the 3396–3388 trend support zone. The 1-hour chart remains in a consolidation phase, and while a short-term rebound is possible, selling at higher levels appears to be the safer strategy for today.
As it is Friday and given the geopolitical uncertainties, the potential for weekend risk is significantly higher. It is recommended to reduce exposure before the market closes. If you choose to hold positions over the weekend, be sure to set appropriate stop-losses to mitigate unexpected developments.

Gold Bull Run: Wave 5 on the Way!
Elliott Wave Setup – We're in Wave 5, riding a powerful upward channel from the recent Wave 4 low, aiming for ~$3,500–3,600
Key Resistance & Breakout – The $3,497–3,500 area is critical. A clean breakout above this could open the next leg toward ~$3,600–3,700, echoing forecasts from ANZ and Cantor .
Support Level – Immediate support lies around the $3,392 area (recent resistance turned support). A dip back to $3,420–3,440 could provide a strong buying opportunity.
Macro Drivers – Geopolitical tensions (especially in the Middle East) and a soft U.S. dollar are fueling safe-haven buying, matching broader bullish sentiment
.
📈 Outlook: Minor pullback expected, then resumption of rally. Breakout above $3,500 could trigger the next surge.
🛡️ Strategy Tip: Consider buying on dips around $3,420–3,450 with resistance-based stop-loss and targets at $3,500 then $3,600–3,700.
