Long positions have made profits, focus on support📰 Impact of news:
1. The United States issues new sanctions on Iran
2. Trump continues to criticize the Federal Reserve
📈 Market analysis:
At present, the gold price has touched 3340. If it stabilizes here, we can arrange to go long. However, the gold price is constantly testing downwards, which is why I did not arrange to go long immediately. At the same time, we need to be vigilant about whether the gold price will fall below the important support of 3330. If it really falls below 3330, the gold price may test the support of the integer mark of 3300, which will also determine the future market trend.
🏅 Trading strategies:
SELL 3400-3370
TP 3340-3330-3300
BUY 3335-3330
TP 3350-3370
SELL 3325-3320
TP 3310-3300
If you agree with this view, or have a better idea, please leave a message in the comment area. I look forward to hearing different voices.
OANDA:XAUUSD FX:XAUUSD FOREXCOM:XAUUSD FXOPEN:XAUUSD TVC:GOLD
Xauusdshort

6/5 Gold Analysis and Trading SignalsGood morning, everyone!
Gold surged above 3380 yesterday but faced strong resistance, pulling back before testing the critical 3400 level. Despite multiple attempts, price failed to break through, highlighting a clear lack of bullish momentum near historical highs.
From a technical perspective, a potential M-top (double top) pattern is forming on the 30-minute chart. If confirmed, we can expect a deeper retracement, with an initial target around 3330, and possibly 3300 in case of further downside. Under this structure, today’s primary trading bias should favor short positions.
That said, if gold breaks above 3400 with strength, the 3416–3438 target zone becomes viable. However, any such breakout is likely to be followed by a pullback. In that scenario, we’ll closely monitor the 3392–3368 support range before executing follow-up trades.
📉 Technical Notes:
Price remains near a historical resistance zone, and buyers are showing hesitancy at these levels;
While yesterday’s Beige Book report provided short-term bullish sentiment, we need to observe whether the Asian and European sessions digest and extend that move.
🗞 Fundamental Outlook:
The key event today is the U.S. Initial Jobless Claims report, which may trigger volatility;
Gold remains supported by risk-aversion flows, but traders should be mindful of potential corrections at elevated levels.
💡 Risk Management Tip:
In such conditions, it is highly recommended to scale into positions with reduced lot size, and use tight risk controls to guard against unexpected reversals.
📌 Trading Recommendations for Today:
Sell near 3423–3436, targeting short-term pullbacks
Buy near 3312–3298, if deeper correction materializes
Pivot levels for tactical trades:
3416 / 3403 / 3392 / 3386 / 3367 / 3352 / 3343 / 3328
Strategy Summary:
Favor short setups on rallies unless 3400 is decisively broken. If support at 3362-3358 fails, expect the bearish trend to gain further momentum.

Gold Analysis June 6: Focus on Nonfarm Payrolls vGold, after rising around 3400, has been under strong downward pressure after US President Donald Trump and Chinese President Xi Jinping had a productive phone call. Today the market focuses on Nonfarm Payrolls
- Technically.
Gold has been under downward pressure from around 3400 and yesterday's decline was good, gold is currently trading below the 3400 zone. However, it has met support at the 3346 - 3340 zone.
Before today's NFP news, you can trade according to the above support zone to buy up, and sell at the psychological resistance zone of 3400.

6/6 Gold Trading StrategyAfter a short rebound, gold is now hovering near key resistance levels.
The critical zone is around 3366 – if price breaks above this, the next upside targets are 3378–3388.
However, from a broader perspective, the 4H chart still shows an uncorrected bearish setup.
Without strong buying volume, the price may drop again — potentially below 3330, or even breach the 3300 level.
—
📅 Key Data Releases Today:
🔹 NFP (Non-Farm Payrolls)
🔹 US Unemployment Rate
Both events are expected to bring high volatility, so manage your risk carefully.
—
📊 My Intraday Trade Plan:
✅ Sell on rallies
🎯 Target: around 3330-3290
📌 Only if price reaches that support zone will I consider shifting to a bullish bias

Gold Overview Strategy June 6The 3-candle D1 cluster did not close above 50% of the main bullish candle on Friday last week. Today's main view will be to BUY to 3413.
Today's resistance is around 3413 for the SELL strategy of the US Session. The Asian-European session is looking for a BUY point. There was just a nice BUY wave around 3363 where the price swept liquidity to 3359.
3382 is the target for the BUY order and this area can SELL Scalp in today's Asian-European session for a recovery wave because today's target is up to 3413 according to the bullish structure.
In the direction of Gold Down, contrary to our analysis, the support zone 3341 and support 3324 will support the upward force of gold prices.
The breakout boundary zone 3382 and 3341. Pay attention to breaking out from important resistances, then do not trade against the trend.
Resistance: 3373-3382-3399-3413
Support: 3357-3341- 3325

Long and short battle break out before NFP,gold operation layout📰 Impact of news:
1. NFP data released
2. Geopolitical situation worsens
3. Trump and Musk start a war of words
📈 Market analysis:
During today's U.S. trading session, we need to pay close attention to the impact of NFP on the market. Bros who trade independently must do a good job of risk control. The gold 1H chart shows that the current gold price is suppressed by the downward opening of the Bollinger Bands. Gold shorts dominate in the short term, and the MACD indicator has a tendency to form a death cross. At the same time, the 5-day moving average and the 10-day moving average form a death cross and move downward, indicating that the gold price is still facing adjustment pressure in the short term. Looking at the 4H chart, we can find that although gold is currently rising on the 4H trend line, gold has not yet fallen back to the right level. Therefore, we cannot rule out the possibility that gold will continue to fall back in the future. The key resistance level above is 3390-3400, and the support level below is 3350-3340, with a focus on the important support level of 3330. Participate in high-altitude and low-multiple in the European session today, and consider retreating to 3350-3340 to place longs
🏅 Trading strategies:
BUY 3350-3340
TP 3365-3385-3395
If you agree with this view, or have a better idea, please leave a message in the comment area. I look forward to hearing different voices.
TVC:GOLD FXOPEN:XAUUSD FOREXCOM:XAUUSD FX:XAUUSD OANDA:XAUUSD

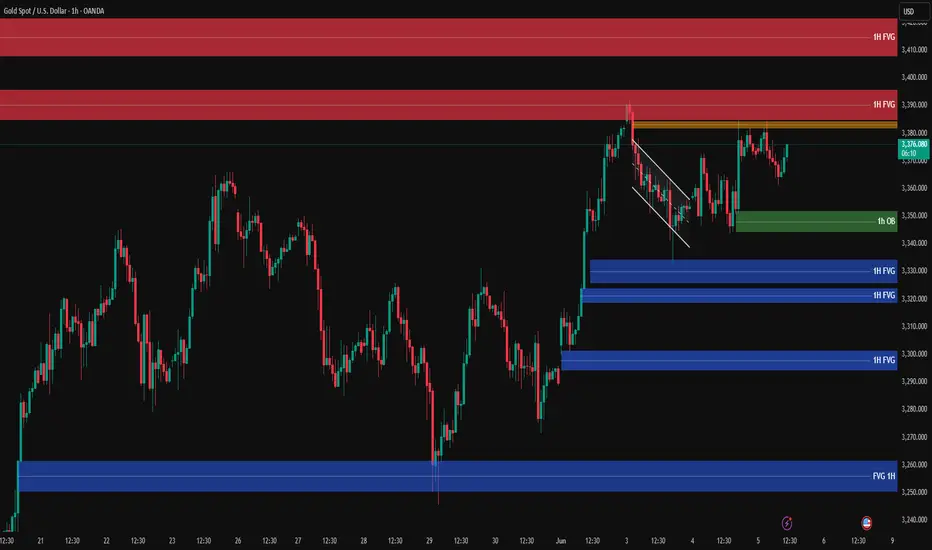
Gold Analysis – Likely Scenario📍 Gold is currently trading around 3375 USD and gaining bullish momentum with the London session opening.
🔸 Key Zones:
🟨 Critical Resistance (Orange Zone):
📍 3378 – 3384✅ Price consolidation zone – if broken with strong volume, a bullish continuation is likely.
🔴 Supply Zones (FVG):
1️⃣ Upper FVG 1H:📍 3386 – 3397
2️⃣ Main Supply Zone FVG 1H:📍 3405 – 3422
🟢 Demand Zone (1H OB):
📍 3345 – 3350✅ Strong buy zone after the breakout of falling wedge structure.
🔵 Lower Demand FVGs:
3330 – 3335
3315 – 3325
3290 – 3300
3260 – 3270
✳️ Likely Scenario:
If the orange resistance zone breaks, price is likely to rally toward the 3386 – 3397 FVG, and potentially 3405 – 3422.
If price gets rejected, watch for reactions at the 3345 – 3350 OB for potential long entries.
🔍 Insight by ProfitaminFX
If this outlook aligns with your bias, or if you see it differently, feel free to share your perspective in the comments. Let’s grow together 📈
Gold Price Analysis June 63 D1 candles closed without breaking through 50% of the previous bullish main candle. Today's main view will be BUY up to 34xx
Today's resistance is around 3413 for the SELL strategy of the US Session. The Asian and European Session is looking for a BUY point. There was just a nice BUY beat around 3363 where the price swept liquidity to 3369.
3382 is the target for the BUY order and this area can SELL Scalp in today's Asian and European session because today's target is up to 3413.
In the direction of Gold Down, contrary to the analysis, the support zone 3341 and support 3324 will support the upward force of gold prices.
Breakout boundary zone 3382 and 3341. Note that the break out does not block the train

Non-farm data is expected to help gold recover from its decline! Gold prices rose sharply in the Asian and European sessions yesterday, and fell in the US session. The roller coaster-like trend at the end of the day gave up all the gains during the day, falling below the 3350 mark and touching the 3339 line. The daily pattern showed a trend of first rising sharply and then falling sharply. The technical daily chart has been alternating between positive and negative for four consecutive trading days. The New York market fell sharply and tested the 7-day moving average, but the price is still running above the 10-day moving average/7-day moving average.
The Bollinger Bands on the short-term four-hour chart closed, the RSI indicator's middle axis flattened, and the hourly chart's four-hour moving average was glued. From a technical perspective, gold intraday trading is arranged with a volatile mindset, and the intraday range is arranged with reference to 3328/3388. Today's fundamentals focus on the non-agricultural employment data released by the New York market. The previous value was 177,000, and the market estimate was only 130,000. According to the estimate, it is bullish for gold/silver.
This year has always emphasized that 2025 is a strong year for gold, and gold may enter an acceleration period of long-term structure this year. Tariff trade policies, geopolitical tensions, the Federal Reserve's interest rate decision, the decline in confidence in U.S. debt, and the increase in global central bank purchases have all affected the trend of gold as a strong safe-haven tool, and gold will have room to rise. Therefore, as long as the overall environment remains unchanged, gold is still an absolute bullish trend. Therefore, no matter how it is adjusted, now is an opportunity to enter the long position.
Gold fluctuated in the 3332-3392 range in the first three days of this week. During this period, our high-altitude and low-multiple layout was completed as expected. Then, today gold will remain in this range and fluctuate upward. If it rises above 3400 and stabilizes, it will look to 3500 above; if it breaks through 3330, it will look to 3280 below. Pay attention to the fluctuations before the release of non-agricultural data. Non-agricultural data will cause an increase in liquidity, so try to avoid it.
Key points:
First support level: 3342, second support level: 3328, third support level: 3303
First resistance level: 3376, second resistance level: 3388, third resistance level: 3410
Operation ideas:
Buy: 3340-3343, stop loss: 3332, target price: 3360-3370;
Sell: 3387-3390, stop loss: 3400, target: 3370-3360;

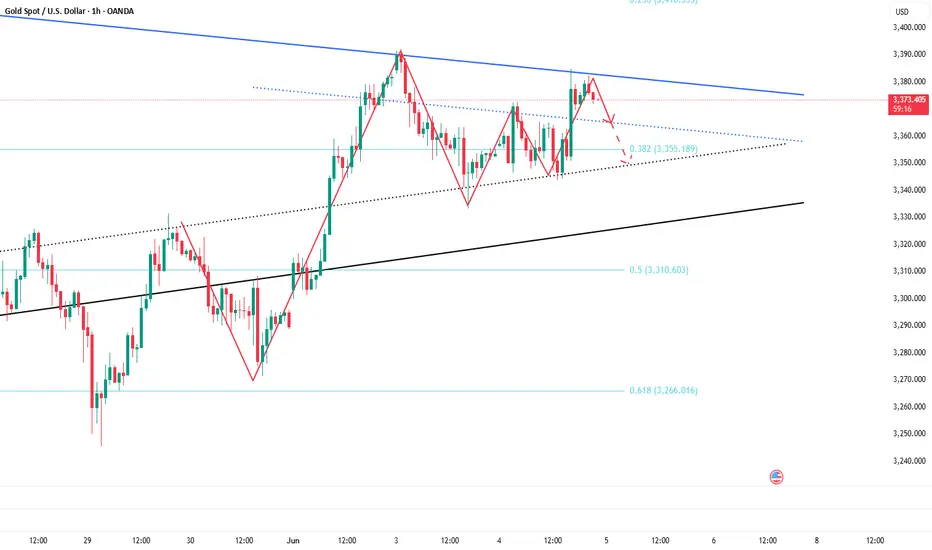
XAUUSD – Bearish Outlook from Resistance Zone📊 XAUUSD – Bearish Outlook from Resistance Zone
🕒 Date: June 5, 2025
💰 Instrument: Gold (XAUUSD)
📍 Current Price: 3,352.730 USD
🟨 Key Resistance Level
🔴 Price has sharply reacted from the 3,375–3,400 USD zone, highlighted as a strong resistance area.
📉 This zone has previously triggered significant sell-offs, confirmed again by the current bearish rejection (red arrow 🔻).
📉 Bearish Market Structure
The price structure suggests a classic lower high rejection scenario with potential for further downside:
🔻 Immediate Drop Expected
After rejection from resistance, the price shows early signs of breakdown. A minor pullback is expected before continuation.
🧭 TP1 – First Target Zone:
📍 3,245.560 USD
This level aligns with a previous demand area (light red box), likely to act as temporary support or reaction point.
🎯 TP2 – Final Bearish Target:
📍 3,127.527 USD
This blue demand zone is a major support level, previously a strong rally base (green arrow 🟢). Expect buyers to step in here again.
🔄 Trade Idea Summary
💼 Setup Type: Resistance Rejection
🛑 Bias: Bearish
📍 Entry Zone: ~3,350–3,360 USD (confirmed rejection)
🎯 Take Profit 1: 3,245.560 USD
🎯 Take Profit 2: 3,127.527 USD
🔒 Stop Loss: Above 3,400 USD (outside resistance zone)
📌 Observations:
🔁 The market repeated its previous pattern: bouncing from the blue demand zone and rejecting at the yellow resistance zone.
🧱 A solid breakdown below TP1 could accelerate movement toward TP2.
🔍 Watch for any bullish reaction around TP2 for potential reversal setups.
📉 Bias: Bearish
📆 Outlook: Short-term to mid-term swing

Is there still hope for the bull market to rise today?📰 Impact of news:
1. Progress made in talks between China and the USA
📈 Market analysis:
In view of the non-agricultural data to be released on Friday, the market is expected to maintain a volatile consolidation trend before then. From the daily level: the Bollinger Bands open gently, the gold price is running below the upper track 3414, and the MACD golden cross is running slowly, suggesting that the bullish momentum is weak. At the hourly level, the short-term short position is strong, and there is a certain rebound demand. Therefore, we pay attention to the 3343-3333 support line below, focusing on the 3300 support. After the gold price falls below the 3360 support, the 3360 position will suppress the gold price in the short term.
🏅 Trading strategies:
BUY 3343-3333
TP 3360-3370-3380
SELL 3360-3370
TP 3330-3320
If you agree with this view, or have a better idea, please leave a message in the comment area. I look forward to hearing different voices.
OANDA:XAUUSD FX:XAUUSD FOREXCOM:XAUUSD FXOPEN:XAUUSD TVC:GOLD

Gold XAUUSD Short 5th May 2025Price is approaching a strong supply zone at 3384–3386, where we’ve previously seen aggressive selling. If we get clear signs of rejection from this level (e.g., wicks, bearish engulfing, or failure to break above), I’ll be looking to enter short positions.
The structure shows a potential lower high forming, and if confirmed, we could see continuation to the downside toward recent support levels.
📉 Trade Signal
Bias: Sell
Entry Zone: 3384–3386 (on rejection)
Stop Loss: Above 3395
Take Profit Levels:
– TP1: 3370
– TP2: 3360
– TP3: 3345
⚠️ Note: Trade only if rejection is confirmed in the zone (e.g., bearish PA or failed breakout on 5m–15m).

US-China Talk Drops Gold Short; Short StrategyToday, Trump announced that China and the U.S. participated in a telephone exchange 🔊! After the market learned this, optimistic sentiment surged rapidly, causing U.S. stock futures to rise sharply in the short term 📈. As a result, spot gold turned lower in the short term ↓. The current situation favors short positions:
Short at current price 📉: Initiate a small short position near 3350 👌, set a unified stop loss above 3360 ⚠️, and target key support levels at 3325-3320 🎯.
Add to shorts on rebound ↕️: If the price rebounds to the 3350-3360 range, increase the short position 📊, maintaining the same target 🎯.
Chase shorts on breakdown 💥: If the price breaks below 3320 support, chase the short trend with a stop loss at 3330 ⚠️, targeting the psychological level of 3300 🧠.
Risk reminder ⚠️: Monitor U.S. stock futures and follow-up developments in U.S.-China relations closely 👀, and be wary of volatility caused by a reversal in market sentiment 🚦. Keep position sizes within 10% ⚖️ and strictly adhere to stop losses ⛔.
Gold Trading Strategies
sell@3350-3355
tp:3325-3320
sell@3315-3320
tp:3305-3300
Professional trading strategies are pushed daily 📊
Lock in precise signals amid market fluctuations 🚀
Confused about market trends? Stuck in strategy bottlenecks?
Real-time strategies serve as your "trading compass" 🌐
From trend analysis to entry/exit points, dissect market logic comprehensively
Refer now 📲
Help you move steadily forward in investments ✨
👇👇👇

The long strategy has been successful, pullback and go long📰 Impact of news:
1. European Central Bank deposit facility rate in the eurozone as of June 5
2. Initial jobless claims data
3. Non-farm payroll data
4. Worsening geopolitical situation
📈 Market analysis:
At present, the gold price has broken through the previous highs of 3392 and 3395. There is no obvious peak signal in the short term. At the same time, as the gold price continues to rise, the lower support will also move up in the short term, and the 4HMACD has a golden cross trend. In the short term, pay attention to the 3385 support below and the 3410 resistance above. The 1H indicator is close to the overbought area. We still need to be vigilant about the risk of rising and falling. If the gold price retreats to 3390-3385, we can consider going long with a light position.
🏅 Trading strategies:
BUY 3390-3385-3375
TP 3400-3410
If you agree with this view, or have a better idea, please leave a message in the comment area. I look forward to hearing different voices.
OANDA:XAUUSD FX:XAUUSD FOREXCOM:XAUUSD FXOPEN:XAUUSD TVC:GOLD

Is there still a chance for a bull market in gold's decline?📰 Impact of news:
1. European Central Bank deposit facility rate in the eurozone as of June 5
2. Initial jobless claims data
3. Non-farm payroll data
4. Worsening geopolitical situation
5. Watch the impact of the dialogue between Trump and Xi Jinping on gold
📈 Market analysis:
This round of geopolitical conflict caused an upward breakthrough, but the price has cooled down due to the negotiations between China and the United States. The current market is swaying at 3374. In fact, gold has not yet taken a more obvious direction. After all, tomorrow, Friday, is a key node in the data market game. At the 4H level, today's European session has reached the 3404 line, and encountered resistance and pressure here. The current retracement is in line with our expectations, and we expect to go long. As long as the key position of the middle track is maintained, it will continue to rise after being pulled down. At present, I still hold long orders.
🏅 Trading strategies:
BUY 3390-3385-3375
TP 3400-3410
If you agree with this view, or have a better idea, please leave a message in the comment area. I look forward to hearing different voices.
TVC:GOLD FXOPEN:XAUUSD FOREXCOM:XAUUSD FX:XAUUSD OANDA:XAUUSD

Gold Liquidity run Short Setup Update This video is an update on the Gold setup that was posted on the 4/06/25
I cover the price action and discuss what I think will be occurring from this point onwards as
part of the original trading plan .

Trading strategy in US sessionGold price in the short term of the US session. The pulling of the h1 candle's wick creates an important liquidity zone of 3373. When h1 closes above this zone, it confirms that the US session will be a bullish session and can reach 3398 at the end of the session. If it closes below 3373, the BUY zone will be noticed at the support reaction in the European session around 3362.

XAUUSDThe trend of XAUUSD is fluctuating.
Wednesday: XAUUSD in the Asian market rose sharply to 3372 and then quickly dropped to 3348. The current quotation is 3360.
It is a good trading opportunity for traders who bought low yesterday. The lowest yesterday fell to 3333. The operating space fluctuates by about $40/ounce. Many people have no idea. The profit of trading 1 lot of buy orders is 4. The profit of trading 5 lots is 20k.
This week is the monthly data news week. Including ADP. ECB interest rate decision, big non-agricultural data that have a significant impact on the economy.
Trend observation. There is still an intention to continue to rise. In terms of operation, you can focus on buying at low levels.
Pressure range: 3400-3390
Support range: 3340-3350
Under the influence of news. Many trends will be distorted due to the influence of data news. So I have been reminding you not to trade alone. If you want to follow good swing trading instructions to make reasonable trades and expand your profits, please leave us a message.

gold on bullish#XAUUSD price have breakout the 3403, now we expect new formation before any possible move. Between 3390-3392 shows rejection on sell.
Buy on multiple breakout Between 3390-3392, TP 3415-3420, SL 3380.
If possible the next H1 drops and close below 3380 then bearish retracment will occur till 3370-3355.

Gold:Go short before you go long
Gold is currently volatile upward trend, here can not avoid repeated retracement. Now the performance is relatively strong break 3884 short - term high, then the United States is expected to attack twice, then can participate in the long again. Note: long is the main, short is the auxiliary
You can go short now, and then go long. Below is support around the 3365-70 zone
Trading Strategy:
SELL@3385-90
TP:3370-65
BUY@3365-70
TP:3390-3400
↓↓↓ More detailed strategies and trading will be notified here ↗↗↗
↓↓↓ Keep updated, come to "get" ↗↗↗

Gold Trading Strategy Overview June 5There is not much surprise with the D candlestick having increased again. The increase can completely reach 3408 today.
The H1 wave structure also shows that the trend is increasing strongly and heading towards above 3400. 3363 is considered the first BUY support zone in the Asian and European sessions today.
3344 is the most important boundary zone of the trend, breaking this zone will cause the uptrend to break to 3400 in the short term and must wait for new uptrend waves.
In the opposite direction, 3382 is the resistance zone of the Asian and European sessions today and is also the breakout zone, this zone will reach above 3400 but before that there will be a reaction around 3397, which is a very likely flash break zone of the previous peak.
Resistance: 3382-3397-3410
Support: 3363-3344-3325-3317
Pay attention to trading at support and resistance zones when there is confirmation

Bull market returns? Aiming at 3400?📰 Impact of news:
1. New uncertainty in Russia-Ukraine negotiations
📈 Market analysis:
The current trend of gold prices is erratic and discontinuous, and only swing trading can be adopted during the day. In the short term, there is a certain pressure at 3385-3395 above. If this resistance area is broken, the gold price is expected to continue to rise. The short-term support below FOREXCOM:XAUUSD is at 3350-3340. At present, the news has a greater impact on the gold price, coupled with the support of market risk aversion, so in the short term, attention should be paid to the break of the upper resistance.
🏅 Trading strategies:
BUY 3370-3365
TP 3385-3395-3400
SELL 3395-3400
TP 3380-3370
BUY 3350-3340
TP 3370-3380
If you agree with this view, or have a better idea, please leave a message in the comment area. I look forward to hearing different voices.
OANDA:XAUUSD FX:XAUUSD FXOPEN:XAUUSD TVC:GOLD

I still have a short position.Although gold has risen sharply to above 3380 due to the intensification of the Russian-Ukrainian conflict, it has not made a substantial breakthrough, and has not stabilized above 3380. The bulls are not determined, which also shows that the technical suppression in the 3290-3295 area above is still strong. If gold does not break through in one fell swoop, gold is likely to usher in a wave of retracement in the short term.
Due to the fundamental impact of tariff issues and geopolitical conflicts, for short-term trading, we should not have too high expectations for the extent of the retracement for the time being, but it is expected to retrace to the 3365-3355 area. In terms of short-term trading, I still hold a short position executed near 3375, and I hope that gold can fall back and hit TP as expected.
Trading strategy:
Consider shorting gold in the 3375-3385 area, TP: 3365-3355