Keep gold shorts open and look forward to profits!After breaking through the resistance areas near 3335 and 3355, gold continued to rise to around 3379; although the rise in gold was relatively large, after gold touched above 3370, the bullish momentum weakened and there were signs of high-level stagflation, so gold is still expected to usher in a wave of retracement in the short term.
After the sharp rise in gold, the current relatively obvious support area is located in the 3345-3335 area. If gold cannot effectively break through 3380, then gold is expected to retrace to test the support of the 3345-3335 area again.
As the trading strategy shared in my previous opinion, I have shorted gold in batches in the 3370-3380 area as planned. At present, we still hold short positions. Let us look forward to the expected retracement of gold!
CAPITALCOM:GOLD OANDA:XAUUSD FOREXCOM:XAUUSD TVC:DXY
Xauusdshort

Gold:Take a short position
Gold: hourly level to see the top, technical form has the trend of adjustment, short - term can be considered short.
Trading Strategy:
sell@3370-75
tp1:3360
tp2:3345-40
↓↓↓ More detailed strategies and trading will be notified here ↗↗↗
↓↓↓ Keep updated, come to "get" ↗↗↗

Gold stumbles at 3379 resistance! Bull-bear eyes 3360-3390 zone I. Resistance and Support Levels
Resistance 🚧: The intraday high of 3379 acts as initial resistance, with strong resistance in the 3390-3400 zone 🏔️.
Support 🛡️: Initial support is at 3360-3365, while strong support lies in the 3325-3330 range 📉.
II. Trading Strategies
(1) Aggressive Long Position 🚀
Entry 📊: Lightly initiate long positions when the price pulls back to the 3365-3368 zone and stabilizes (e.g., bullish candlestick patterns appear 🔥).
Stop Loss ⛔: Exit if the price breaks below 3360.
Targets 🎯: First target at 3390; if breached, aim for 3435* (Note: "34350" in the original text is likely a typo—adjust based on actual market conditions ⚠️).
(2) Conservative Long Position 📈
Entry ⏳: Enter long after the price validly breaks above 3379 and retests support at the 3390-3395 zone 🔄.
Stop Loss ⚠️: Exit if the price falls below 3375.
Targets 🎯: Same as the aggressive long strategy 📍.
(3) Short Position 📉
Entry 📊: Lightly initiate short positions if the price rejects resistance in the 3380-3385 zone (e.g., bearish candlestick patterns form 📉) or fails to break above 3390 and drops below 3375 ⬇️.
Stop Loss ⛔: Exit if the price breaks above 3388.
Targets 🎯: First target at 3360; if breached, aim for 3330 🏁.
Professional trading strategies are pushed daily 📊
Lock in precise signals amid market fluctuations 🚀
Confused about market trends? Stuck in strategy bottlenecks?
Real-time strategies serve as your "trading compass" 🌐
From trend analysis to entry/exit points, dissect market logic comprehensively
Refer now 📲
Help you move steadily forward in investments ✨
👇👇👇

Don't chase long positions easily during high-level adjustments📰 Impact of news:
1. The conflict between Russia and Ukraine breaks out again, exacerbating the uncertainty of the situation
2. The tension in the Middle East continues, Iran claims to be ready to defend its airspace at any time, and the Houthi armed forces attack Israeli airports
3. May PMI data released
📈 Market analysis:
In the short term, the double high points above the gold price are suppressed at the 3365 line. The MACD indicators at the 4H and daily levels tend to form a golden cross, releasing bullish signals. In the short term, if you want to confirm a unilateral upward trend, you need to break through the 3365 line. Despite the strong bullish signals, as I just reminded you, the current technical indicators are close to overbought areas, and I still think there is a certain risk of a correction. In the European session, I will consider trying to short at the 3355-3365 line, and pay attention to the short-term support at 3340-3330 line below. Later, after the price gets some support at the support level, we can consider long trades.
🏅 Trading strategies:
SELL 3355-3365
TP 3340-3330-3320
If you agree with this view, or have a better idea, please leave a message in the comment area. I look forward to hearing different voices.
OANDA:XAUUSD FX:XAUUSD FOREXCOM:XAUUSD FXOPEN:XAUUSD TVC:GOLD

6/2 Gold Analysis and Trading SignalsGood evening, traders!
Gold surged more than $70 today, reaching an intraday high of 3363.
If you held short positions from last Friday’s close based on my plan, I hope your SL protected you from major losses.
📉 Technical Insight:
The rapid rally has triggered overbought signals and correction pressure
Watch for pullback support levels at:
3342
3328–3321 zone
If these hold, price might retest 3400 tomorrow
🎯 Trading Plan:
📉 Sell around 3360–3372 (with tight stop)
📈 Buy near 3328–3318 (if price stabilizes)
🔁 Scalp zones:
3332 / 3338 / 3343 / 3352 / 3366

gold on sell retrace#XAUUSD price have been bullish since tension increases, now price is trying to correct before any further movement.
Firstly we await price to fall below 3341 to sell, Target 3331-3317. Stop loss 3357
Any further breakout above the 3366 will form a strong bullish which will reach 3390-3420

XAUUSD | 1h BearishGold (XAUUSD) 1H Analysis
Currently, gold is showing signs of a potential bearish reversal from a key supply zone. Price tapped into the previous high and reacted with strong rejection, suggesting weakening bullish momentum. This area aligns with a clear zone of interest, where sellers previously stepped in, adding confluence to our bearish bias.
The structure has been respected so far, and price has now broken below the minor trendline support, which previously acted as dynamic support for this bullish leg. A pullback to retest this broken structure or the imbalance zone just above could provide an optimal entry for further downside.
The trade idea is built on a potential shift in market structure:
A double top internal structure formation is visible at the recent high, indicating exhaustion in the uptrend.
Price is expected to push lower, targeting TP1, which sits at the previous strong support zone and aligns with the internal structure break.
Further continuation to the downside could take price toward the 0.5 FIB retracement level and PDL (Previous Day Low)—both strong liquidity areas.
We are anticipating a reaction from these lower zones. If bullish momentum reappears there, it may offer a chance to reposition for long setups later. For now, the bias remains bearish while price holds below the supply zone and structure confirms.

Gold 1D timeframe. What Next Moment?Hello everyone, I am back after 3 years. Finally I have decided to continue my trade journey in forex and crypto professionally.
Here is the analysis of XAUUSD/Gold.
Gold has taken a big bold moment of Uptrend since strong resistance breakout on march of 1st, 2024. Since that time Gold didn't looked back & continued it's rally in uptrend. So our major trend is Uptrend in 1D and 4H timeframe. Gold did some downtrend and sideway rally and again took another uptrend rally on Dec of 18th, 2024. Gold break all top high and made new high 3500.
If I talk in 1D timeframe gold is trading in bullish flag, and I am not wishing it right now to break upward. But has you know it is gold anything can happen. While today is Monday and market opening was in gap. So it needs to fill the gap after that we can execute a trade. Still now needs some confirmation that it will come down. So have patience and watch the market carefully.
Key point.
Resistance - 3356, 3369, 3396
Support - 3343, 3323, 3304
Any Query Reach Us or comment down
Rudra Vasaikar Wishes You A Great And Very Amazing Trading Life. Trade Safe, Trade Right.
RISK WARNING 🔴 🔴 🔴
There is high risk of loss in Trading Forex, Crypto, Indices, CFDs, Features and Stocks. Choose your trade wisely and confidently, please see if such trading is appropriate for you or not. Past performance is not indicative of future results. Highly recommended - Information provided by Pro Trading Point are for Educational purpose only. Do your investment according to your own risk. Any type of loss is not our responsibility.
HAPPY TRADING.
#gold #xauusd #xauusdtrading #goldtrading #goldanalysis #forextrading #forex #trendline #goldsignals #goldnews goldlatestanalysis #xauusdtradesetup #forextradingguide #fxgold

XAUUSD:BUYAfter the good news came out. XAUUSD followed my expectations. Continued to rise above 3300. The current quotation is 3317.
The tariff issue was released again over the weekend. Inflation fermented again, and the Russian-Ukrainian negotiations reached a tense and uncertain stage again.
Traders who followed me to buy near 3290 successfully made good profits.
Trading reference
XAUUSD:
Pressure position: 3360-3350
Support position: 3305-3295
BTCUSD:
Pressure position: 107000-106000
Support position: 103000-102000
This week, there is the impact of the release of non-agricultural data.
Usually divided into the front, middle, and back end of the triple impact. For traders, every time is a good trading opportunity. The impact is also very large.
This week, we will focus on the impact of news and the stimulation of news to layout the wonderful transactions of XAUUSD and BTCUSD. Remember not to trade independently to avoid losses. If you have any ideas, remember to leave a message to me and my assistant.

Is the positive news fading? The latest analysis of gold📰 Impact of news:
1. The conflict between Russia and Ukraine breaks out again, exacerbating the uncertainty of the situation
2. The tension in the Middle East continues, Iran claims to be ready to defend its airspace at any time, and the Houthi armed forces attack Israeli airports
3. May PMI data released
📈 Market analysis:
As geopolitical conflicts between Russia and Ukraine and the Middle East broke out again over the weekend, gold jumped higher today. From a technical perspective, the 1H chart shows a bullish arrangement, but the gold price is in a downward channel at the daily level. The gold price is currently near the middle track of the Bollinger Band and is obviously suppressed by the downward channel. The 4H level Bollinger Bands narrowed, the moving averages adhered, the long and short positions were in a stalemate, and the MACD indicator hovered around the 0 axis. 3330 - 3335 above is the key resistance area. If it breaks through 3340, it is expected to continue to see new highs. At the same time, there is short-term support in the 3285-3280 range below. 3270 - 3265 becomes the key important support. If it falls below, it may fall to 3245. For short-term operations in the Asian and European sessions today, if the resistance area of 3325-3335 cannot be effectively broken through, you can consider shorting and look towards 3310-3290 in the short term.
🏅 Trading strategies:
SELL 3325-3335
TP 3310-3290
If you agree with this view, or have a better idea, please leave a message in the comment area. I look forward to hearing different voices.
TVC:GOLD FXOPEN:XAUUSD FOREXCOM:XAUUSD FX:XAUUSD OANDA:XAUUSD

Here's a weekly buy-side analysis🟢 Bias: Bullish (Buy)
Gold remains in a long-term uptrend, with fundamental and technical factors supporting continued upside.
50 & 100 EMA: Price is well above both EMAs, confirming bullish momentum.
RSI: Around 60–70 on the weekly; no bearish divergence yet.
MACD: Histogram ticking upward with bullish crossover in play.⚠️ Risk Factors
Sudden USD strength due to surprise Fed hawkishness.
Strong U.S. labor or inflation data that pushes bond yields higher.
Gold profit-taking near ATH could cause sharp but temporary pullbacks.

GOLD H1 Chart Update For 2 June 25As you can see that there are some important zones mentioned on the chart
First read all details carefully market is in sideways for now once market will break 3330 level then it will move further higher towards 3360 even 3370
3300 Psychological Remains in focus once market breaks 3300 then it will try to fill the OPENING GAP which is due on 3289
for today if market sustains below 3280 level then it will move towards 3240-50 zone
Scalping or shorter term range in 3295-3320
Remember always use SL
Disclaimer: Forex is Risky

The volatility is an illusion, and gold is brewing major changesGold fluctuated downward in the Asian session on Friday, while it remained in the range of 3287-3303 in the European session. Although it tried to break through the short-term pressure level of 3300-3306 many times, it has never been able to stand firmly. I arranged to go long at 3288-3289 in advance, notified to enter the market at the point, and finally reached the target of 3303 perfectly, earning 15 points of profit! Quick, accurate and ruthless, with the right idea, profit-taking is as easy as drinking water! Therefore, it is recommended that we continue to pay attention to the short-term support of 3290-3285 below. If the price fails to break through the support range like in the early trading, you can consider trying to enter the long position.
Given that today is Friday, the market volatility may be "demon-like", so you need to be extra cautious in operation and pay close attention to the changes in the market. At the same time, you must keep in mind the principle of "taking profits for safety"-lock in profits in time when you can see them, and don't easily bet on trends that you don't understand. If your current gold operation effect is not ideal, I hope my analysis can help you avoid some detours. Welcome to communicate at any time!
Today, the monthly, weekly and daily lines closed simultaneously. At the same time, the PCE data will be released during the US trading session, and the market volatility may intensify.
From a technical point of view, 3285 is also the key to long and short today. If gold does not break 3285 today, the strength of gold bulls is expected to continue, and there is still room for gold to move upward. If gold continues to fall and falls below 3285, then gold may begin to fluctuate in a large range. The upper resistance is in the 3320-3330 area, and the focus is on the 3335-3340 line of suppression. Pay attention to the 3290-3285 line of support below, and the key position below is in the 3280 area. If it breaks below the 3280 area during the day, the market is expected to fall again to the 3265-3250-3240 area.

Bearish Trend Likely on MondayLast week, the U.S. once again carried out a wave of long-short double killing on the issue of tariff suspension 📉. Capitalists successfully carried out capital plundering before the end of last Friday, leading to insufficient bullish momentum at the opening of next week and a possible continued downward trend ⬇️. At the opening on Monday, our primary view is bearish
⚡️⚡️⚡️ XAUUSD ⚡️⚡️⚡️
🚀 Sell@ 3290
🚀 TP 3270 - 3260
🚀 Buy@ 3250 - 3260
🚀 TP 3290 - 3310

There remains significant overhead resistance.The gold price declined on Friday while the US dollar rose. The market has digested the latest development of the tariff issue, and a relatively weak inflation report has kept the hope of a US interest rate cut alive. Spot gold was quoted at $3,290.40 per ounce, down 0.82%, with a weekly decline of over 2%. After the federal appellate court temporarily restored Trump's tariffs on Thursday, the tariff issue is likely to regain its influence on the market next week. Additionally, Federal Reserve Chair Jerome Powell will deliver the opening remarks at an event next Tuesday, which will be his first speech since his meeting with Trump this week. Meanwhile, several Federal Reserve officials will also speak next week. Therefore, the rebound of gold will be under pressure next week. It is advisable to sell gold on rallies below $3,310. The outlook is bearish, with a downward correction expected. The target price is between $3,270 and $3,260. When the price pulls back to the vicinity of $3,270 - $3,260, investors can consider going long.
Humans need to breathe, and perfect trading is like breathing—maintaining flexibility without needing to trade every market swing. The secret to profitable trading lies in implementing simple rules: repeating simple tasks consistently and enforcing them strictly over the long term.
Trading Strategy:
sell@3295-3305
TP:3265-3275

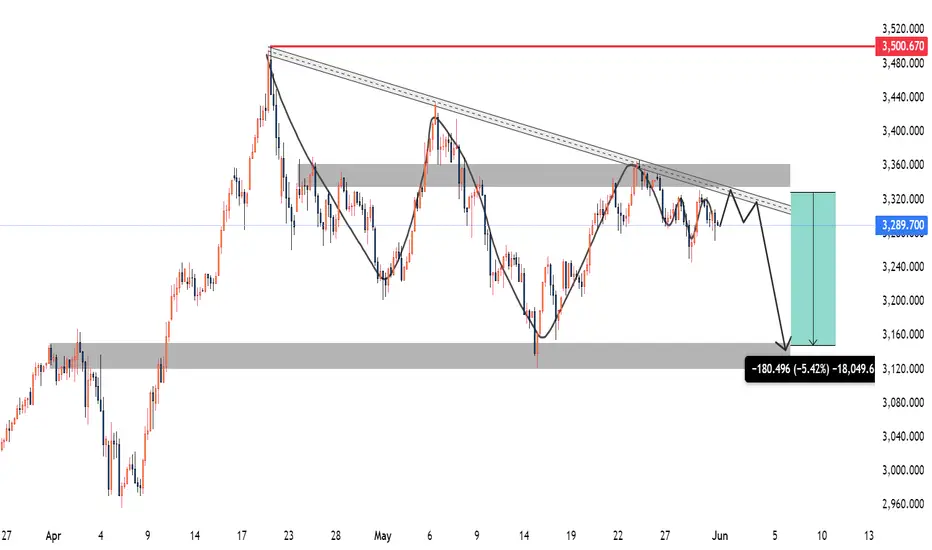
Gold XAUUSD Weekly forecast 2-6 June 2025Observations:
Price has been respecting a clear descending trendline since late April, with multiple touches and rejections.
A significant supply zone around the 3,330 level aligns with the trendline resistance, increasing confluence for a potential reversal.
The market has formed lower highs consistently, suggesting bearish pressure is building up.
A horizontal demand/support level around 3,125 (previous swing low) is the primary target in case of a bearish breakout.
Volume and structure suggest distribution, further supporting bearish continuation.
Bearish Scenario:
If the price retests and rejects the 3,330 resistance level again next week, especially with a wick rejection or bearish engulfing candle:
Expect downside continuation toward 3,125, aligning with a ~1500 pip target.
This move would represent a ~5% drop from current levels.
Trading Plan / Signal:
Sell Setup:
Entry Zone: Between 3,320 – 3,330 (upon bearish confirmation e.g., bearish engulfing or shooting star)
Stop Loss: Above 3,350 (just above trendline and invalidation zone)
Take Profit 1 (TP1): 3,250
Take Profit 2 (TP2): 3,200
Take Profit 3 (TP3): 3,150/25
Risk–Reward Ratio: Approximately 1:3+
Invalidation:
Clean breakout and retest above 3,350 would invalidate the setup and may suggest a reversal toward 3,500.
Fundamental Consideration:
No major geopolitical or macroeconomic shocks should occur to maintain this bearish bias. Any high-impact news could cause volatility, so monitor the economic calendar closely.
Please follow, like, comment and share.
Gold Channel Rejection ZoneGold (XAUUSD) remains in a strong long-term uptrend, respecting a well-defined ascending channel on the weekly timeframe. Price is currently testing the upper boundary of this channel, suggesting potential exhaustion near the resistance zone.
A bearish rejection from this area could trigger a corrective move toward the lower boundary of the channel, aligning with a healthy pullback in an overall bullish structure. The chart also highlights a clear risk-to-reward setup, with a stop loss positioned above the recent highs and a target toward channel support.
As long as price remains below the channel top, downside pressure is likely in the incoming weeks. A confirmed breakout above the channel, however, would invalidate the bearish move and signal continuation of the bullish momentum.
Stop loss: 3443
Take profit: Around 2895 ( EMA 200 Daily )

Trade Idea:XAUUSD SHORT ( SELL STOP )🔍 Multi-Timeframe Analysis
📉 H4:
• Price is compressing below the 20 and 50 SMAs.
• Recent attempts to break higher failed to sustain; MACD is slightly bearish, hinting momentum is fading.
• Consolidation after the big push suggests potential for another leg down if support breaks.
🕒 M15:
• Strong bounce into resistance, now stalling at the underside of the previous structure (~3315–3320).
• 20 SMA is curling down and converging with the 50 SMA, signaling a potential momentum shift.
🕒 M3:
• Price just lost short-term bullish structure after failing to break 3318.
• Flattening and slight downward curl in the 20 SMA.
• Volume shows a slowdown on the bounce and heavier selling earlier in the day — signs of weakness.
⸻
✅ Trade Idea
Type: Sell Stop
Entry: 3308
Stop Loss: 3322
Take Profit: 3273
———
🧠 Why This Setup Works
• This is a momentum breakdown trade: placing a sell stop just below short-term support (3308) to catch the shift in momentum if price breaks lower.
• Price already rejected the high around 3318; if it pushes below 3308, it confirms that sellers have taken back control.
• There’s clean room down to 3273 — a previous reaction zone and recent demand level — offering a good risk-to-reward.
⸻
🛡️ Risk Management & Execution
• SL to BE Rule: Move stop loss to break-even once price reaches 3293 (15 points in your favor, 1R). That’s the halfway point to target and right above a small reaction zone that could cause a pullback.
• Invalidation Window: If price moves above 3325 before activating entry, cancel the trade idea. That would invalidate the lower-high structure and suggest momentum has shifted bullish again.
⸻
⏱️ Session Timing & Considerations
• NY session opens at 6:30 AM Pacific (PT).
• Ideally, this trade should activate and move by pre-New York to early NY session. If price stalls or consolidates near the entry level for too long into the session (after 9:30–10:00 AM PT), consider canceling or reassessing.
FUSIONMARKETS:XAUUSD

5/30 Gold Analysis and Trading SignalsGood morning everyone!
Yesterday, we successfully executed short at 3290 and long at 3250, and also entered the 3316–3328 short zone near the close. All signals were hit, and profits were solid ✅.
📉 Technical Outlook:
The 1-hour chart remains in a clear bearish trend, indicating that this pullback is not yet complete.
Initial support at 3296 is very likely to break
Focus shifts to 3278 support, though it appears technically weak
If price hits 3278, a minor bounce is expected, but it's likely just a retracement, not a reversal
🗞 Fundamental Watch:
The U.S. Consumer Confidence Index will be released during the U.S. session today.
Market reaction is expected to be similar to yesterday’s initial jobless claims — possibly triggering short-term moves, but not changing the broader trend.
📈 Trade Plan for Today:
📉 Sell in the 3316–3328 zone (key resistance)
📈 Buy in the 3238–3221 zone (key support area)
🔁 Scalp/flexible trading zones:
3303 / 3288 / 3276 / 3265 / 3252 / 3238
Stick to proper risk management, and stay alert during U.S. data releases.
Trade with the trend and close the week strong!
Additionally, on the 30-minute chart, gold appears to be forming a potential inverse head and shoulders pattern. If this pattern completes and breaks the neckline successfully, the price may surge toward the 3336–3352 area, or even up to 3360.
For those considering short positions, it’s crucial to control position size and avoid entering too early. Try to wait for price action to reach higher resistance levels before making a move. Don’t worry about missing a perfect entry — even if one trade is missed, it won’t affect your overall profitability for the week.
The market always offers opportunities. Stay calm, stick to your strategy, and remember: consistency and patience lead to long-term success.

It seems calm, but there are actually undercurrents!Today, the monthly, weekly and daily lines closed simultaneously. At the same time, the PCE data will be released during the US trading session, and the market volatility may intensify.
From a technical point of view, 3285 is also the key to long and short today. If gold does not break 3285 today, the strength of gold bulls is expected to continue, and there is still room for gold to move upward. If gold continues to fall and falls below 3285, then gold may begin to fluctuate in a large range. The upper resistance is in the 3320-3330 area, and the focus is on the 3335-3340 line of suppression. Pay attention to the 3290-3285 line of support below, and the key position below is in the 3280 area. If it breaks below the 3280 area during the day, the market is expected to fall again to the 3265-3250-3240 area.

XAUUSD SHORTThis chart appears to be a technical analysis setup for **Gold (XAU/USD)** on the **15-minute timeframe**, using **Heikin Ashi candles**.
Here's a breakdown of what’s visible:
### **1. Price Action:**
* The chart is trading within a **descending channel** (highlighted by the dotted white trendlines).
* **Resistance levels** are marked at:
* 3366.015
* 3331.470
* **Support zone** around: 3245.560
* The price is currently around **3291.690**, testing the lower region of a recent consolidation zone or distribution area.
### **2. Indicators:**
#### a. **RSI (Middle Panel):**
* RSI is around **41.552**, suggesting mild bearish momentum but not yet oversold.
* RSI is not giving a strong divergence signal at this moment.
#### b. **MACD or Custom Oscillator (Bottom Panel):**
* Appears to be a custom oscillator with histogram + signal cross system.
* Red and green dots possibly indicate buy/sell signals.
* Currently showing **bearish pressure** as histogram and signal lines are below zero with red dots (sell signal confirmation).
### **3. Trade Setup:**
* The red and green box overlay suggests an **active short trade** setup:
* Entry near **3291.690**
* Stop-loss zone near **3331–3335**
* Take-profit zone extending well below **3245**, likely near **3188.498–3189.980**
### **4. Signal Arrows (Blue Up / Red Down):**
* These are likely part of an indicator marking **swing highs/lows or reversal points**.
* More red arrows recently suggest bearish short-term sentiment.
---
### 🧠 **Interpretation:**
* The chart shows a **bearish bias** with a short position in play.
* Price is within a downward channel and rejected the resistance area.
* Oscillators and RSI support further downside unless a strong reversal occurs.

Gold Poised for a Breakout After Sideways ConsolidationGold has retraced to the 3300 level and remained range-bound for an extended period. This prolonged consolidation suggests that a sharp breakout may be imminent, with the next move — whether up or down — likely to be swift and volatile.
Looking at the 2-hour chart, the current price structure is complex. It could be interpreted as a potential double top, but it also resembles the early formation of an inverse head and shoulders, which makes trading decisions more challenging.
From a technical standpoint:
Moving averages are aligned in a bearish setup, and the area above remains densely packed with resistance.
MACD on the 2H chart shows a bearish crossover, signaling a potential continuation of the downtrend.
However, on the 30-minute chart, MACD shows some short-term bullish momentum, with the next resistance near 3306.
For bulls, if the price attempts to rise toward the 3306–3312 zone but then quickly pulls back, this would indicate weak buying pressure, and caution is advised.
In summary, short-term signals are bullish, but the medium-term trend remains bearish. With the market in a sideways range, it's best to remain patient and watch for breakout signals. The two trading opportunities shared yesterday remain valid and worth monitoring closely.

Gold 1M & 15M Bearish Breaker Block Setup, Targeting 3,202 ZoneI’ve marked a bearish breaker block on the 1-minute chart (3,316–3,319), also visible on the 15M timeframe.
✅ Last bullish push before the sharp downside breakout.
✅ Price retested this zone, wicked through it, and then sold off aggressively — reinforcing bearish order flow and the potential for deeper downside.
I’m tracking this move as the final C wave of an ABC corrective pattern.
✅ The C wave started from the 3,319 high and is unfolding in a 5-wave substructure.
✅ 1-Minute breaker block around 3,316–3,319 — I’m watching for rejection here, which aligns with the 0.618 Fib retracement as an estimated end of wave 2.
✅ My current expectation: wave (3) and (5) of C could extend lower to the 3,256–3,202 zone.
🧩 Key Confluences:
Bearish breaker block rejection
15M downtrend structure remains intact
#XAUUSD #gold #forex #elliottwave #bearishbreakerblock #orderflow #priceaction
