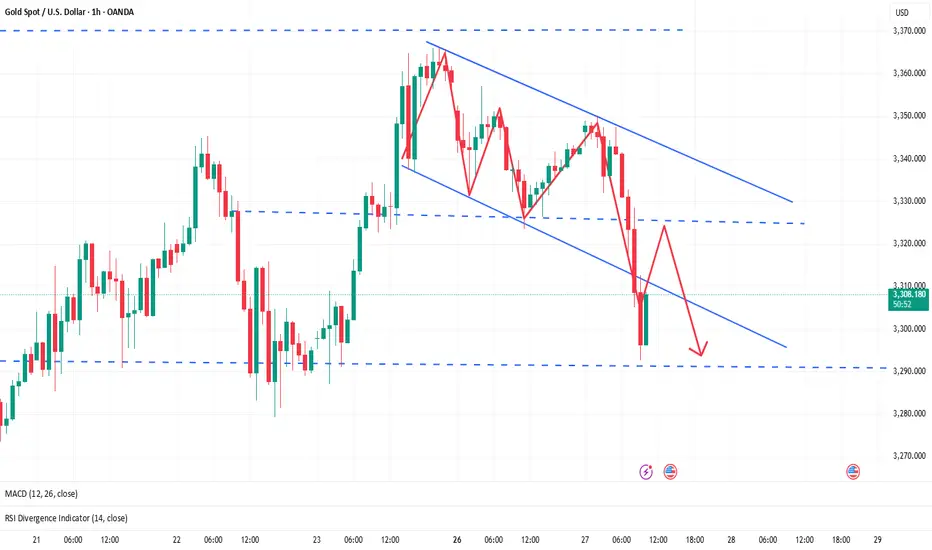
GOLD Will Keep Falling!
HI,Traders !
GOLD is going down
Now and the pair broke
The rising support line
Made and is going
Down again now so we are
Bearish biased and we will
Be expecting a further
Bearish move down !
Comment and subscribe to help us grow !
Xauusdshort

3300 becomes the dividing line between long and short positions🗞News side:
1. The situation in the Middle East and between Russia and Ukraine has escalated again
2. Pay attention to the opening of US stocks today
📈Technical aspects:
Good morning, bros. Gold is currently testing the important support of 3300. Once it falls below 3300, it can be officially confirmed that the correction trend is coming. Today's opening of the U.S. stock market is critical. If the U.S. stock market opens higher, it is very likely to pull down gold prices. The stable operation suggestion for the day is to go long when it retreats to 3295-3290, and then rely on the upper side of the previous low point for protection, that is, look at the vicinity of 3325-3330. If it encounters resistance and pressure near 3330-3340, you can consider entering a short position and continue to be bearish. At present, the first focus below is the support of 3290-3280. If it continues to fall, it may touch the 3266 line.
If you agree with this view, or have a better idea, please leave a message in the comment area. I look forward to hearing different voices.
OANDA:XAUUSD FX:XAUUSD TVC:GOLD FXOPEN:XAUUSD FOREXCOM:XAUUSD
trap ya “liquidity grab” jaisa zone ho sakta hai.Jahan sab buyers wave 5 ko continuation samajh ke buy karein,
Tumhara analysis keh raha hai ki wahan se reversal hoga.
Ye trap ya “liquidity grab” jaisa zone ho sakta hai.
Chart me price ne 5 wave ka bullish pattern complete kiya.
Ab wo Supply Zone me hai jahan se girne ke chances hain.
Tum expect kar rahe ho BOS ke saath downtrend shuru hoga.
Final target lower demand zones tak hai.

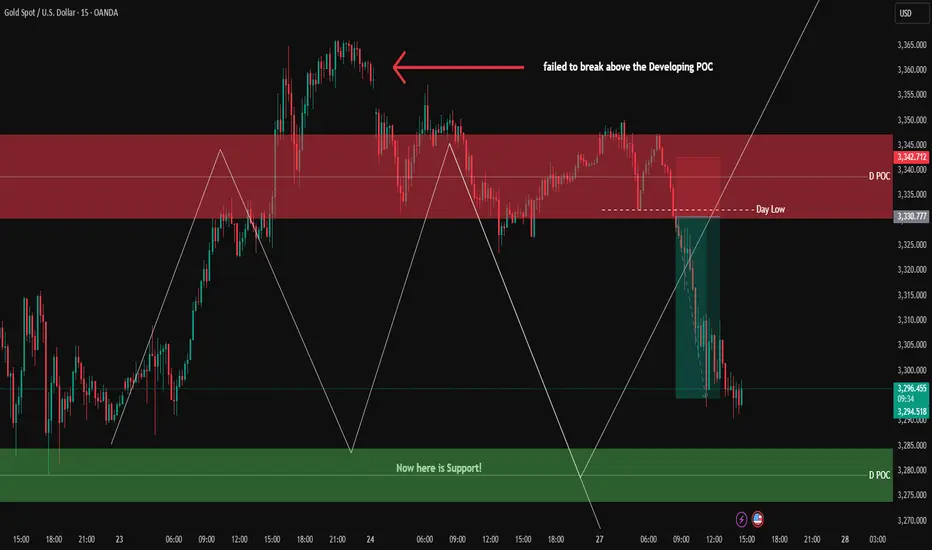
XAUUSD Update – 1H Confirmation/ 15 min Chart/ 3min Sell SetupGold failed to break above the Developing POC resistance and is now pulling back toward the demand zones marked on the chart.
At 3331.8, we entered a short position after the day's low was swept on the 3-minute timeframe, combined with our entry confirmations — resulting in a clean 1:3 R:R ✅
Now we’re waiting for price to reach the demand zones. If we get confirmation on lower timeframes, we’ll be looking to enter a long position.
🔔 The deeper price pulls into the lower demand zones, the better the long setups become, allowing us to consider increasing our risk from 1% to 3%, given a solid setup and momentum.
🔍 Insight by ProfitaminFX
If this outlook aligns with your bias, or if you see it differently, feel free to share your perspective in the comments. Let’s grow together 📈
gold on sell#XAUUSD price have reached the max decline base on past price movement and now we wait for breakout below the low to keep selling.
Below 3292.6 have bearish continuation which will target between 3285 for bullish reverse or a drop below 3281 will keep falling till 3270. SL 3306
The bullish range needs a long candle to confirm.

XAUUSD Analysis todayHello traders, this is a complete multiple timeframe analysis of this pair. We see could find significant trading opportunities as per analysis upon price action confirmation we may take this trade. Smash the like button if you find value in this analysis and drop a comment if you have any questions or let me know which pair to cover in my next analysis.

5/27 Gold Analysis and Trading SignalsGood afternoon everyone!
Yesterday, gold fluctuated within the flexible trading zone, and we only executed a long entry near 3323, which brought decent profit.
Today, gold opened with an upward move toward 3350, but quickly pulled back. The recent market shows a sideways consolidation, with the $3340 level acting as a key pivot zone:
Below 3340: dense support areas
Above 3340: resistance clusters
In this context, any breakout without strong momentum can easily lead to capital flow shifts, causing false breakouts or rapid pullbacks, making trend continuation more difficult.
📉 Technical View:
On the 30M chart, bearish momentum slightly outweighs bullish, and gold is likely to remain range-bound within the zone defined yesterday.
🗞 Fundamental Reminder:
There are a few important U.S. economic releases during the NY session. Watch closely to see if they provide a clear directional push.
📈 Today’s Trading Plan:
📉 Sell in the 3366–3386 zone (resistance area)
📈 Buy in the 3278–3256 zone (support zone)
🔁 Flexible intraday levels to monitor:
3353 / 3341 / 3334 / 3317 / 3309 / 3296 / 3284
Trade with flexibility, beware of fake breakouts, and focus on NY session data-driven opportunities. Let me know if you have questions — good luck and happy trading!

Gold Trading Strategy for the 27thOn the 4-hour chart today, the bullish trend of gold remains intact ⭐️✨📈 ⚠️📉
The current price is facing resistance at 3365 near the previous high. Due to the excessive release of early bullish momentum, a period of adjustment is usually required 📉
However, with further news-driven stimuli this week, gold may still surge sharply 🚀
The key lies in the morning session's trend, so timing is crucial when judging the strength of bulls and bears ⏰
It is expected that gold will continue the pattern of oscillating upward movement, and pullback opportunities can be captured 📈
Resistance is at 3365, and support is at the 3320 level 🔍
Long Position Strategy:
If the gold price retracts to the 3320-3325 range, consider opening a long position 📊 Set the stop-loss at 3317, with targets at 3340-3350 🎯
If the price holds above 3320, try opening a long position 🌟 The initial target is 3345, and if 3345 is successfully broken through, further targets will be 3350-3360 ⚡️
Short Position Strategy:
When the price rises to the 3360-3365 range, try opening a short position ⚠️ Set the stop-loss at 3370, with targets at 3340-3330 📉
Gold Trading Strategies
sell@3360-3365
tp:3330-3340
buy@3320-3325
tp:3350-3360
Professional trading strategies are pushed daily 📊
Lock in precise signals amid market fluctuations 🚀
Confused about market trends? Stuck in strategy bottlenecks?
Real-time strategies serve as your "trading compass" 🌐
From trend analysis to entry/exit points, dissect market logic comprehensively
Refer now 📲
Help you move steadily forward in investments ✨
👇👇👇

Gold Pullback as Expected, Range Trading ContinuesAs I clearly stated last Friday, key resistances are located at 3366 and the stronger zone between 3376–3391. On Friday, the price peaked near 3366 without touching the second resistance band, followed by a pullback — a natural result of recent buying pressure being released and previous trapped positions being closed out.
🎯 Congratulations to those who carefully followed and executed the strategy — you should have captured solid profits from this retracement!
🔍 Current Technical Outlook:
✅ A wave of selling has already been absorbed. Now we watch:
Support strength — if key levels hold, scalping on dips remains valid;
Rebound momentum — short-term indicators favor a bounce, though medium-term structures are still being repaired;
Focus zone: 3355–3357 is a newly created gap resistance, critical for today’s action;
Previously broken supports (3346–3338 and 3324–3318) now serve as resistance and should be watched during any upside attempt.
📈 Trading Strategy:
Today’s price range is relatively contained — stick to selling near resistance, buying near support. If there are any major changes or new developments, I’ll update everyone in time.

Gold fluctuates at high levels, long and short profit ideas
📌 Driving events
On Sunday, U.S. President Donald Trump announced that plans to impose 50% tariffs on the European Union would be postponed until July 9, easing concerns about an imminent escalation in trade hostilities. This development reduced immediate risk aversion in the market, putting pressure on gold prices.
Nevertheless, investors' attention now turns to the FOMC minutes released on Wednesday, which may further clarify the Fed's monetary policy outlook. At the same time, market participants will continue to pay attention to trade negotiations between the United States and Japan and other major economies. Any new tensions or setbacks in these negotiations could quickly restore demand for gold as a protective hedge.
📊Comment Analysis
Gold prices fell slightly after the official announcement of the tariff extension and continued to climb
💰Strategy Package
🔥Selling area: 3388-3390 SL 3395
TP1: $3376
TP2: $3363
TP3: $3350
🔥Buying area: $3301-$3299 SL $3294
TP1: $3312
TP2: $3325
TP3: $3338
⭐️ Note: Labaron hopes that traders can properly manage their funds
- Choose the number of lots that matches your funds
- Profit is 4-7% of the capital account
- Stop loss is 1-3% of the capital account

5/26 Gold Trading SignalsGood afternoon everyone!
I just returned from a weekend trip and apologize for the late update today — thank you all for your patience and continued support!
Gold has shown mild downward movement in a one-sided consolidation pattern today. This is a technical pullback after reaching a key resistance zone, reflecting selling pressure at higher levels. Today is Memorial Day in the U.S., which explains the low volatility and reduced trading volume.
🔎 Technical Outlook:
Once gold reached around 3360, it entered a significant resistance zone. If bulls intend to maintain the current uptrend, then the support around 3272 will be a critical level during this pullback. Before that, we should also keep an eye on 3322, 3318, and 3298.
On the 2-hour chart, a bearish divergence has formed, which needs to be resolved, possibly through sideways consolidation or a further pullback.
🗞 Fundamental Outlook:
The news is relatively quiet today, but important economic data and speeches will begin tomorrow, which may trigger larger market moves.
📈 Today’s Trading Plan:
📉 Sell in the 3352–3368 zone (resistance area)
📈 Buy in the 3292–3272 zone (support zone)
🔁 Flexible intraday levels to watch:
3348 / 3332 / 3323 / 3312 / 3305 / 3296
Stay flexible and manage risk accordingly. If you have any questions or want to discuss your trading strategy, feel free to reach out. Wishing everyone a smooth and profitable session!

Here is the trend of gold prices in the next three weeks!The hourly level trend indicates that the current support position is 3310-3320. And it is the retracement position after the downward trend is broken. It is also a small retracement point after the rebound.
At present, the news trend is basically mixed, offsetting each other. However, in the following period, the growth of risk aversion will boost the rise of XAUUSD, and geopolitics is also an important influencing factor.
Short-term buying opportunities are considered at 3325-3300. The short-term target focuses on the pressure of 3375-3400.
Remember the core of swing trading. Follow the wave of trading. Do not trade independently to avoid losses. If you are not sure about the trading opportunity. Remember to leave me a message in the swing trading center.
Gold Eyes Breakout or Breakdown: All Eyes on PCE and FOMCTVC:GOLD OANDA:XAUUSD Gold (XAU/USD) surged above $3,350 last week, boosted by safe-haven flows following Moody’s downgrade of the U.S. credit rating and rising geopolitical tensions. Concerns over U.S. debt sustainability, weak dollar sentiment, and renewed trade risks kept investor demand for gold elevated.
Technically, gold is currently trading within an ascending channel. Price is now hovering near a key resistance zone around $3,364, while the $3,324 breakout level below may act as pivotal support. A pullback below this level could expose downside risk toward the lower channel boundary. Meanwhile, a sustained break above resistance may invite further bullish momentum toward $3,400.
This week, attention turns to key U.S. data including FOMC minutes, Q1 GDP, and the Fed’s preferred inflation gauge — core PCE. Any upside surprise in inflation may weigh on gold, while geopolitical headlines and fiscal uncertainty are likely to continue supporting the upside.
Resistance : $3,364 , $3,400
Support : $3,324 , $3,315

Gold bulls advance as expected Mainly go long on pullback.Today, gold opened lower and fell, reaching the lowest level of 3331. Then the bulls exerted their strength, reaching the highest level of 3356 and then adjusted back. The overall trend was highly consistent with the expected judgment. Looking back at the market last week, the technical side of gold continued the bullish pattern, and the oscillating upward trend was significant. From the daily level, the price repeatedly tested around the 3200 mark at the beginning of the week, and finally stabilized successfully, laying a solid foundation for the bull market. On Friday, it was supported by the 3280 mark, continuing the strong oscillating upward trend, forming a reverse middle Yang pattern, and the daily K line closed with an oscillating upward break of the middle Yang, fully demonstrating the short-term bullish pattern of gold prices, and bullish expectations continued to heat up.
Based on the current gold trend analysis, the focus below is on the 3330-3320 range support, and the focus above is on the 3380-3400 resistance. In terms of overall strategy, the bullish thinking is maintained before breaking 3320 to avoid blindly guessing the top.

XAUUSD While the GBPJPY trade is still active, I’ve also spotted a new opportunity on XAUUSD and have entered a sell position. I'm sharing the trade here for traders who may want to take it as well.
🔍 Trade Details:
✔️ Timeframe: 15-Minute
✔️ Risk-to-Reward Ratio: 1:1 / 1:1.50
✔️ Trade Direction: Sell
✔️ Entry Price: 3329.64
✔️ Take Profit: 3324.68
✔️ Stop Loss: 3334.59
🔔 Disclaimer: This is not financial advice. I’m simply sharing a trade I’ve taken based on my personal trading system, strictly for educational and illustrative purposes.
📌 Interested in a systematic, data-driven trading approach?
💡 Follow the page and turn on notifications to stay updated on future trade setups and advanced market insights.

How to plan for gold price box fluctuations🗞News side:
1. The situation between Russia and Ukraine escalated again
2. Israel in the Gaza Strip was once again criticized by the international community
📈Technical aspects:
After gold opened lower today, it fell into a small box-shaped shock in the short term. It seems that the situation in Russia and Ukraine and the Middle East over the weekend did not have further impact on the gold price. The gold daily level closed with a positive line again, injecting new vitality into the trading space last week. These two rounds of rise not only successfully crossed the resistance level of 3250 last Monday, but also further broke through the suppression of 3320, showing a clear upward trend. The current volatility is more like a correction after breaking through the previous high! Last Friday, the price failed to break through the 3370 line several times and encountered resistance continuously, which shows that the pressure from above is still relatively strong! Due to the particularity of today's market trading, the technical side of the hourly chart shows a downward trend. The European session temporarily focuses on the 3350-3355 line resistance, and the 3330-3320 support is seen below.
If you agree with this view, or have a better idea, please leave a message in the comment area. I look forward to hearing different voices.
FOREXCOM:XAUUSD FXOPEN:XAUUSD TVC:GOLD FX:XAUUSD OANDA:XAUUSD

Will Trump's Tariffs Propel Gold Past 3,500 ? Again ? On May 23rd's U.S. trading session, Trump's tariff announcements on the EU and Apple roiled markets like a tempest 🌪️. He proposed a staggering 50% tariff on EU products starting from June 1st, citing unfair trade practices. Meanwhile, he threatened Apple with a 25% tariff if iPhones sold in the U.S. weren't manufactured domestically.
This sent gold prices soaring sky - high 🚀. As a reliable safe - haven, gold spiked as investors, deeply worried about the potential global economic impacts, rushed to safeguard their wealth. The 3280 support level for gold, which had been holding firm in the preceding days, became even more crucial as the upward momentum strengthened, like a sturdy anchor in stormy waters ⚓.
If the tariff issue remains unresolved and tensions continue to simmer between the U.S., the EU, and major corporations like Apple, the upward trajectory of gold prices is likely to persist. Analysts predict a good chance it could break the 3,500 mark, as if a new peak is waiting to be conquered 🏔️. Tariffs disrupt global supply chains and raise U.S. inflation fears, driving investors to gold for protection against economic and currency risks, much like sailors seeking a safe port in a typhoon 🌊.
⚡️⚡️⚡️ XAUUSD ⚡️⚡️⚡️
🚀 Buy@ 3340 - 3360
🚀 TP 3400 - 3450
Accurate signals are updated every day 📈 If you encounter any problems during trading, these signals can serve as your reliable guide 🧭 Feel free to refer to them! I sincerely hope they'll be of great help to you 🌟 👇

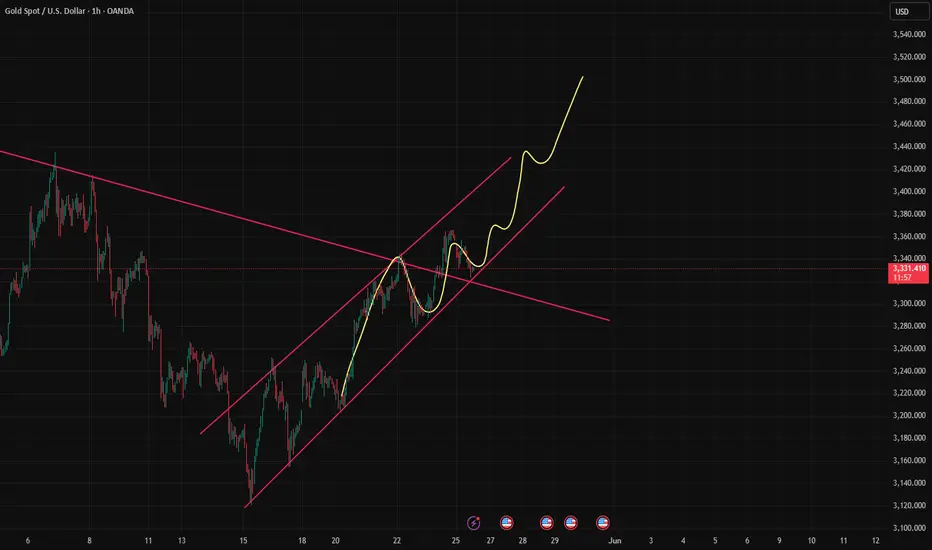
GOLDHello friends
Given the sharp upward movement we had, the price is now forming a flag pattern, and if this pattern is completed, we can wait for a new high.
*Trade safely with us*

Trump's tariffs roiled markets; gold roseOn the U.S. trading session of May 23, Trump's tariff remarks on the EU and Apple hit the market like a storm 🌪️. He announced that a staggering 50% tariff would be imposed on EU goods starting from June 1, citing "unfair trade practices." Meanwhile, he threatened Apple with a 25% tariff if iPhones sold in the U.S. were not manufactured domestically.
This news sent gold prices soaring 🚀. As a safe-haven asset, gold surged amid investors' concerns about global economic impacts. The previously firm 3280 support level became increasingly critical in the upward trend.
If the tariff dispute remains unresolved and tensions continue between the U.S., the EU, and enterprises like Apple, the upward momentum of gold prices may persist. Analysts note that gold is likely to break through the 3500 mark 🏔️—tariffs disrupt global supply chains and raise inflation fears in the U.S., driving investors to flock to gold to hedge against economic and currency risks.
⚡️⚡️⚡️ XAUUSD ⚡️⚡️⚡️
🚀 Buy@ 3340 - 3360
🚀 TP 3400 - 3450
Accurate signals are updated every day 📈 If you encounter any problems during trading, these signals can serve as your reliable guide 🧭 Feel free to refer to them! I sincerely hope they'll be of great help to you 🌟 👇

#XAUUSD: +2000 Pips Correction US-China Trade Deal ConfirmedGold has experienced a significant decline in recent days, primarily due to fundamental market factors that have caused its price to fall from 3430 to 3209, resulting in a loss of approximately 2210 pips. Consequently, we recommend that you consider selling Gold if it aligns with your analysis and assessment. It is imperative that you implement strict risk management measures while trading Gold.
It is important to note that this analysis does not guarantee a price decline or that the market will behave as described. Therefore, we strongly advise you to conduct thorough trade planning before making any trading decisions.
We extend our sincere gratitude for your unwavering support over the years.
Our primary objective is to assist you in making well-informed decisions. Therefore, we encourage you to contact us if you have any inquiries or require further information.
Additionally, we would be delighted to receive your insights on which cryptocurrency pair you would like to explore next. Please do not hesitate to share your preferences.
Best regards,
Team Setupsfx_

XAUUSD[GOLD]: Another Possible Swing Sell Happening! Swing MoveGold rejected twice as we had described in our last two analyses on Gold. We remain heavily bearish on Gold and expect a swift bearish move within the next week or following week. We are eyeing two targets. Please use this analysis accordingly and avoid overtrading. This is not a confirmation, and do not use the marked arrow as an entry or exit point. The marked red area drawn there represents a potential reversal zone from which price may reverse.
As always, this analysis does not guarantee that price will move as described in the chart. Please use your own knowledge and trading plan while trading Gold. Good luck and trade safely.
Want to support us? Do the following ❤️
-LIKE THE IDEA
-COMMENT YOUR VIEW
-SHARE IF YOU AGREE
Much love ❤️
Team Setupsfx_

EURUSD week 21 analysis🌐Fundamental Analysis
Over the past week, the EUR/USD pair was influenced by positive economic data from the US as the PMI index showed that private sector activity expanded more than expected. This supported the USD and put downward pressure on EUR/USD in the short term. However, the USD's gains were quickly limited by concerns about the fiscal situation as the US House of Representatives passed a spending and tax cut bill that could increase the public debt by more than $3 trillion over the next decade.
On the other hand, Eurozone wage data recorded a slowdown in growth in the first quarter, reducing inflation concerns and reinforcing expectations that the ECB will soon cut interest rates. This left the Euro lacking clear upside momentum. In the context of a lack of important data over the weekend, market sentiment and macro risks continued to dominate the EUR/USD's performance.
🕯Technical Analysis
EURUSD is still in a fairly strong uptrend and has hit the weekly resistance hook around 1.136. The next resistance level that the pair will face this week is 1.14200 with a large accumulation of sellers and when breaking out, pay attention to the weekly resistance level at 1.15000
To reverse the current trend, the pair needs to break the trendline structure around 1.12700. When breaking this area, it will wait for a retest point to SELL to the Entry Gap price of 1.116
📈📉Trading Signals
BUY EURUSD 1.127-1.125 SL 1.122
SELL EURUSD 1.142-1.144 SL 1.149 (Scalping)
SELL EURUSD 1.150-1.152 SL 1.155

Gold Heist Blueprint: "XAU/USD" Short Setup!?Greetings, wealth snatchers and market bandits! 🤑💸
Welcome to the Thief Trading Style, where we combine slick technicals and crafty fundamentals to pull off the ultimate XAU/USD heist. This is our plan to raid the "Gold" market with a short entry, targeting the high-stakes GREEN MA Zone. Expect a risky, oversold setup with consolidation and a potential trend reversal—a trap where bullish robbers get outplayed. 💪🎯 Stick to the chart, execute with precision, and treat yourself to the spoils! 🍾
Why This Trade? 💰
XAU/USD is showing a neutral trend with a bearish tilt as of 18 May 2025, driven by:
📊Technicals: Price is testing a key support zone (~3120) after a breakout from a consolidation pattern on the 30-minute chart. Oversold RSI signals a potential reversal, with the Pink MA (50-period) acting as dynamic resistance.
📰Fundamentals: Recent COT reports indicate reduced speculative long positions, hinting at weakening bullish momentum. Quantitative analysis suggests gold’s correlation with USD strength is tightening, supporting a bearish outlook.
😇Sentiment: Intermarket analysis shows rising Treasury yields pressuring gold, while market sentiment leans cautious ahead of upcoming economic data releases.
💡Data Point: Gold’s average daily range (ADR) over the past 5 days is ~35 points, aligning with our target and stop-loss levels for a day/scalp trade.
Entry 📈: Set your trap at 3120 post-breakout.
Option 1: Place sell stop orders below the support breakout level (~3115) for confirmation.
Option 2: For pullback entries, set sell limit orders near the swing low/high on a 15/30-minute timeframe.
Pro Tip: Set an alert to catch the breakout in real-time. Don’t miss the heist! 🚨
Stop Loss 🛑: Protect your loot!
Place your stop loss above the nearest swing high (~3270) on the 30-minute chart for day/scalp trades.
Adjust based on your risk tolerance, lot size, and number of orders.
Note: If using sell stop orders, wait for breakout confirmation before setting your stop. Risk is yours—play it sharp! 🔥
Target 🎯: 3000 (120-point move, aligning with ADR and support zones).
Trading Alert 🚨:
News Risk: Upcoming economic releases (e.g., CPI, FOMC minutes) could spike volatility. Avoid new trades during high-impact news and use trailing stops to lock in profits.
Position Management: Scale out at key levels (e.g., 50% at 3060) to secure gains.
Join the Heist! 💥
Hit the Boost Button to power up our robbery squad. With the Thief Trading Style, we make markets bleed profits daily. 🏆 Stay sharp, follow the plan, and let’s stack those wins! Another heist is coming soon—keep your eyes peeled. 🐱👤💰
Check fundamentals, COT reports, and intermarket trends for deeper insights.
check linkkss..🔗
Happy thieving! 🤝🚀
