It’s the right time to shortUS President Trump recently criticized Fed Chairman Powell again, calling him "slow to act" and emphasizing that the Fed should cut interest rates as soon as possible to support the economy. Trump believes that delaying interest rate cuts may lead to the risk of recession in the US economy, but the Fed still takes inflation and employment data as the core of decision-making, and the two sides have obvious differences in policy positions.
At present, the Fed's interest rate cut expectations have been postponed and the magnitude has been reduced. Coupled with the expectation of rising US bond yields, the gold market sentiment has weakened. The world's largest gold ETF recently reduced its holdings by 8.98 tons to 918.73 tons, reflecting the cooling of institutions' short-term bullish enthusiasm for gold. Technically, gold prices continued to weaken after breaking through key support last week, and the weekly closing was negative, suggesting that shorts were dominant; the daily level was constrained by the 20-day moving average, and the volatile downward trend may continue in the short term. Focus on the 3250-3265 line resistance during the day. If it cannot break through, the $3,200 mark below may face a test.
Gold recommendation: short sell when it rebounds to 3245-3252 range. Target 3230-3220.
Xauusdshort
Yield Wars and Crypto Surge: Is Gold Losing Its Luster?Gold currently lacks fundamental backing, as macroeconomic conditions continue to favor alternative investment vehicles. Surging U.S. Treasury yields have diminished the appeal of non-yielding assets like gold, while Bitcoin’s ascent beyond the $100,000 mark indicates a significant shift in risk-on sentiment. Once considered the premier safe-haven asset, gold has seen substantial capital outflows—particularly after President Trump's inauguration—as institutional interest shifted toward cryptocurrencies and government bonds.
From a technical perspective, gold is currently testing a key supply zone around the 3250 level. A confirmed Break of Structure (BOS) would require a strong move above the 3255 area. However, should a 4-hour candle close below this zone, it would reinforce bearish intent and potentially trigger a 300-pip correction. With both macro and technical factors aligning, the directional bias remains clearly defined—further analysis is unnecessary at this stage.

XAUUSD:Short mainly
Gold continued its pullback last week, bouncing back after meeting key support and closing below the negative shadow line. At the present stage, the trend is relying on the key support level shock, and the rebound has not made a breakthrough, the pressure after the retreat of risk aversion is more and more obvious, and there is still the possibility of deepening the decline.
Today's trend personal expected sideways shock, short-term pressure above 3245-3250, can be around this area short, below the first support to see 3200, after breaking the 3145-3150.
This week's overall operating range relies on the 3145-3250 range band.
↓↓↓ The detailed strategy club will have tips, updated daily, come and get them →→→

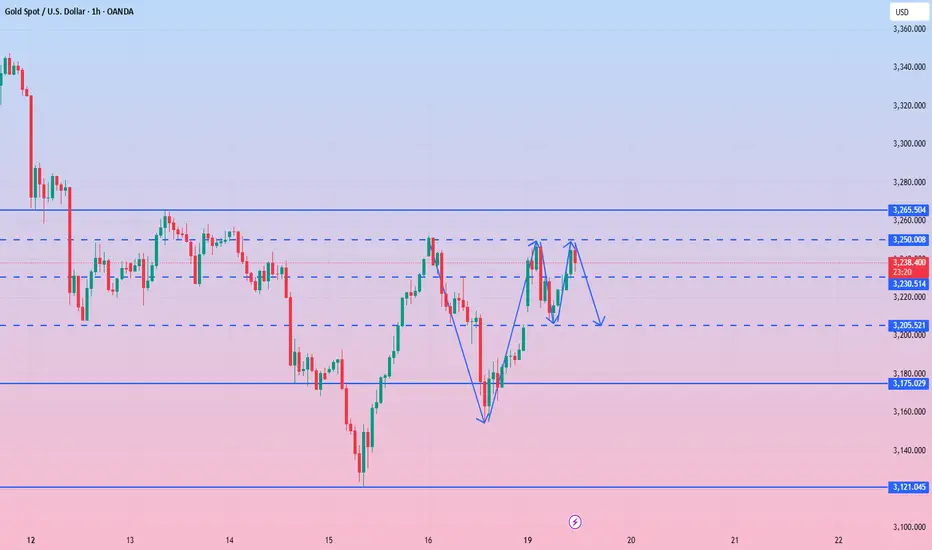
XAUUSD at the Crossroads: Breakout or Breakdown?OANDA:XAUUSD Gold (XAUUSD) is trading around $3,237, currently testing a descending trendline and minor resistance. A clear breakout above this level could open the way to retest the $3,289 resistance area, followed by the $3,435 recent high and potentially the all-time high near $3,498.
Failure to break higher may see the price remain range-bound between $3,240 and $3,289. A break below support at $3,123 would be bearish and could trigger a drop toward $3,050.
Fundamental Drivers:
Moody’s US credit downgrade continues to support safe-haven flows
Fed commentary and trade uncertainty cap directional clarity
Higher Treasury yields remain a headwind for Gold
📌 Key Levels:
Minor resistance: $3,240
Major resistance: $3,289 / $3,435
Support zone: $3,123 / $3,050

How to layout in the battle between long and short positionsGold surged directly at the opening, which is in line with our analysis expectations. We gave a short position near 3240-45. As expected, gold fell to the 3230 line for profit. There is great pressure from above and limited space above. Up to now, it has been fluctuating near 3220. For gold, we are now focusing on the short-term support of 3200-06. If it breaks through this position, it is very likely to go to the 3175-90 line.
From the current trend analysis, today's support continues to focus on 3170-80, strong support 3150, and upper pressure 3253-60. Relying on this range as a whole, the main tone of high-altitude low-multiple cycle participation remains unchanged. In the middle position, you must watch more and move less, be cautious in chasing orders, and wait patiently for key points to enter the market. I will notify you of the specific operation strategy in time and pay attention to it in time.
Gold operation strategy: short gold rebound near 3240-50, target 3230-3220. Pay attention to the support of 3202 and 3175 below, and go long according to the strength of the decline!

5/19 Gold Trading Signals🔍 Market Overview:
Last Friday, gold prices entered the 3176–3148 buy zone, and after the market opened today, prices rose to 3249, yielding substantial profits.
From a technical perspective, the overall trend is still under the pressure of a double-top pattern. In the short term, price action remains in a range, but the lows are gradually rising. However, indicators are not yet favorable for bulls. In this case, if the bulls want to take control, then the support at 3182–3176 becomes extremely important during any pullback.
🗞️ News Background:
Trump’s tax cut bill has been approved by a key committee in the U.S. House of Representatives.
👉 This week, further progress must be closely monitored as it directly impacts gold's safe-haven demand.
If trade tensions flare up again, gold is likely to rise sharply due to renewed safe-haven demand.
If tensions continue to ease, downward pressure on gold will likely increase.
Also, watch out for any comments on monetary policy — if rate cut expectations increase, gold could face additional downside risk.
📈 Today’s Trading Strategy:
🟢 Buy Zone: 3196 – 3176
🔴 Sell Zone: 3293 – 3318
🔄 Scalp/Flexible Trading Zones:
3188-3209-3236-3252-3269-3282

GOLD set for another drop?As expected in our previous analysis XAUUSD bounced to daily resistance and started to get rejected with a strong momentum in the major direction of the trend. As we see series of lower high formation XAUUSD may continue to drop to daily support level following the long term trend.

GOLD📊 XAU/USD Weekly Analysis
📅 May 18, 2025
🔍 Key Levels:
▫️ Sell Zone: $3330-3367
▫️ Major Resistance: $3415
▫️ Current Price: $3203
▫️ Target: $2956
⚡️ Scenario:
• Wait for pullback to sell zone
• Sell ONLY with confirmation
⚠️ Warning:
• US rating cut (Moody's) → Potential bullish gap Monday
📌 Risk Management:
• Stop Loss: $3380
• Max Risk: 1% capital

Gold ended this week successfully!In terms of news, first, the easing of the trade situation weakened the safe-haven property of gold. Secondly, a series of data released this week and the Fed's emphasis on not rushing to cut interest rates also suppressed the gold price. In addition, the parties involved in geopolitical conflicts also began talks. Although there are differences in negotiating positions, they still have to solve the problem when they can sit down and talk. Because of the repeated news, the closing price at the end of the week was also above 3200, so some people still believe that the gold price will go to 3500, and even think that it will exceed this position. I have mentioned this in my previous analysis. The gold price was first stimulated by multiple news and buying rushed up. Now that the risk aversion has receded, I think it is reasonable to see the gold price fall.
Let's analyze it from the technical side: the rhythm of gold has changed rapidly recently, and next Monday is actually the key. The 1-hour moving average of gold has begun to show signs of turning around, so whether it can form a golden cross upwards is the key next time, or it will oscillate a few times and continue to diverge downward. The strength of gold on Monday is very critical. Gold closed with a big positive line on Thursday, which was a very fast trend. However, it fell directly on Tuesday and broke through more than half, so it cannot be said that the bulls are strong. Although it rebounded slightly in the late trading, it still closed with a big negative line. There will be two key positions on Monday next week. Pay attention to 3180 on the bottom of gold. If it falls below 3180 soon after the opening on Monday, then gold will still be weak as a whole. Pay attention to 3215 on the top. If gold breaks through 3215, then gold will be strong as a whole. If gold opens flat on Monday and the upward momentum is not strong, and it is under pressure at 3215, then you can continue to go short in the short term.
TVC:GOLD OANDA:XAUUSD FOREXCOM:XAUUSD

Xauusd down trendTye xauusd has been on a downtrend this week. It will probably continue and it has a pull down on Friday before the market close. It will continue on a downtren definitely.
Take profit is at 3121.27
XAU/USD weekly outlook My analysis revolves around the continuation of the current short-term bearish trend. To capitalise on this move, I’ll be watching for price to mitigate either the 4-hour supply zone or the 3-hour supply zone. If price instead decides to respect a nearby demand zone, I’ll shift focus and wait for a potential reaction from a 1-hour demand zone.
From there, we could see signs of accumulation followed by a bullish reaction, leading price back up into a supply zone before continuing the sell-off in line with the prevailing trend. However, if price breaks below the 1-hour demand, that would further confirm a stronger bearish bias.
Confluences for GOLD sells are as follows:
- Price has broken structure to the downside, confirming the short-term bearish trend.
- Price is approaching both the 4-hour and 3-hour supply zones, which could act as strong sell areas.
- There is a lot of downside liquidity that remains untapped and could be targeted.
- On the higher timeframes, price appears overbought due to the recent corrective move.
P.S. If price fails to respect the nearby supply zones and breaks through them, I’ll then look for a reaction from a more premium supply level. Overall, my long-term bias remains bullish based on the higher timeframes.

Gold’s Make-or-Break Level: $3167 Is the Key to the Next MoveGold Spot is sitting at a critical inflection point — and if you’ve been watching the charts, you know exactly where the pressure is building: the $3167 zone.
This level has acted as a mid-term support floor, cushioning gold’s recent corrections and providing bulls with a lifeline. But that cushion is now getting thinner, and if price action breaks below this area decisively, the implications could be sharply bearish.
👀Why $3167 Matters👀
Take a look at the recent structure. Every bounce, every bullish attempt in the past week, has leaned on $3167. It's not just some random line — it’s where buyers have consistently stepped in to defend.
But now? The bounces are getting weaker. Volume’s fading. And price is consolidating right above support — never a good sign.
If gold breaks $3167 and closes below it, expect an acceleration to the downside. Momentum traders will likely pile in, and we could see a quick slide into the $3075–3052 zone, where the next real demand sits.
✨What I’m Watching✨
A clean hourly candle close below $3167 — ideally with follow-through volume.
Any retest of $3167 after a breakdown could offer a textbook entry for shorts.
🎁The Bearish Scenario
If the break happens, I’ll be targeting $3052 for the first bounce. That’s where previous accumulation kicked in — and it lines up with a cluster of reaction lows from late April. It’s also a psychological round number and a potential spot for intraday reversal plays.

XAUUSD[GOLD]; Is it the beginning of the major correction? XAUUSD dropped from 3265$ to 3127$, as predicted in our previous analysis. However, after touching 3127$, the price has retraced slightly and is currently trading at 3178$. In our opinion, the price can go up to $3220 maximum and reject at that level. We need to wait and see how prices behave. Another possible entry point is at 3178$, which is the current trading price. We believe this region is good for selling because the price has struggled to break through it. Please use a proper trading plan while trading gold.
As always, this analysis doesn’t guarantee that price will move as described in the chart. Please use your own knowledge and trading plan while trading gold. Good luck and trade safely.
Want to support us? Do the following ❤️
-LIKE THE IDEA
-COMMENT YOUR VIEW
-SHARE IF YOU AGREE
Much love ❤️
Team Setupsfx_


Gold still has room to fall and rebounds to continue to shortGold fell as expected in the Asian session, which was in line with our thinking and expectations. Our short position was shorted near 3237-38 and exited with profit, and then shorted near 3194 and exited with profit again, and we made good profits both times. There are many people who followed the trend and went long in today's market, or even chased the long position, and without exception, they were trapped and wailing. We have repeatedly emphasized that we should treat it with a sweeping approach, and different market rhythms should be responded to with different methods. Judging from the current market trend, the European session continues to weaken. The focus should be on the gains and losses of 3180 support. If it breaks through, it will continue to look at 3150 and 3120. In this case, the short-term will return to weakness. If it does not break, we will look at a wide sweeping range. The upper pressure will focus on 3200, 3215, and 3230. The rebound will be mainly high. The weekly line will be closed tonight, and volatility will intensify.

Gold Free fall to 3080/3050 ?Gold just broke the channel.
I expect a rapid decline the following hours to 3080 and if that breaks, 3050

Gold Sell to 3080? Gold just broke the channel.
There is a potential bearish move to 3080 and if that breaks, 3050

Technical & Historical Key TakeawaysThis chart analyzes the historical price cycles of Gold (XAU/USD) over the past decades, focusing on the alternation between long bull runs and prolonged bear markets.
You highlighted clear phases:
1970 - 1980: 10-year Bull Run
Massive price rally, followed by a sharp correction.
1980 - 2001: 20-year Bear Market
Prolonged sideways and downward movement.
2001 - 2011: 10-year Bull Run
Strong upward trend, reaching new all-time highs.
2011 - 2016: 5-year Bear Market
Significant correction but shorter in duration.
2016 - 2025: 10-year Bull Run
Another strong bullish phase, possibly ending in May 2025.
🔮 Scenarios projected:
Scenario 1 (Blue path):
A shorter bear market (5 years) similar to 2011-2016 correction, then continuation of the long-term uptrend.
Scenario 2 (Yellow path):
Gold enters a long-term 20-year bear market, similar to what happened post-1980.
You are asking if Gold is now entering a short bear phase (Scenario 1) or will fall into a multi-decade bear market (Scenario 2).
Cyclicality of Gold:
Gold has shown repetitive cycles of 10-year bull runs followed by either short (5-year) or long (20-year) bear markets.
These cycles seem to reflect macroeconomic shifts (inflation, interest rates, global crises).
Current Cycle (2016 - 2025):
If we respect the pattern, May 2025 might mark the end of the current bull cycle, opening the door to a corrective phase.
Scenario 1 favors a soft correction:
Based on the last cycle (2011-2016), a 5-year bear market might occur.
This would keep the long-term bullish trend alive, especially if macroeconomic conditions stay inflationary or geopolitical risks remain high.
Scenario 2 warns of a harsh bear market:
If history repeats the 1980-2001 phase, gold could enter a multi-decade bear market, driven by reduced inflation fears, strong dollar cycles, or financial system stability.
Key Indicators to watch:
Real interest rates.
USD strength vs global currencies.
Demand from central banks and emerging markets.
Geopolitical tensions and inflation expectations.

Long orders are trapped,what should we do with the US gold marke🗞News side:
1. India considers using new Indus River project to cut water supply to Pakistan.
2. Pay attention to the news of Russia-Ukraine ceasefire negotiations today
📈Technical aspects:
Gold once fell to around 3170, which is in line with our judgment of bullish weakness. This is why we are not in a hurry to participate in long orders today. I know that many bros also listened to the outside world and went long around 3200, which led to being trapped. At present, the gold price is constantly testing the 3170 support line. If it falls below, it will look to the 3150 support line. If it does not break, it will be treated as a shock. On the top, temporarily pay attention to the 3205-3215 line of resistance. If it encounters resistance and pressure, go short. On the bottom, first pay attention to the 3170 support line, and then pay attention to the 3150-3140 support line. Hold if it breaks.
If you agree with this view, or have a better idea, please leave a message in the comment area. I look forward to hearing different voices.
OANDA:XAUUSD FX:XAUUSD TVC:GOLD FXOPEN:XAUUSD FOREXCOM:XAUUSD

XAUUSD Intraday Swing Friday Timeframe: 15-Minute (M15)
📉 Current Price: Around 3,173.805 USD
📌 Key Zones & Structure on the Chart:
1. Order Block (OB)
Located at the top (around 3,253 – 3,231).
This is a strong supply zone that triggered a sharp sell-off.
Price previously grabbed liquidity before sharply rejecting from this zone.
2. Sell-Side Liquidity (SSL) & Buy-Side Liquidity (BSL)
SSL: Taken out → strong indication that smart money is pushing price lower.
BSL: Also taken before the drop → confirming a false breakout and reversal to the downside.
3. Breaker + Base Area
Breaker block has been tested but failed to push price higher.
This confirms the area has flipped from support to resistance (bearish flip zone).
4. Bearish Target
Projected drop toward the next demand zone around 3,150 – 3,145 (lower gray box).
Marked by the arrow pointing down, indicating potential bearish continuation.
📊 Price Structure:
Trend: Bearish (Lower Highs – Lower Lows forming)
Strong rejection from breaker area → confirms bearish bias.
Current price is performing a minor pullback and is expected to continue dropping toward the demand zone.
✅ Summary of Analysis:
Bias: Bearish
Potential Entry: After a pullback into supply or breaker area (3,180 – 3,191)
Target: 3,150 – 3,145 (major demand zone)
Additional Confirmation: Watch for price rejection during pullback + rising volume during support break.

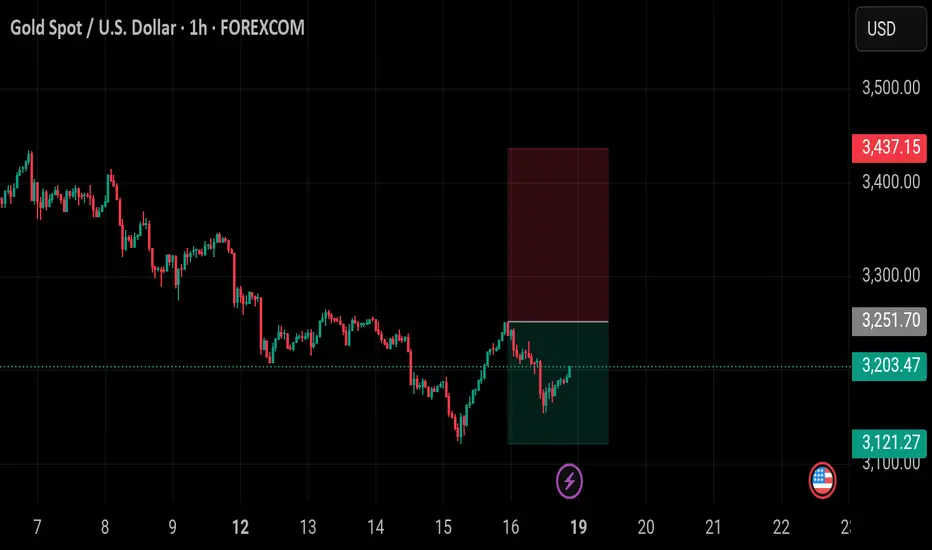
GOLD Update – Short Opportunity After Pullback! Gold traders! 💛 Our key support zone (3,212 - 3,196) has just been broken, and price is now consolidating below! 🎯
We previously took big profits from this level (our followers know!), and now we’re waiting for a pullback to enter a high-probability short trade!
⚡️ Golden Rule:
✅ If price retests the level as new resistance, go SHORT!
✅ If it reverses and breaks back above, consider a LONG!
📌 Always trade with a strategy—be ready for any scenario!
💸 The Secret to Trading Success:
🔹 Keep losses small & controlled.
🔹 Let profits run & grow!
🔹 We can’t control the market, but we CAN control our risk!
🚀 Gold is always hot—what’s your take?
👇 What’s your analysis on this move?
For detailed entry points, trade management, and high-probability setups, follow the channel:
ForexCSP

THE SOUTHEASTEveryone would sell out and go,
everyone who counts.
Technical Section:
ABC bear market (the price of gold must come down)
Target-1 =$ 3000
Target-2 =$ 3300
Target-3 =$ 2650
We shall see.

The focus of gold today is 3200!News:
The US economic data in April was weak across the board, with the producer price index (PPI) unexpectedly falling by 0.5%, retail sales growth plummeting to 0.1%, and manufacturing output falling by 0.4%, which severely hit the market's confidence in the US economy. Affected by this, the US bond market fluctuated violently, with the 10-year US bond yield plummeting by 11 basis points and the 2-year yield plummeting by 9.2 basis points; the US dollar index fell by 0.2%, and the real interest rate fell. At the same time, geopolitical risks continue to heat up. The Russia-Ukraine peace talks have reached a deadlock, Putin refused to meet with Zelensky, and the Iran nuclear agreement negotiations have not progressed smoothly. Against this background, the safe-haven attribute of gold has been highlighted, and market attention has increased significantly. Looking ahead to this trading day, a number of important US economic data will be released soon, and the progress of the Russia-Ukraine talks and Trump's dynamics are also attracting much attention. These factors will continue to affect market trends.
Technical aspect: From the perspective of the daily line, gold can no longer be regarded as a unilateral decline after yesterday's bottoming out and rebounding. It should be directly followed by the idea of oscillation! The primary focus today is still the position of the dividing line of 3200.
Trading idea: Go long if it doesn’t break around 3200, sl3190, target 3230
