Gold latest strategy analysisGold prices fell on Wednesday as eased global trade tensions alleviated fears of a potential global economic recession, boosting investors' risk appetite and dampening gold's safe-haven appeal. Before the U.S. trading session on Wednesday, spot gold plunged sharply in a short term, plummeting by $50 in just three hours and breaking below the $3,200 mark. After 50 hours of consolidation, gold finally broke below the previous low of 3,200 to continue its downward trend. It can now be confirmed that the wave 3 decline is established. Currently, the gold price has stopped falling and rebounded at the lower track of the downward channel (this channel position can refer to the support level analyzed in yesterday's morning session). After the previous support was broken, it can be used as a reference for short-term resistance, namely the 3,200-3,206 area. As long as the rebound does not hold above this level tonight, the subsequent strategy will be to go short at highs and look for further downside.
you are currently struggling with losses, or are unsure which of the numerous trading strategies to follow, at this moment, you can choose to observe the operations within our channel.
Xauusdshort

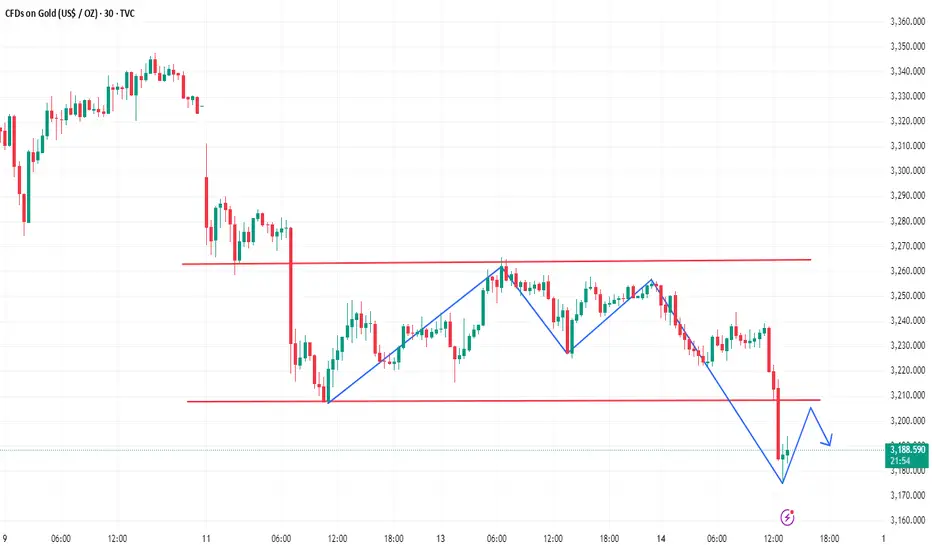
Can we continue to bet against gold?My article today emphasized that gold may fall below 3200. Sure enough, it did so without hesitation today and fell to around 3175 in the short term. At present, gold has rebounded, and the short-term pressure is around 3200, so you can short at this position.
In the short term, focus on the support near 3160 below. If it falls below, there is still room for gold to fall.
XAUUSD/GOLD | 1H | SELL NOW Hello, everyone,
My gold target level is 3,190.0.
My friends, every single like from you is my biggest motivation to share my analysis.
Thank you very much to everyone who supports me with likes.

XAUUSD TRADE LINE, SELLING OPPORTUNITYHere I Created This XAUUSD Chart Analysis
Pair : XAUUSD (Gold)
Timeframe: 30 - Minutes
Pattern: Trade Line Resistance
Momentum: Bearish/ SELL
Entry Level : SELL 3238
Resistance zone : 3238
Target Will Be : 3208
Disclaimer : This signal is based on personal analysis for learning purposes. Trade at your own risk and always use proper risk management.

Focus on 3200 for some support during the day🗞News side:
1. Sino-US tariffs have been eased
2. U.S. trade progress and focus on geopolitical risks
📈Technical aspects:
Yesterday we gave a long trading strategy and have been waiting to see whether the gold price can touch our target point of 3270. However, gold did not fluctuate much after the opening of the Asian market, so I chose to manually close the position near 3256.
To be honest, the market did not fluctuate much today whether it was up or down, and it is still consolidating within our box range of 3220-3265. Although gold is generally weak, it has a higher probability of strengthening during the day, and the early gap may be ready for market recovery. At present, the gold price has tested the 3240 line many times. If it cannot stand above 3240, it may test the strong support of 3200 again. If there is no breakthrough below the strong 3200 support, the market may repeat
If you agree with this view, or have a better idea, please leave a message in the comment area. I look forward to hearing different voices.
FOREXCOM:XAUUSD FXOPEN:XAUUSD TVC:GOLD FX:XAUUSD OANDA:XAUUSD

GOLD on sideways#xauusd have been multiple rejecting both on bearish and bullish, now next breakout will determine the next move on the pair.
Above the rectangle at 3244.5-3252 will push the pair above 3278, stop loss at 3235.
Below 3229 will trigger a full bearish because the M5 is waiting for breakout below drop. Target 3187

XAUUSD Bearish Pennant Breakdown | Retest in Play – 3090 TargetGold (XAUUSD) has been in a corrective phase after reaching the resistance zone around 3370–3420 USD, where the price was previously rejected with strong selling pressure. Over the past sessions, price action has developed into a Bearish Pennant pattern, typically seen as a continuation pattern in a downtrend.
Following a sharp drop from the highs, the price consolidated between converging trendlines, creating lower highs and higher lows. This structure resembles a pennant or triangle formation, which traders often interpret as a pause before the next leg down.
🔍 Key Technical Features:
1. Resistance Zone (3370–3420 USD):
Strong institutional selling observed here.
Multiple rejections confirm this zone as a significant supply area.
This area also serves as a risk management reference point for stop-loss placement.
2. Support Zone (3210–3230 USD):
The price bounced multiple times from this level, making it a key demand area.
A clean break below this zone would confirm bearish continuation.
3. Trendline Resistance:
A descending trendline has been respected consistently since May 8.
Price recently retested this trendline after a minor pullback, aligning with the bearish pennant structure.
4. Bearish Pennant Pattern:
Forms after a strong downward impulse.
The consolidation is narrowing within converging trendlines.
A breakdown with high volume typically leads to a continuation of the prior trend.
5. Breakout & Retest:
Price has already broken below the pennant's lower boundary.
The current move is a retest of the broken trendline—a classic setup for entering a short position upon rejection.
🎯 Bearish Target Projection:
The measured move from the pole of the pennant suggests a target around 3090 USD.
This level is derived by taking the height of the initial drop before the pennant and projecting it downward from the breakout point.
🛑 Stop Loss Strategy:
A conservative stop loss can be placed just above the 3370 USD resistance zone.
Alternatively, a tighter stop could be placed slightly above the trendline (~3240–3250) for aggressive entries, though this increases the risk of a false breakout.
✅ Trading Plan Summary:
Aspect Level / Detail
Entry Zone After retest & rejection (near 3230–3240 USD)
Target 3090 USD
Stop Loss Above 3370 USD
Risk-Reward Approx. 1:3 or higher
Pattern Type Bearish Pennant
🧠 Final Thoughts:
This is a textbook bearish continuation setup with strong confluences:
Trendline resistance
Bearish pennant formation
Breakdown with retest
Clear resistance and support zones for managing risk
If momentum sustains to the downside after the retest, we could see a swift drop toward 3090 USD, offering a favorable shorting opportunity for swing and intraday traders alike.
Always confirm with volume and candlestick confirmation before execution. Stay updated with fundamental drivers such as CPI, PPI, or FOMC comments, which can inject volatility.

Gold Strong Crash, Final Warning —Moving Below $2,000XAUUSD (Gold) will move below $3,000 with very strong bearish momentum. You cannot say that you were not warned. It will continue lower to hit a target around $2,750 after $3,000 fails as support.
After the $2,750 target hits, I will look again at the chart and see what it has to say. Below $3,000 is ultra high probability, guaranteed basically. $2,750 is also very high probability that it will hit.
Will it continue lower? At this point it is hard to tell because I don't know Gold's long-term dynamics in a correction, but it isn't looking pretty. If current geopolitical conditions is what's making Gold bearish, then XAUUSD is set for a long-term bear market because everything will continue in the same vein.
That is only if that's the reason why Gold is bearish.
» Looking at the monthly chart, it is a disaster. Gold is set to move below $2,000 in the coming months.
Do you agree?
Disagree?
Leave a comment.
Thank you for reading.
(Remember to follow, and boost...)
Namaste.

5/14 Gold Trading Signals🌇Good afternoon, everyone!
Yesterday, gold only entered the 3218–3252 flexible range , and did not touch the broader buy/sell zones, resulting in limited profits .
Currently, gold remains under resistance , and candlestick formations suggest an irregular double top . With ongoing sideways box-range movement , the market lacks a clear direction, so caution is advised .
📉 If bears take control, gold could drop toward 3169 .
📈 If bulls prevail , a rebound to 3300 is likely.
🔍 Key Technical Zones:
Bullish Resistance : 3246 – 3268
Support Area : 3218 – 3209
🗞 News Focus:
Speeches from Fed members Waller and Jefferson today may trigger directional momentum in the market.
📌 Trading Strategy for Today:
Sell Zone : 3301 – 3327
Buy Zone : 3170 – 3152
Flexible Trading Ranges :
▫️ 3210 – 3243
▫️ 3272 – 3259
▫️ 3247 – 3296
✅ Trade with discipline, manage position sizes carefully, and stay alert during key speeches.

Gold maintains range operation in the short termAfter the release of CPI data, spot gold rose slightly by $6 in the short term. The US dollar index quickly fell by about 14 points, hitting an intraday low of around 101.40, reflecting the failure of some traders' expectations of "sticky inflation". However, the decline did not last, and DXY subsequently rebounded by about 18 points to 101.54, indicating buying intervention and reassessment of the data.
From the daily chart, it can be observed that the recent trend of gold prices has shown obvious technical characteristics. Gold prices have formed a clear upward channel since March. After breaking through the 3200 mark in April, it once hit a high of 3499.83, and then fell back. The current gold price is around $3250, which has fallen back to the middle and lower track of the rising channel. The RSI indicator is currently in the neutral zone of 49.94, indicating that there is neither overbought nor oversold, and the market is in a relatively balanced state.
At present, it is recommended to operate in the range. You can try to short in the 3255-3260 area, and the target is around 3220

XAUUSD | UNPRESIDENTED GOLD RALLY : Where to Next?GOLD has been trading extremely bullish over the past year, with high volume indicating lots of interest and movement in this commodity's market:
Is this where we should be getting worried?
Rapid surges in gold prices have historically been followed by sharp corrections as markets adjust. Three key examples illustrate this;
🧨 the 1980 spike to $850 due to global instability, followed by a 65% drop;
🧨 the 2011 peak near $1,900 driven by economic anxieties, leading to a 40% decline by 2015;
🧨and the 2020 high above $2,075 amid pandemic fears and stimulus, which subsequently settled into a lower range.
Noticing how gold has been trading in a parabolic curve, first corrections are likely to be down the curve (as it has been, historically):
Across past gold peaks ( 1980, 2011, and 2020) and recent record highs, markets share four core similarities:
🎈elevated inflationary expectations,
🎈low or negative real interest‐rate environments,
🎈heightened geopolitical and trade‐war tensions,
🎈aggressive central‐bank and ETF buying.
Today’s gold rally mirrors these patterns, driven by persistent inflation concerns and renewed safe‑haven demand amid Middle East conflicts and Ukraine risk. Aggressive central‑bank and ETF purchases have also replicated past behavior. Emerging‑market central banks have accelerated gold reserves diversification since 2022, just as they did after the 2008 crisis and the Euro‑debt peak in 2011.
Historically, swift peaks have been followed by multi‑year corrections as external conditions normalize. After January 1980’s peak, gold fell by two‑thirds over two years; following 2011’s high, it dropped 40% by 2013. If inflation cools or central banks signal genuine rate normalization, this rally may likewise give way to a sustained consolidation or correction.
Did the BBC just signal the peak??
Recently the BBC warned that while current trade‑war and market volatility parallels past booms, overreliance on gold alone risks miss-timing the eventual downturn when macro fears realize.
Therefore, if the curve breaks, it's likely the beginning of the hard correction.
__________________________
OANDA:XAUUSD

CPI data released, golden day analysis and operation layout🗞News side:
1. CPI data is in line with expectations, short-term positive
📈Technical aspects:
As we wrote in the last post, from the 4H point of view, the oversold is serious, and there is a need for rebound correction in the short term. At present, the fluctuation of gold prices is mainly affected by news. Technical analysis and indicators can only be used as a side analysis guide and reference. Gold bottomed out in the morning and rebounded, and the European market continued to rise above 3250. This means that today is not a very weak bear. At the same time, the daily line touches the 30-day moving average support. There is a high probability of turning positive today. The overall idea is to treat the market as a shock.
Intraday gold operation suggestions:
🎁BUY 3240-3250
🎁TP 3260-3270
Looking further towards the 3277 line
If you agree with this view, or have a better idea, please leave a message in the comment area. I look forward to hearing different voices.
OANDA:XAUUSD FX:XAUUSD TVC:GOLD FXOPEN:XAUUSD FOREXCOM:XAUUSD

GOLD Sell Setup Alert – High-Probability Trade Sell GOLD @ 3256
🎯 Targets:
TP 1 → 3248
TP 2 → 3240
TP 3 → 3220
🛑 Stop Loss: 3267
⚠️ Enter slowly in layers with proper risk and money management.
This setup is based on technical levels – stay disciplined and trade smart.
📊 Follow for more premium setups on Crypto & Forex.
#GoldSignal #ForexTrading #XAUUSD #SellSetup #ForexSignals #RiskManagement #SmartTrading

gold on short bullish#XAUUSD price have formed and now awaiting to touch the next zone for bearish retracment.
Above 3278 still hold selling, target 3219, stop loss 3292.
Above 3266 can take bullish till 3278, CPI can drop the price following any possible drop below 3246.

Scalping and Swing Trading Strategies
A Guide to Optimizing on TradingView
Scalping and swing trading strategies are two popular trading approaches in Forex, OANDA:XAUUSD gold, and cryptocurrencies, enabling traders to capitalize on price movements for maximum profits. Scalping focuses on short-term trades with small gains, while swing trading targets longer-term trends. This article guides you on implementing these strategies on TradingView using tools like RSI, MACD, and Fibonacci. Let’s dive in to elevate your trading skills!
1. What is Scalping?
Scalping is a short-term trading strategy where traders execute multiple trades daily, capitalizing on small price movements (often a few pips). The goal is to accumulate small profits from numerous trades.
Timeframe: 1-minute (M1) or 5-minute (M5).
Suitable markets: Forex (EUR/USD, GBP/USD), gold (XAU/USD), or cryptocurrencies (BTC/USD).
Requirements: Quick reactions, strict risk management, and appropriate leverage.
Example: A scalper might buy EUR/USD when the price touches the lower Bollinger Band on an M5 chart and sell when it reaches the middle band.
2. What is Swing Trading?
Swing trading is a medium- to long-term strategy that captures “price swings” within larger trends. Traders hold positions for days to weeks to maximize profits from significant price movements.
Timeframe: 4-hour (H4) or daily (D1).
Suitable markets: Stocks, Forex, gold, and cryptocurrencies.
Requirements: Patience, trend analysis skills, and effective capital management.
Example: A swing trader might buy XAU/USD when the price hits the 61.8% Fibonacci level on an H4 chart and hold until it reaches the next resistance.
3. Why Use Scalping and Swing Trading Strategies on TradingView?
TradingView offers powerful tools to execute both strategies effectively:
Flexible price charts: Supports multiple timeframes and chart types (candlestick, Renko).
Technical indicators: RSI, MACD, Bollinger Bands, Fibonacci, and more.
Price alerts: Set notifications for when prices hit support/resistance levels.
Pine Script: Customize indicators or automate trading strategies.
Tip: Use TradingView’s “Replay” feature to test scalping or swing trading strategies on historical data.
4. Scalping Strategy on TradingView
4.1. Tools and Setup
Timeframe: M1 or M5.
Indicators:
Bollinger Bands (period 20, deviation 2).
RSI (period 14, overbought 70, oversold 30).
Trading pairs: EUR/USD, GBP/USD, or XAU/USD (due to high liquidity).
4.2. Trading Rules
Buy signal:
Price touches the lower Bollinger Band.
RSI <30 (oversold).
Confirmed by a reversal candlestick pattern (e.g., Doji).
Sell signal:
Price touches the upper Bollinger Band.
RSI >70 (overbought).
Confirmed by a reversal candlestick.
Risk management:
Set Stop Loss 5–10 pips below the nearest support.
Take Profit at 10–15 pips or when the price hits the middle Bollinger Band.
4.3. Example
On an M5 EUR/USD chart, if the price touches the lower Bollinger Band at 1.0850 and RSI <30, enter a buy order. Set Stop Loss at 1.0840 and Take Profit at 1.0865. Exit when the price reaches the middle band.
Image illustration: EUR/USD M5 chart with Bollinger Bands and RSI (optimize alt text: “EUR/USD scalping chart TradingView”).
5. Swing Trading Strategy on TradingView
5.1. Tools and Setup
Timeframe: H4 or D1.
Indicators:
Fibonacci Retracement.
MACD (12, 26, 9).
Moving Averages (MA50, MA200).
Trading pairs: XAU/USD, GBP/USD, or BTC/USD.
5.2. Trading Rules
Buy signal:
Price hits the 50% or 61.8% Fibonacci level in an uptrend.
MACD crosses above the signal line.
Price is above MA50.
Sell signal:
Price hits the 50% or 61.8% Fibonacci level in a downtrend.
MACD crosses below the signal line.
Price is below MA50.
Risk management:
Set Stop Loss below the nearest support (20–50 pips, depending on the pair).
Take Profit at the next resistance or a 1:2 risk-reward ratio.
5.3. Example
On an H4 XAU/USD chart, if the price hits the 61.8% Fibonacci level at $1,950 in an uptrend and MACD confirms a buy signal, enter a buy order. Set Stop Loss at $1,930 and Take Profit at $2,000.
Image illustration: XAU/USD H4 chart with Fibonacci and MACD (optimize alt text: “XAU/USD swing trading chart TradingView”).
6. Tips for Applying Scalping and Swing Trading Strategies
Combine with fundamental analysis: Economic news (interest rates, NFP reports) can impact prices, especially in Forex and OANDA:XAUUSD gold.
Backtest strategies: Use TradingView’s “Replay” mode to test strategies before live trading.
Manage emotions: Scalping requires intense focus, while swing trading demands patience. Choose the strategy that suits your personality.
Optimize costs: Scalping incurs high spread costs, so choose a broker with low spreads.
7. Conclusion
Scalping and swing trading strategies offer profitable opportunities in Forex, OANDA:XAUUSD gold, and cryptocurrencies, depending on your trading style. With TradingView’s powerful tools like Bollinger Bands, Fibonacci, and MACD, you can easily implement these strategies. Try scalping on EUR/USD or swing trading on XAU/USD today and share your results with the TradingView community! Sign up for TradingView to explore more features and optimize your trading.

Gold still has room to fallThe current market sentiment is undergoing a significant shift from risk aversion to risk appetite. The easing of trade tensions has greatly boosted market risk appetite, leading to a large-scale outflow of funds from safe-haven assets such as gold.
Considering the positive impact of the tariff agreement, gold prices may face further downward pressure. Technical analysis shows that once it falls below the $3,200 mark, the next support level is around $3,150. The further weakening of market risk aversion and the strengthening of the US dollar will continue to suppress gold prices.
The 1-hour moving average of gold continues to cross the downward short position, proving that there is still room for gold to go down. Based on the short-term resistance area near 3250, continue to short gold on rallies.

Gold's short-term rebound is weakAt the daily level, the Bollinger Bands are closing and flattening, and the 5-day moving average and the 10-day moving average are entangled near the middle track. The current price is running below the middle track, and the 5-day moving average has turned downward. The technical side shows that the current gold price is fluctuating and bearish, and the MACD has crossed at a high level. The red column continues to shrink. Intraday operations should focus on high-altitude thinking. Pay attention to the 10-day moving average and the middle track 3250-60 area resistance on the top, and pay attention to the support near the lower track of US$3200 on the bottom.
At the 4-hour level, the current downward trend of shock is more obvious, and the shape is a step-down. Ma5 and Ma10 are glued together and cross below 66ma. MACD death cross is combined with green column volume, and the overall idea of falling back and adjusting is maintained. The 1-hour moving average is still a downward short arrangement. After gold jumped down and opened, there is a large gap. Gold rebounded weakly and continued to fall. It will be difficult to cover the losses in the short term, and it will be covered in the process of roundabouts in the future market.

XAUUSD Gold Possible Move 13/05/2025Major Supply Zones:
Upper Supply Zone around $3,275–$3,285: Strong reaction from this area before the massive drop.
Mid Supply Zone around $3,265 - $3,268: Price has reacted again here.
Trendline Liquidity Grab:
Price moved above the internal rising trendline (liquidity sweep).
The wick into the trendline’s upper side aligns with a key supply zone, followed by rejection = potential shift in structure.
Bearish Rejection from Supply:
Confluence zone (circle area) where price might reverse.
Strong rejection seen right after price tapped this zone. possible entry trigger.
Internal Structure Shift:
If price breaks $3,245 support, that confirms CHoCH (Change of Character).
Bearish FVG could be forming just below the supply zone, which may act as resistance on retests.
📉 Trade Signal (Short Setup)
🔔 Entry:
Sell: $3,265 - 68 (if price returns for a retest of supply zone)
OR
Sell Market: If current bearish candle confirms engulfing with strong momentum
🎯 Targets:
TP1: $3,245 (mid support zone)
TP2: $3,220 (major demand zone at the bottom)
TP3 (swing): $3,210–$3,200
🛡️ Stop-Loss:
Above supply zone high: $3,275+
✅ Confluences for Bearish Bias:
Liquidity sweep above trendline
Supply zone rejection
Structure shifting lower
Price action showing rejection wicks
Clean imbalance zones below (liquidity magnets)
Kindly follow, support, comment and share as well.

5/12 Gold Trading SignalsGood morning everyone!
Gold opened lower and extended losses today, influenced by easing China–U.S. trade tensions and ceasefire news from India-Pakistan.
The recent rally was largely driven by safe-haven demand amid geopolitical concerns. As tensions ease, gold's retracement is a logical market reaction.
🔍 Technical Outlook:
Gold has now returned to a previous consolidation zone . While some support exists, current candlestick structure and most indicators show no clear bullish reversal yet.
Entering long positions too early may pose short-term risks, so trend trades should wait for stronger confirmation.
For flexible intraday trading, watch:
Support at 3263–3246: Holding this zone could trigger a rebound back toward 3309 resistance.
📌 Trading Recommendations:
✅ Sell Zone: 3306 – 3321
✅ Buy Zone: 3218 – 3198
🔁 Range for Scalp/Short-Term Trades: 3294 – 3263 / 3238 – 3269

Today's gold trend analysis, go long in batches🗞News side:
1. China-US trade relations eased, suspending some tariffs and countermeasures
2. Russia and Ukraine suspended firing for 30 days, and the India-Pakistan conflict was temporarily mediated
📈Technical aspects:
Since the US and China lowered some tariffs after the negotiation, the US dollar has recovered some of its losses, but gold has not completely recovered some of its losses. At present, the price of gold has once again retreated to near the 3260 line. Although the hourly level MACD indicator shows a golden cross, the daily level is still a dead cross and heavy volume.
Then in the short term, the gold price may show some counter-twitching momentum before the US dollar steps back to confirm support, or it may touch near the 3277 line. The gold price may fall further after the US dollar steps back to confirm the support. From a technical point of view, the upper daily resistance is near 3287, while the lower first-line support of 3200 is strong, and there is a tendency to form a double bottom. The European market can consider using 3250-40 US dollars as a support point, and the early trading low near 3220 as a defensive position. First, let's see the gold price continue to rebound to 3277-80-87, unless the European market weakens and breaks the Asian low, and then the US market adjusts. Temporarily, we will see a rebound correction.
If you agree with this view, or have a better idea, please leave a message in the comment area. I look forward to hearing different voices.
FOREXCOM:XAUUSD FXOPEN:XAUUSD TVC:GOLD FX:XAUUSD OANDA:XAUUSD

GOLD TRADE IDEA – XAUUSD 15-Min Chart | Sell SetupGold Spot (XAUUSD) is presenting a short (sell) opportunity on the 15-minute chart. The suggested sell zone is between 3235–3238, with multiple take-profit targets and a clear stop-loss:
Sell Entry: 3235 / 3238
TP 1: 3232
TP 2: 3228
TP 3: 3225
TP 4: 3222
TP 5: 3215
Stop-Loss (SL): 3245
This setup is based on price rejection from resistance and potential downward continuation toward the highlighted support zone. Always manage risk accordingly.

5/13 Gold Trading Signals🌞Good afternoon everyone!
Yesterday, gold successfully entered the 3218–3198 buy zone, delivering notable profits.
So far, the price has tested both the 3218 support and the 3246 resistance multiple times, reflecting a fierce battle between bulls and bears. From a technical perspective, bulls appear slightly favored in the short term, with major resistance located between 3286–3320.
⚠️ However, if gold fails to break through this area and reverses, it may initiate a medium-term downtrend, potentially falling toward the 3169–3110 zone.
📌 Trading Recommendations for Today:
Sell Zone: 3305 – 3330
Buy Zone: 3208 – 3178
Flexible Trading Ranges:
▫️ 3218 – 3252
▫️ 3282 – 3248
▫️ 3252 – 3303

Gold is trading sideways, can the bearish trend continue?🗞News side:
1. China-US trade relations eased, suspending some tariffs and countermeasures
2. Russia and Ukraine suspended firing for 30 days, and the India-Pakistan conflict was temporarily mediated
📈Technical aspects:
The trading strategy given today, if brothers have reference and follow the trading strategy to participate in long orders, I think you should all have good gains on hand. At present, gold is in consolidation, the 4H moving average is in a short position, and the MACD dead cross continues to increase, so the short-term short momentum still exists. From a technical point of view, in the downward trend from last week's high of 3347 to the current low of 3207, 3260 is at a key position. Therefore, we pay attention to the possibility of gold rebounding to 3260 in the evening.
If you agree with this view, or have a better idea, please leave a message in the comment area. I look forward to hearing different voices.
OANDA:XAUUSD FX:XAUUSD TVC:GOLD FXOPEN:XAUUSD FOREXCOM:XAUUSD
