6/20 Gold Analysis and Trading SignalsGood evening, everyone!
After gold rallied to around 3388 yesterday, it began to retrace gradually, providing solid returns for our sell-side strategy.
As of now, gold has dipped to a session low near 3339. On the 30-minute chart, the MACD has formed a bullish crossover, and price has broken above the Bollinger mid-band, indicating short-term bullish momentum. The candle structure supports a potential rebound, but strong overhead resistance remains.
Key resistance comes from the 1H MA60 around 3371, and gold still trades within a broader bearish trend on the daily timeframe. While bulls may attempt a recovery, a complete trend reversal remains unlikely unless significant bullish catalysts emerge.
Hence, our strategy continues to favor selling near resistance levels, while cautiously considering long entries near well-defined supports.
📌 Trading Plan (VIP Focus):
✅ Sell Zone: 3370–3383
✅ Buy Zone: 3338–3321
✅ Flexible Trade Range: 3366-3349
Xauusdsignal

Gold Eyes Breakout from Ascending Channel Toward $3,500📈 Chart Analysis
1. Rising Channel Structure
Gold (XAU/USD) has been trading within an upward-sloping channel, marked by the blue trendlines connecting interior lows and highs, culminating at point C (~$3,497). The latest bounce off the lower channel near “B” reinforces bullish bias – if this trendline holds, another leg higher toward resistance around $3,497–$3,500 is likely.
2. Support & Resistance Confluence
The purple trendline and the dotted horizontal green level (~$3,498) converge near the projected breakout point. This synergy provides a strong pivot zone — a successful breakout would validate targets near channel highs.
3. Harmonic Pattern in Play
The chart displays a bullish harmonic structure (likely a Bat or Gartley formation), with retracement ratios (0.719, 1.627) anchoring reversal areas. These reinforce the bounce at B and the potential move toward point C.
4. Trade Scenarios
Bullish Scenario (primary): A bounce off the trendline triggers a rally to the channel top and resistance zone ($3,497–$3,500).
Bearish Caution: A drop below the trendline invalidates the pattern, potentially bringing prices back to horizontal support around $3,296 or even $3,120, as indicated at point A.
🛠️ Technical & Market Context
Technicals: Daily trend remains bullish as long as price holds above ~$3,340–$3,350, with resistance forming in the $3,380–$3,400 range
Fundamentals: Geopolitical tension (e.g., Middle East conflict) and safe-haven inflows continue to underpin gold — though Citi expects prices to eventually correct toward $3,300–$3,500 mid‑term
.
Sentiment: Some analysts advocate “selling the rallies,” especially into the $3,450–$3,500 zone . But central banks’ ongoing buying and potential Fed rate cuts support a stronger floor
.
✅ Trade Strategy
Scenario Entry Zone Target Stop Loss Placement
Play the Bounce ~$3,350–$3,360 $3,497–$3,500 Below trendline near B zone (~$3,320)
Breakout Trade On momentum above $3,400 $3,497–$3,550 Below breakout (sub-$3,380)
Bearish Trigger Break & close below trendline Back to $3,296 / 3,120 Just above trendline ($3,360)
🔍 Summary
Gold remains in a structurally bullish setup inside an ascending channel. The confluence of harmonic reversal, strong trendline support, and pending fundamental catalysts presents a high-probability opportunity to push toward the $3,500 area—provided the trendline and $3,340–$3,350 support hold. A drop below would invalidate the bullish outlook and favor deeper retracement.

Gold (XAU/USD) 4-Hour Analysis- 20 June 2025On the 4-hour chart, gold has been trading in a fairly wide range.
The market has not clearly broken down, and many analysts see it as still structurally bullish as long as key support holds. Currently price is pulling back toward a confluence of support around $3,353–$3,355 (a zone overlapping a trendline and prior demand).
In other words, buyers have defended roughly the 3,340–3,355 area recently. Resistance lies just above in the $3,370–$3,380 region, with a major psychological pivot at $3,400. One analyst notes gold is “boxed between resistance at $3,450 and support at $3,340–$3,335”, so the immediate bias depends on these zones.
A clean break above 3,380–3,400 would signal bullish continuation (targeting 3,450+), while a drop below the 3,340–3,350 support zone would shift the bias bearish.
Overall, the market structure on H4 is mixed-to-bullish: we see higher swings in larger timeframes, and only a minor short-term down leg so far. As one analysis notes, gold remains “structurally bullish” and an upside break could chase the $3,500–$3,550 area.
Key Zones and Levels (4H)
Strong Support (Demand) Zone: ~$3,340–$3,355. This zone (around the recent swing lows) has attracted buying. Analysts mark $3,350–$3,355 as a key buy zone. Breaking below ~$3,340 would be a warning, putting 3,300 as the next floor.
Supply Zone / Resistance: ~$3,370–$3,380. This is the near-term resistance cluster (multiple analysts cite 3,370–3,380 as key). A rejection here would keep gold rangebound.
Major Pivot: $3,400. This round number is acting as an important hurdle. A decisive close above $3,400 would open the door to the $3,434–$3,450 area (prior highs). Conversely, failure at $3,400 can push price back toward the support zone.
Larger Resistances: If the uptrend resumes, look to ~$3,450 (April swing high) and beyond. Many long-range targets point to $3,500+ in a strong bull move.
Secondary Supports: Below the main support zone, watch ~$3,300 and down at $3,281 (the 50-day moving average). These act as deeper floors if weakness continues.
4-Hour Bias
In plain terms, as long as $3,340–$3,355 holds as support, the bias tilts bullish or neutral. We can say bullish bias above that zone: buyers will look to enter on pullbacks there. If price stays under $3,370, gains will likely be capped short-term. A break above $3,380/$3,400 would confirm a bullish breakout. On the flip side, a break below $3,340 shifts us to a bearish bias, with attention turning to lower support levels. On indicators, shorter-term momentum has eased (recent RSI is flattening around 60), suggesting some fatigue. But the longer-term trend is up, supported by strong safe-haven demand (central bank buying, geopolitical risk).
In summary: neutral-to-bullish on 4H, favor buyers near support but cautious near overhead supply.
Intraday (1H) Setups
Zooming into the 1-hour chart, we look for trades that align with the above bias. The clearest setups involve buying around demand zones and selling near supply areas:
Buy the Dip (~$3,344–$3,355): Wait for gold to dip into the 3,340–3,350 area. If you see a bullish price-action signal (e.g. a clear hammer or bullish engulfing candle), that’s a potential buy. Place a stop just below (~$3,335). Initial targets are around $3,370–$3,380 (near resistance). For example, one analysis suggests: “Buy XAU/USD at 3,344–3,348, TP 3,365–3,370, SL 3,335”.
Sell the Rally (~$3,375–$3,380): If price runs up to $3,375–$3,380 and shows signs of stalling (e.g. bearish candle), consider a short. Stop would be just above (~$3,385), with a target back down toward $3,355–$3,360 or the 1H demand zone. (One example from analysis: “Sell XAU/USD at 3,375–3,380, TP 3,355–3,360, SL 3,385”.) This aligns with fading the high of the range.
Breakout Strategy: If momentum is strong and gold breaks convincingly above ~$3,380–$3,400 on the 1H, one can enter long on the breakout. The next resistances are ~$3,434 and $3,450.
Stops should be very tight in that case (just under the breakout candle).
Risk Management: Keep position sizes small (1–2% risk). Use stops under/above the structural levels. Always wait for a clear 1H candle signal before pulling the trigger, to avoid false moves.
Key 1H levels: We can cite the strong short-term zones: support ~$3,344–$3,348 and resistance ~$3,375–$3,380.
If price skims these areas, watch carefully for a signal to buy or sell as described above. If 1H breaks below $3,340, be ready for a move toward the lower demand zone (around $3,335) or even $3,300–$3,280.
Takeaway
Gold is currently trading between ~$3,340 and $3,380 on the 4H chart. The simplest guidance is to trade the range: buy on dips near $3,340–$3,355 with stops just below, aiming for the $3,370–$3,380 area, and sell near $3,375–$3,380 if rallies stall. Maintain a bullish tilt as long as that $3,340+ support holds, but be ready to switch bearish if gold decisively closes under ~$3,340.
Single Takeaway: Treat ~$3,340–$3,355 as a key demand zone – a bounce here would be a high-probability long entry (targeting $3,370–$3,380), whereas a break below would turn the bias lower.

Gold Spot / U.S. Dollar (XAU/USD) 4-Hour Chart4-hour chart displays the price movement of Gold Spot against the U.S. Dollar (XAU/USD) from early June to mid-June 2025. The price, currently at $3,350.76, has experienced a recent decline of $19.76 (-0.59%) as of 01:06:10. The chart highlights a downward trend with a shaded area indicating a potential support or resistance zone between $3,310.41 and $3,374.21. Key price levels are marked, showing fluctuations between $3,300.00 and $3,374.21 over the observed period.

XAUUSD Analysis todayHello traders, this is a complete multiple timeframe analysis of this pair. We see could find significant trading opportunities as per analysis upon price action confirmation we may take this trade. Smash the like button if you find value in this analysis and drop a comment if you have any questions or let me know which pair to cover in my next analysis.

Choppy Gold Action Hides a Bigger Drop on Weekly Chart?After Monday’s correction, Gold continued lower – but the drop has been extremely choppy, making swing trading nearly impossible in this environment.
🔄 Short-term vs. Weekly Picture
On the 1H chart, price action is messy and directionless. However, the weekly chart tells a clearer story – which is not bullish at this moment.
❗ Let’s not rush into the “new ATH” narrative
Last week, I pointed out around the 3360 zone that we may get a rise above 3400. That move happened – but it seems more driven by Middle East tensions than by any structural strength in Gold itself.
📉 Why I’m leaning bearish on higher timeframes at this moment:
• This week’s price action almost fully negates last week’s strong green candle
• A close near the bottom of the range could form a Dark Cloud Cover pattern – a strong bearish signal
• Unless we see a reversal above 3400, downside remains the higher probability
📌 Next Target?
If the weekly close confirms this bearish setup, a drop to 3150 is not only possible – it’s becoming likely.
Disclosure: I am part of TradeNation's Influencer program and receive a monthly fee for using their TradingView charts in my analyses and educational articles.

GOLD H1 Intraday Chart Update For 20 JUNE 25Hello Traders we are now at closing day of the week, for today market expected is in tight range and better to wait for closing of the week
strong resistance for the day is 3382 level while strong support for the day is 3333
scalping range for today is 3340-3375
Disclaimer: Forex is Risky

Gold Broke Out – Another Drop Loading?OANDA:XAUUSD TVC:GOLD Gold is attempting a rebound but faces strong resistance near $3,364–$3,368, where previous support converges with the descending trendline (TL1). A clear rejection here could resume the bearish momentum.
Technically, the price is hovering just below the TL1 resistance. The zone around $3,368 is critical — if bulls fail to reclaim this area, we could see a move back toward the $3,326 support, with a deeper target near weekly support at $3,310.
📉 A rejection around current levels = high probability drop
📈 Break and hold above TL1 = potential short-term reversal
🧠 Macro Check:
Despite intensifying Middle East tensions (Israel-Iran conflict escalating, Trump weighing intervention), gold remains under pressure. The Fed’s hawkish hold, persistent inflation, and a strong dollar continue to weigh on bullion in the near term.
🔍 Key Levels:
Resistance: $3,364–$3,368 (structure + TL1)
Support: $3,326 / $3,310
Bias: Bearish below $3,368
Setup Idea: Watch for rejection near resistance for short setups toward $3,326 and $3,310

Gold Pullback in Uptrend Amid Middle East Tensions: Buy the Dip?📊 Clearly visible on the chart: current pullback within an uptrend.
🔍 News paradox: Despite escalating Middle East tensions 🌍, gold is trending lower—a key reason to emphasize buying the dip recently (watch out for bear trap scenarios 🚫📉).
💡 Trading logic breakdown:
Fed statement yesterday caused minimal volatility (market expectations priced in 💨);
This week’s pattern: Asian session rallies 📈 followed by post-Asian pullbacks 📉;
Entry strategy: Use Asian session highs as resistance reference for entries 🎯.
Technical reinforcement:
Risk alert: Geopolitical bullishness ignored → classic bear trap signal (bear trap 🚫);
Timing: Asian session highs form intraday resistance 🎯—look to enter on retracement.
Chart says it all—normal pullback in an uptrend 📊. Ironically, while Middle East conflicts should be gold-positive 🌍, prices are moving lower—a textbook 'buy the panic' setup 🚀. Following this week’s playbook 📅 (Asian session highs followed by dips), focus on Asian session highs as a resistance anchor for entries
⚡️⚡️⚡️ XAUUSD ⚡️⚡️⚡️
🚀 Buy@ 3345 - 3355
🚀 TP 3370 - 3380
Accurate signals are updated every day 📈 If you encounter any problems during trading, these signals can serve as your reliable guide 🧭 Feel free to refer to them! I sincerely hope they'll be of great help to you 🌟 👇

Gold Hits PRZ with RD-! Time for Bears to Take Over?Gold ( OANDA:XAUUSD ) attacked the Resistance zone ($3,445-$3,406) once again, forming an Ending Diagonal at the top of the structure.
Although price reached the Potential Reversal Zone (PRZ) , the presence of Regular Divergence (RD-) between the last two peaks could indicate the weakening of bullish momentum .
In terms of Elliott Wave theory , we can clearly count a completed 5-wave structure , with an Ending Diagonal pattern . This supports the idea of a major correction starting soon .
I expect Gold to attack the lower lines of Ending Diagonal , and if it breaks, it could drop to at least $3,333 . The Second Target could be the Support zone ($3,451-$3,120) .
Do you think Gold will make a new All-Time High(ATH) again in this rally?!
Note: Stop Loss (SL) = $3,463
Gold Analyze (XAUUSD), 2-hour time frame.
Be sure to follow the updated ideas.
Do not forget to put a Stop loss for your positions (For every position you want to open).
Please follow your strategy; this is just my idea, and I will gladly see your ideas in this post.
Please do not forget the ✅ ' like ' ✅ button 🙏😊 & Share it with your friends; thanks, and Trade safe.

buy in GOLD ??After gold reached a strong support area and was successfully confirmed, I think it is good to take a buy trade.

Continue to short gold after the reboundGold has currently hit a low of around 3347, and rebounded after slightly breaking through 3350. It has now rebounded to around 3370. Will gold continue to rebound and hit 3400 again?
I think it is unlikely that gold will continue to rebound and hit 3400 in the short term. From a fundamental perspective, many of the news leaked out about the situation in the Middle East are untrue, and the conflict has not escalated further, so gold has not reacted much to this; and as market expectations for interest rate cuts decrease, the impact of news supporting gold's upward trend is gradually weakening;
From the current structure, since gold fell below 3370, bears have completely taken the upper hand. Although gold has rebounded from around 3347, it is only a short-term technical repair and oversold rebound from a structural perspective, and it cannot be said that it is a restart of bulls. So I think gold still has the risk of a second decline after the rebound, and once gold falls again, it may trigger a large number of profit-taking orders and a large number of short-sellers to enter the market.
As the center of gravity of gold shifts downward, the short-term resistance area moves down to 3380-3390; the current support area below is near 3350, followed by 3335. So for short-term trading, I still prefer gold short trading, and we can continue to short gold with this short-term resistance area.

Fed Rate Decision: Gold's 3,400 Threshold as Bull-Bear DivideToday, the market has consolidated in a range throughout the day, with neither price direction nor volatility breaking through the range. However, our trading approach proved accurate: short positions were initiated near 3,400 during rebounds, and long positions were entered near the key level of 3,370 during pullbacks. Investors following our strategy have achieved profits from both directions. With limited price movement currently, the Fed's interest rate decision due to land in an hour will become the core variable dominating the market trend for the rest of the month.
Currently, gold prices continue to trade below the 3,400 threshold, maintaining a weak market structure. The 3,400 level serves as a key watershed between bulls and bears, and the validity of its breakthrough will determine the trend inflection point: if prices effectively hold above 3,400 after the data release, it indicates that gold will break out of its weak pattern, with the potential for an accelerated rally ahead. Conversely, if prices remain suppressed below 3,400, it is highly likely to trigger further downward exploration. It is recommended to closely monitor the breakthrough signal at the 3,400 threshold after the data release, using this as the operational basis for trend switching.
XAUUSD
buy@3370-3380
tp:3400-3420-3450
Investment itself is not the source of risk; it is only when investment behavior escapes rational control that risks lie in wait. In the trading process, always bear in mind that restraining impulsiveness is the primary criterion for success. I share trading signals daily, and all signals have been accurate without error for a full month. Regardless of your past profits or losses, with my assistance, you have the hope to achieve a breakthrough in your investment.

XAUUSDAnother trade for today is once again from Gold—no surprises there! 😊
My strategy has just signaled a buy opportunity on the precious metal, and I wanted to share this setup with you as well.
🔍 Trade Details
✔️ Timeframe: 15-Minute
✔️ Risk-to-Reward Ratio: 1:2
✔️ Trade Direction: Buy
✔️ Entry Price: 3374.92
✔️ Take Profit: 3384.32
✔️ Stop Loss: 3370.21
🔔 Disclaimer: This is not financial advice. I’m simply sharing a trade I’ve taken based on my personal trading system, strictly for educational and illustrative purposes.
📌 Interested in a systematic, data-driven trading approach?
💡 Follow the page and turn on notifications to stay updated on future trade setups and advanced market insights.

Accurately grasp the interest rate trend, today's gold layout📰 Impact of news:
1. The interest rate remains unchanged and leads to new lows in the short term
2. Geopolitical tensions provide support for risk aversion
📈 Market analysis:
I told you yesterday that 3363 is not the recent low. Today's lowest point has reached around 3347. The current day's K-line closed with a medium-sized negative line with balanced upper and lower shadows. The shape shows that gold will fluctuate in the short term and be bearish. Therefore, it is not suitable to blindly guess the bottom in the short term. As geopolitical tensions still exist, it is expected that the lowest level may reach 3330. During the day, focus on the upper resistance range of 3380-3390. If the rebound is blocked, try to intervene with short orders. The lower support is at the key level of 3330-3320. Pay attention to the defense of the support area.
🏅 Trading strategies:
BUY 3335-3325
TP 3360-3380-3390-3400
SELL 3375-3385
TP 3365-3355-3345-3300
OANDA:XAUUSD FX:XAUUSD FOREXCOM:XAUUSD FXOPEN:XAUUSD TVC:GOLD

XAUUSD Drop to daily support?XAUUSD After testing the daily resistance market has managed to reject with a momentum to daily 20ema early today. As we can see series of lower low and lower highs, price may continue to drop to daily 20ema again as, from weekly perspective we can see that price is pushing down to potentially to weekly key level of resistance.

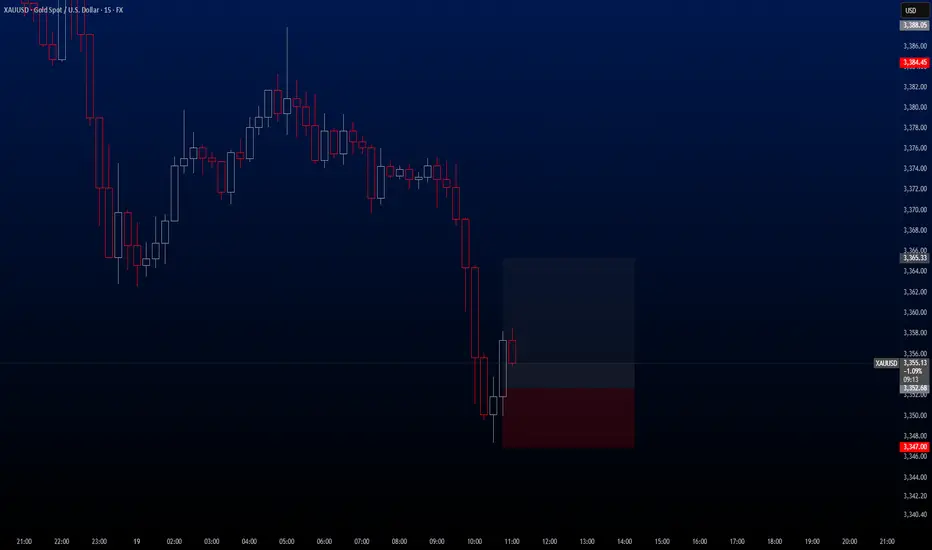
XAUUSD Hello traders,
There is a great opportunity for a buy trade on the XAUUSD pair, and I wanted to share it with you as well.
🔍 Trade Details
✔️ Timeframe: 15-Minute
✔️ Risk-to-Reward Ratio: 1:2
✔️ Trade Direction: Buy
✔️ Entry Price: 3352.68
✔️ Take Profit: 3365.33 / TP 2 / 3369.93
✔️ Stop Loss: 3347.00
🔔 Disclaimer: This is not financial advice. I’m simply sharing a trade I’ve taken based on my personal trading system, strictly for educational and illustrative purposes.
📌 Interested in a systematic, data-driven trading approach?
💡 Follow the page and turn on notifications to stay updated on future trade setups and advanced market insights.
Gold Slips Below Key Support – Is $3,326 Next?OANDA:XAUUSD TVC:GOLD Gold has broken beneath the $3,365–$3,369 support zone, which now aligns with descending trendlines TL1 and TL2 acting as resistance. The 30-minute chart confirms a clean bearish breakout and retest, signalling potential continuation toward lower support near $3,326.
🎯 Short Setup
Entry: $3,365 (retest of broken support / trendline confluence)
Stop: $3,375 (above TL2 and intraday highs)
Target 1: $3,330
Target 2: $3,326
R:R: ~1:3.95
📊 Technical Context
• Price is capped below the $3,365–$3,369 supply zone
• Trendline resistance (TL1, TL2) remains intact from mid-June
• Structure favours continuation lower as long as price stays beneath the retest zone
🌐 Fundamental Backdrop
• Fed held rates steady, but Powell’s tone remained hawkish, warning of “elevated inflation” — supporting USD strength
• Rising Middle East tensions (Israel-Iran conflict) offer safe-haven bids, but not enough to break resistance
• Trump’s tariff threats and criticism of Fed policy add macro uncertainty — mildly supportive of gold in the longer run
📘 Trade Bias
As long as gold holds below $3,365, the bearish thesis remains intact. A sustained push above $3,375 would invalidate the setup and signal a potential reversal or breakout retest.
⚠️ Disclaimer
This analysis is for educational purposes only. Always do your own research and consult a licensed advisor before making financial decisions.

Gold Spot Price Analysis (4-Hour Chart)4-hour candlestick chart for the Gold Spot price in U.S. Dollars (XAUUSD). The chart shows a recent downward trend with a notable dip, followed by an upward correction. A technical analysis pattern is highlighted within a green rectangle, indicating a potential bullish reversal. The current price is $3,374.76, with a decrease of $13.40 (-0.40%). The chart provides insights into short-term price movements and potential trading opportunities.

Gold- Back to 3300 again?After Monday’s correction into the 3380 support zone, Gold entered a consolidation phase. Bulls attempted to push higher but failed to reclaim the 3400 resistance area.
❓ Is this just the beginning of a deeper leg down?
🔻 Why further downside is likely:
• Price broke decisively below the 3380 horizontal support just hours ago
• The market is now trading around 3365, confirming bearish momentum
• 3400 remains unbroken on the daily chart – keeping the downward pressure
📌 Trading plan:
As long as we don’t see a daily close above 3400, I’m selling rallies. A test of the 3300 level is very likely if current pressure continues.
Disclosure: I am part of TradeNation's Influencer program and receive a monthly fee for using their TradingView charts in my analyses and educational articles.

GOLD H1 Intraday Chart Update For 19 June 2025Hello Traders,
For today market still stuck in between 3350 to 3400 Psychological levels we still need to wait for clear breakout of 3400 level
Today scalping range is 3360-90 but remember must placing SL
if market goes below 3350 clearly then it will move towards 3321 Major Support level
Reminder: There is Bank Holiday in US
Disclaimer: Forex is Risky

Data is stable. Will the price go down?Information summary:
The Fed kept the benchmark interest rate unchanged at 4.25%-4.50%, and did not make a rate cut decision for four consecutive meetings, which was in line with market expectations. The Fed said that uncertainty about the outlook has eased, but it is still at a high level. The Fed lowered its GDP forecast for 2025 to 1.4%, while raising its inflation forecast to 3%.
The Fed kept interest rates unchanged, which may suggest that the pace of future rate cuts will slow down.
Market analysis:
From the current 4-hour chart:
The price has fallen below the key support level of 3380. If it returns to below 3370 again, it is very likely to reach today's low. The low point of the downward trend is at the extreme position of 3350-3330.
From the hourly chart, the downward range has also been broken. The early rebound in the Asian market also failed to stabilize above the support level. Then from the hourly Fibonacci, the 0.382 position below is around 3350.
Therefore, if it goes down, the first target is also around 3350.
Operation strategy:
Short around 3380, stop loss at 3390, profit range 3350-3330.

How to trade the Fed's interest rate decision!In nearly an hour, the Fed will announce the Fed's interest rate decision and a summary of economic expectations;
In nearly an hour and a half, Powell will hold a monetary policy press conference.
If the Fed's policy statement or the latest forecast shows a dovish tendency, it may resume the downward trend of the US dollar, thereby supporting the upward trend of gold; and the recent mild inflation and weak employment data in the United States may prompt the Fed to soften its previous assessment, thereby strengthening expectations of interest rate cuts and providing support for gold prices.
From the current technical structure, gold maintains a volatile and anxious market during the day, and there is no clear direction in the short term, but gold is currently always below 3400, and the overall market is still in a weak trend; but gold has repeatedly touched the 3375-3365 area and can quickly recover, proving that there is still strong buying support below; in fact, it stands to reason that if gold is really weak, it should have continued to fall and touched the 3360-3350 area, but gold did not touch the area as expected, but used sideways trading to exchange time and space, and there was no sign of any downward breakthrough, so gold is likely to choose an upward direction.
In addition, the Middle East geopolitical crisis, global economic uncertainty, intensified trade frictions and rising inflation expectations will all provide structural support for gold. So if gold does not fall below the 3365-3355 area today, we will be bullish on gold first; but if gold cannot break through the 3410-3420 area in one fell swoop during the rise, then we need to be careful of the trend of gold rising and then falling.
As for how to trade the news next: the Federal Reserve interest rate decision. The above are my trading ideas and opinions, you can read them carefully and use them as a reference! If you still want to trade news after careful consideration, please be sure to set SL during the transaction to protect your account to the greatest extent!
