Watch Out for Weekly-Level ResistanceAs news of Israel's strike on Iran’s nuclear facility continues to spread, a surge in risk-off sentiment has driven noticeable gains across safe-haven assets. The escalation of tensions in the Middle East has clearly become a key trigger for current market sentiment. Should the conflict intensify further, oil and other safe-haven assets may see continued upside; conversely, if tensions ease, the retreat of risk aversion could lead to price corrections.
From a technical perspective, gold is currently facing downward pressure from the weekly trendline. If geopolitical tensions persist, gold may potentially rally toward the 3500–3550 range. However, without stronger fundamental support, a significant correction could follow once that level is reached.
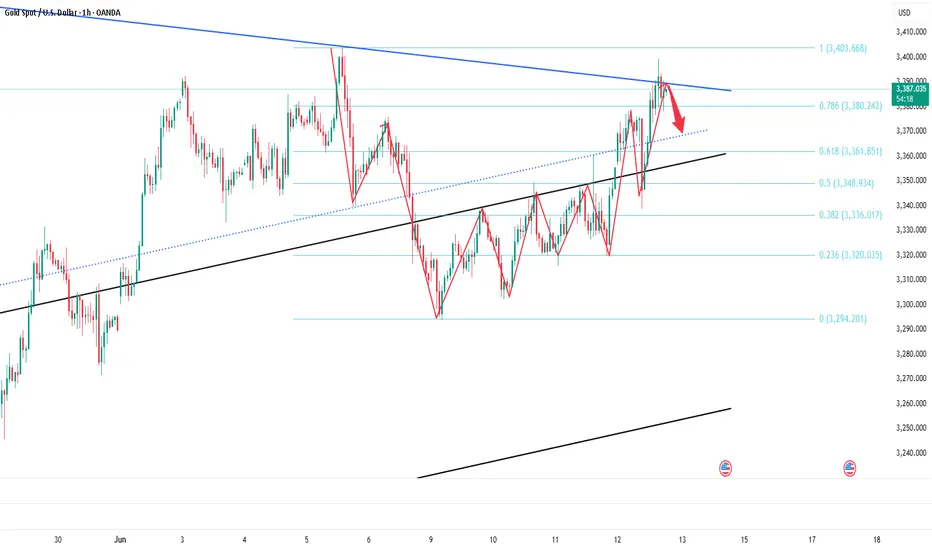
On the intraday chart, the price has now broken below the middle Bollinger Band on the 30-minute timeframe and is near lower band support around 3413. MACD and moving average alignment suggest there may still be room to test the 3396–3388 trend support zone. The 1-hour chart remains in a consolidation phase, and while a short-term rebound is possible, selling at higher levels appears to be the safer strategy for today.
As it is Friday and given the geopolitical uncertainties, the potential for weekend risk is significantly higher. It is recommended to reduce exposure before the market closes. If you choose to hold positions over the weekend, be sure to set appropriate stop-losses to mitigate unexpected developments.
Xauusdsignal

The situation escalates, and gold rises again.Information summary:
Israel issued a statement: The attack on Iran has been completed. All Israeli Air Force pilots and crew members who participated in the attack on Iran returned to the base unscathed.
Iran issued a statement: The attack could not have happened without the coordination and permission of the United States. The United States is responsible for the consequences of the Israeli air strikes.
The unpredictable international situation has caused the price of gold to continue to rise after retreating.
New forecast:
After a strong rebound in the 3338 shock area and forming a high point, it is currently in a clear upward channel. The recent breakthrough of the 3398.4 area indicates that the trend will continue and point to the resistance line near 3465. At present, the price is testing the trend line that broke above, which may become a springboard for the next round of rise.
Buy trigger point: rebound from near 3405, with strong trading volume.
Risk attention:
The possibility of triggering a false breakout trap near 3440.
If gold loses the 3380-point trend line, its momentum may stagnate.
Broader macro data could overtake technical support near resistance levels.
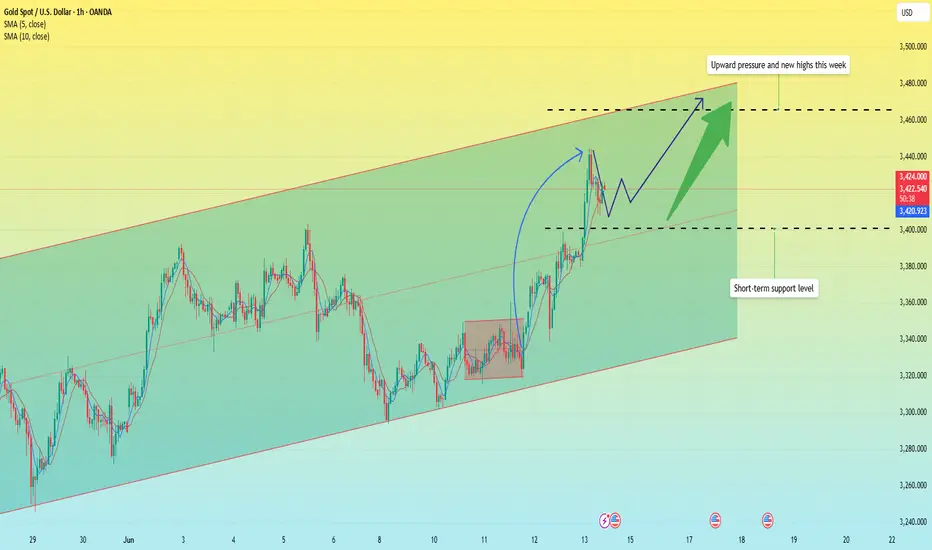
Gold Trading Strategy–June 13During the Asian session, spot gold broke through the $3,400/ounce mark, reaching a high of around $3,444, setting a recent record high.
✅Fundamental Analysis
🔹Tensions in the Middle East have escalated sharply. Iran launched drone attacks on Israel, while conflicts continue along the Syria–Lebanon border. U.S. military bases have entered the highest state of alert.
🔹The market is closely watching the security of the Strait of Hormuz — a key route that handles about 20% of global oil transport. Any escalation or disruption could lead to surging oil prices and safe-haven demand, triggering a synchronized rally in crude oil and gold. In response, some sovereign wealth funds and central banks have urgently increased their holdings of physical gold.
✅Technical Analysis
🔸Gold has successfully broken through the critical $3,400 psychological level, confirming the continued strength of bullish momentum. The price structure remains within a strong upward trend channel dominated by the bulls.
🔸The moving average system shows a bullish alignment;
🔸Bollinger Bands are expanding upward, with price candles holding firm near the upper band;
🔸The MACD lines remain in a bullish crossover with increasing momentum bars;
🔸The KDJ indicator is in overbought territory — suggesting potential short-term pullbacks due to overheating risks.
🔴Key Resistance Levels (Short-Term)
🔰Initial resistance: 3,445 (dense previous high zone);
🔰If this level is broken, it could open further upside potential, targeting the 3,450–3,485 range.
🔰In the event of further geopolitical escalation and global market panic, gold may surge toward the 3,600 psychological level.
🟢Key Support Levels (Short-Term)
🔰Critical intraday support lies in the $3,410–$3,400 zone. A successful pullback and hold above this range would present a strong buy-the-dip opportunity;
🔰Deeper support lies in the $3,371–$3,360 area. A break below this range may trigger a short-term technical correction, with potential downside toward $3,330.
✅Intraday Trading Strategy
🔰If the European session pulls back to the $3,410–$3,400 support zone and holds, consider entering long positions; Initial upside target: $3,440;
🔰If gold holds above $3,420 ahead of the U.S. session, bullish momentum is expected to continue.
⛔Risk Management
If there are signs of easing geopolitical tensions or short-term profit-taking, gold may see a rapid retracement. Pay close attention to the $3,371 and $3,360 support levels for potential defense zones.
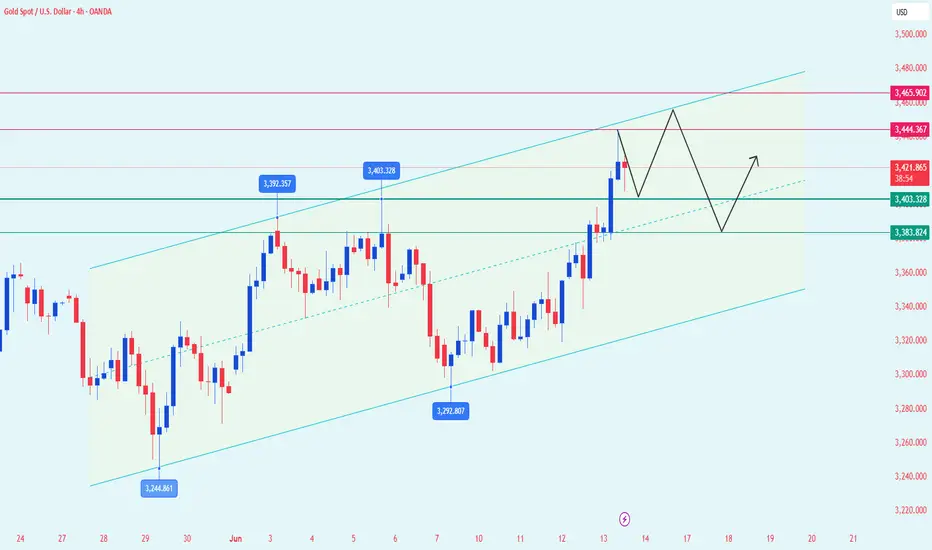
Gold Bull Run: Wave 5 on the Way!
Elliott Wave Setup – We're in Wave 5, riding a powerful upward channel from the recent Wave 4 low, aiming for ~$3,500–3,600
Key Resistance & Breakout – The $3,497–3,500 area is critical. A clean breakout above this could open the next leg toward ~$3,600–3,700, echoing forecasts from ANZ and Cantor .
Support Level – Immediate support lies around the $3,392 area (recent resistance turned support). A dip back to $3,420–3,440 could provide a strong buying opportunity.
Macro Drivers – Geopolitical tensions (especially in the Middle East) and a soft U.S. dollar are fueling safe-haven buying, matching broader bullish sentiment
.
📈 Outlook: Minor pullback expected, then resumption of rally. Breakout above $3,500 could trigger the next surge.
🛡️ Strategy Tip: Consider buying on dips around $3,420–3,450 with resistance-based stop-loss and targets at $3,500 then $3,600–3,700.

GOLD Intraday Chart Update For 13 June 25Hello Traders,
First of all congratulations to all of you as 3430-40 zone GAP filled today but sad new is war scenarios resume
so advise for you is take limited risks
all eyes on 3450 Psychological level breakout, intraday expected range is 3400-3450 if markets break 3450 then it will move towards 3480
if market breaks 3400 successfully then it will move back towards 3370 or even 3355
Disclaimer: Forex is Risky

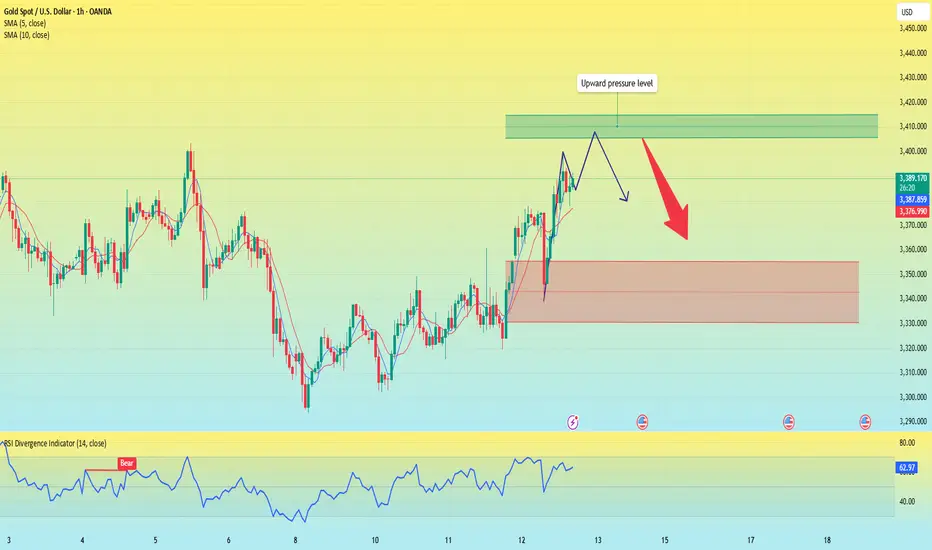
Stick to shorting gold and aim for the target area.Gold has not broken through 3400 after accelerating its rise, and the upper suppression effect still exists; currently gold is fluctuating in a narrow range below 3390, showing signs of stagflation to a certain extent. Therefore, the accelerated rise of gold is not for the short-term impact of 3400, but for a deep retracement, eliminating more scattered funds in the market by sweeping up and down.
So in the short term, I think it is difficult for gold to continue to break upward under the suppression of the resistance area near the short-term high of 3402, but to test the lower support area of 3375-3365 before breaking upward. So I have shorted gold as scheduled according to the short trading plan mentioned above, and aimed at the lower target area of 3375-3365.
At present, our short position has made a certain profit, but I still look forward to profiting from gold hitting TP! Let us look forward to gold falling back to the target area as expected!
The situation escalates. Will the price of gold continue to riseEvent summary:
On June 13, Israel launched an air operation codenamed "Lion Rising" against Iran. So far, five rounds of air strikes have been launched.
As the situation in the Middle East escalates, gold has risen again due to risk aversion, directly breaking through 3,400. Gold risk aversion has increased, and there is no sign of easing for the time being, so gold risk aversion continues to rise, and gold prices are expected to continue to rise. Under the blessing of risk aversion, gold bulls have begun to dominate again.
Market analysis:
The 1-hour moving average of gold has formed a golden cross and formed an upward trend. The upward momentum of gold is getting stronger and stronger. In the early Asian session, it once surged above $3,440, only $60 away from the historical high of 3,500. The outbreak of risk aversion is entirely the release of accumulated kinetic energy. Only when it is fully released can the strength of gold bulls weaken. The decline of gold means going long. If the price of gold falls back to the support level near 3,400 during the Asian session, buy on dips.
Focus position:
First support level: 3405, second support level: 3390, third support level: 3380
First resistance level: 3440, second resistance level: 3450, third resistance level: 3470
Operation strategy:
Long strategy: Buy near 3405, stop loss: 3395, profit range: 3430-3450;
Short strategy: Buy near 3455, stop loss: 3465, profit range: 3400-3380;
If you want to trade aggressively, you can buy at the current price and wait for the price to reach a high point near 3350.

Fakeout or Takeoff? Gold Retakes 3350 Before NY Close1. Recap of Yesterday's Move
Yesterday was a volatile day for Gold. Price initially broke above the key 3340–3350 resistance zone, only to drop back below it—but intriguingly, it closed above it on the New York session. That close is the detail that changes everything.
2. Key Question: Will Gold Stay Above 3400 and Push Toward New ATHs?
Let’s split this into two scenarios:
________________________________________
🟢 Bullish Scenario – Buy the Dip?
• The short-term structure is undeniably bullish.
• The reclaim of 3340–3350 is not a fakeout, but a clean signal of strength.
• If momentum holds, we can expect price to push toward 3405 and then 3435.
• As such, the strategy remains: buy dips, targeting those key levels.
________________________________________
🟡 Long-Term Breakout? Not So Fast
• Yes, the higher lows at 3120, 3250, and 3295 suggest that the correction from 3500 may be over.
• A clean breakout and stabilization above 3400, ideally near 3430, could signal a path toward a new all-time high.
• ❗ However, volatility remains wild, and if geopolitical tensions de-escalate or trade tariffs get resolved, Gold could see a sharp drop of 1500–2000 pips, as part of a broader risk-off unwind. Peace and stability could hurt safe-haven demand.
________________________________________
📌 Trading Plan
• Short-term: Buy dips while above 3340-3350 (ideally on a re-test), aiming for 3405 and 3435.
• Long-term: Stay flexible. Wait for confirmation above 3430 before going for the ATH narrative.
________________________________________
💡 Conclusion
Technically, Gold is bullish in both the short and long term. But with global uncertainty in play, don't ignore the fundamentals. Trade the chart, but respect the world around it. 🚀
Disclosure: I am part of TradeNation's Influencer program and receive a monthly fee for using their TradingView charts in my analyses and educational articles.

Gold Market Analysis and Trading Recommendations for TodayYesterday, gold surged then pulled back in a washout move triggered by CPI data, before rebounding again in the evening on news-driven sentiment, closing the daily chart bullish. This morning's opening saw further rally breaking new highs, confirming strong bullish momentum. Today's strategy remains buying on dips with the uptrend.
On the 4H chart, gold stabilized at the mid-Bollinger band before rebounding with consecutive bullish candles. Moving averages are bullishly aligned and Bollinger bands are widening—all signaling strong bullishness. However, as the triangle consolidation range remains unbroken, chasing the rally is unadvised. Focus on dip-buying: key supports at 3,345–3,340 and 3,325; resistances at 3,385 and 3,400, where potential shorting opportunities may be considered based on price momentum.
XAUUSD
buy@3340-3350
tp:3370-3380
Investment itself is not the source of risk; it is only when investment behavior escapes rational control that risks lie in wait. In the trading process, always bear in mind that restraining impulsiveness is the primary criterion for success. I share trading signals daily, and all signals have been accurate without error for a full month. Regardless of your past profits or losses, with my assistance, you have the hope to achieve a breakthrough in your investment.

Gold is rising, will there be a new intraday high?Yesterday, gold closed with an engulfing positive line, and the closing line stood above the 5-day and 10-day moving averages.
From the analysis of gold in 1 hour, the current price is still in a fluctuating upward channel. Based on this technical pattern feature, if the subsequent economic data is positive and pushes the gold price to further strengthen, it may form a trading opportunity for shorting at a staged high. Although the gold price showed a rapid upward trend after the data was released, there has been obvious resistance in the historical trading concentration range of 3400-3410. The current bullish momentum has no technical conditions to break through this position, and the technical correction after the price surge is in line with the price behavior logic.
The current price has reached a high of around 3398. After today's rise, there is not much room for upward movement; since the market is rising in a volatile manner this week, it is not suitable to chase the rise directly. Although the 4-hour Bollinger Band opening continues to diverge upward and the moving average is arranged in a bullish pattern, the upward momentum is slightly insufficient and may be under pressure to move downward near 3410. I suggest that all traders short at high levels.
Operation strategy:
Short around 3410, stop loss at 3420, profit range 3360-3355. If it breaks through 3355, it may hit the intraday low below 3340.
Gold Correction = Bearish Divergence + Wedge + Zigzag CompleteGold ( OANDA:XAUUSD ) attacked the Resistance zone($3,387-$3,357) today after the release of the US CPI indices . Although the figures seemed to be in gold's favor, traders still seem to be determined to continue the price correction.
In terms of Elliott Wave theory , it seems that Gold has managed to complete the Zigzag Correction. We should wait for the next 5 down waves .
Also, we can see the Regular Divergence(RD-) between Consecutive Peaks .
In terms of Classic Technical Analysis , Gold appears to have successfully formed a Rising Wedge Pattern .
I expect Gold to drop to at least $3,296 AFTER breaking the lower line of the Rising Wedge Pattern .
Note: Stop Loss(SL)= $3,380
Gold Analyze ( XAUUSD ), 1-hour time frame.
Be sure to follow the updated ideas.
Do not forget to put a Stop loss for your positions (For every position you want to open).
Please follow your strategy; this is just my idea, and I will gladly see your ideas in this post.
Please do not forget the ✅' like '✅ button 🙏😊 & Share it with your friends; thanks, and Trade safe.

Great analysing from smart analysis This Wyckoff Accumulation scenario on Gold was like a blueprint—every stage played out almost exactly as anticipated. From the Selling Climax (SC) to the Spring and Test, it was as if the market followed the textbook. Watching this unfold live last night was both thrilling and affirming. Truly, it was a masterclass in market behavior.
Analysis : mohsen mozafari nejad 😎

6/12 Gold Analysis and Trading SignalsGood morning, everyone!
Gold rebounded after dipping to around $3320 yesterday, following a pullback from our previously defined sell zone (3358–3373). Early today, price broke above 3360, reaching a high of 3373, exactly within the resistance zone we expected. The initial rejection from this level aligns well with our plan.
📈 Technical Analysis:
Watch closely whether 3373 can be broken with strong volume. If so, the next key resistance lies around 3385.
However, if price reaches this level without first testing the 3352–3346 support, a rejection is likely. In such case, 3385 may serve as a temporary top and a potential short entry point.
🧭 Trend Structure:
On the 4H timeframe, the bullish momentum remains intact. The last two candles suggest strong buying pressure. If today's fundamentals are supportive, a test of 3400 or higher is possible.
On the 1D chart, the market is still in a technical correction phase. The bounce near 3300 was supported by the long-term trendline. However, if price drops back below 3340 and stays there, a trend reversal becomes more likely.
Focus on the 3314–3296 support zone. If that breaks, a deeper drop is likely, possibly $100 or more, pushing price toward 3200–3190. The decline may unfold as a slow grind or sharp breakdown.
📊 Fundamental Watch:
Today’s Initial Jobless Claims data could have greater-than-usual impact due to the recent CPI release.
The Federal Reserve's Quarterly Financial Accounts Report is also due today and may affect broader market sentiment.
📌 Today’s Trading Recommendations:
✅ Sell Zone: 3385–3403
✅ Buy Zone: 3331–3321
🔄 Intraday Scalping Levels:
3376 / 3358 / 3346 / 3334

Beware of Bear Traps — Avoid Chasing Prices Blindly!Today, gold rallied up to 3380, then retraced to retest the 1H MA60 (around 3340),
before making another strong upward breakout, surpassing the earlier Asian session high.
📌 This upward move was driven by a combination of key factors:
🔸 Trump’s announcement of new tariffs to be imposed within two weeks
🔸 Rising geopolitical tensions in the Middle East, fueling safe-haven demand
🔸 A weaker-than-expected CPI yesterday
🔸 And an upcoming PPI release later today
📉 Current Price Outlook:
🔺 Strong resistance at 3392, closely watched
🔺 Next resistance zone: 3403–3414
🔻 Key support zones: 3360–3350
⚠️ Also note: the 3289 price gap remains unfilled,
which means downside risks haven’t been fully eliminated — avoid chasing rallies blindly!
✅ Trading Strategy:
Stick with the approach:
📌 Buy near key support, sell near known resistance
📌 Stay alert for news-driven bull traps, and manage risk wisely

XAU/USD 4H Updated Technical Analysis 06/12/20254H Market Structure & Trend
Gold (XAU/USD) is trading around $3,383, showing a generally bullish market structure on the 4-hour chart. The price has been making higher highs (HH) and higher lows (HL) – a classic uptrend pattern
Recently, bulls broke above a notable resistance level (a Break of Structure, or BOS), confirming continued upside momentum
So far no Change of Character (CHOCH) signal (which would require a lower low to hint at a trend reversal, meaning the uptrend remains intact. Gold is also trading above its daily pivot point (3370), reflecting a bullish intraday bias
Overall, sentiment on the 4H timeframe is positive unless key support levels give way.
Key Support & Resistance Zones (Demand vs. Supply)
Support (Demand Zones): Immediate support lies in the 3355 – 3340 region (marked by S1 and S2). This zone lines up with prior price congestion and is viewed as a demand zone, where buyers have historically stepped in
In fact, multiple support levels cluster here (e.g. previous lows and trendline intersection), creating a broad buy zone. The idea is that as price dips into this area, buy orders are likely waiting, and the deeper it goes into the zone, the more attractive it becomes for bulls
If 3340 fails, the next support is around 3325 (S3), another potential demand area where gold found a footing earlier. Traders will watch these support zones for bullish reversal signals (like a strong bounce or candlestick patterns) to confirm that demand is indeed active. Resistance (Supply Zones): On the upside, initial resistance is seen at 3385 (R1), with a stronger supply zone around 3400 (roughly the R2 3402 level). Here, multiple technical levels overlap – including a recent swing high and a psychological round number. This convergence of resistances creates a supply zone where sellers may be waiting.
As gold approaches 3385–3402, it’s likely to encounter profit-taking or new short positions. If price does punch through 3400, the next resistance is around 3415 (R3), which could attract even more selling interest. Within the 3385–3415 zone, expect price to possibly stall or reverse, unless bulls muster a strong breakout. Traders should be cautious about bullish positions as price nears this supply area, and watch for any bearish reversal clues (like wicks or a double-top) indicating that sellers are active
Fibonacci Retracement Confluence
Recent price swings show Fibonacci retracement levels aligning with the above zones, adding confidence to those areas. For instance, the rally from the last 4H swing low (around 3325) up to the recent high (~3385) has a 50%–61.8% Fibonacci retracement roughly in the 3340–3355 range. Fibonacci levels often pinpoint where price might stall or reverse during a pullback, and indeed this $3,340-$3,355 support zone corresponds to the popular 50%–61.8% retracement band – a prime spot where bargain-hunting buyers could step in.
In an uptrend, a pullback to these Fib levels is considered a healthy correction rather than a trend change. Thus, if gold dips to that area, many bulls will be watching for a bounce. On the flip side, if gold extends higher, Fibonacci extension levels suggest the 3400+ region might be a measured move target (for example, 100% extension of the last pullback lands near 3400). This reinforces that the 3385–3415 supply zone is a critical hurdle. In summary, Fibonacci analysis supports the idea that mid-$3300s is a value zone for buyers, while around $3400 is a potential exhaustion area for the current upswing.
Smart Money Concepts (SMC) Insights
From a Smart Money Concepts perspective, institutional footprints are visible on the chart. The ongoing bullish structure (higher lows, no lower low yet) means no CHOCH (trend change) has occurred
Smart money likely continues to favor longs until a key low breaks. We can identify a possible bullish Order Block in the 3340 area, which is essentially the last small bearish candle on 4H before the strong push up
This order block (an institutional buy zone) overlaps with our demand zone, suggesting big players placed buy orders around 3340. If price revisits that zone, it could ignite another rally as those orders get filled. There are also liquidity considerations in play: Above $3,400, there may be clusters of buy stop orders (from breakout traders or short stops) – what SMC traders call buy-side liquidity.
It wouldn’t be surprising to see gold spike above 3400 to grab that liquidity (stop-loss hunt) before either accelerating higher or sharply reversing. Conversely, below $3,340, many bulls likely have stop-losses (sell orders) – sell-side liquidity resting under support.
A quick dip under S2 (liquidity grab) followed by a recovery would actually be a bullish signature (a bear trap by smart money). However, if price breaks significantly below 3325 and holds, that would mark a bearish CHOCH (first real trend change signal) and indicate the smart money possibly switching to selling rallies. Until then, the path of least resistance is still up. Any fair value gaps (imbalances) left from the rapid rise may exist around 3360 (for example), but so far gold has been backfilling these moves, keeping the trend steady.
Potential Trading Setups (4H Outlook)
Given the above analysis, here are two possible trade ideas on the 4H timeframe – one bullish and one bearish – with high-conviction zones in focus:
Bullish Buy Setup (Buy the Dip):
A pullback into the 3355–3340 support demand zone could offer a buying opportunity. This area has multiple factors of confluence: pivot S1/S2 supports, a Fibonacci 50–61.8% retracement, and an order block. If gold’s price action shows a clear reversal here (for example, a bullish engulfing candle or double bottom on 1H/4H), buyers can consider going long. The upside targets would be a return to 3385 (R1), with stretch targets near 3400–3415 (R2/R3). A prudent stop-loss could be placed just below 3325 (just under S3 and below the demand zone) to avoid a deeper reversal. This setup aligns with the prevailing uptrend (trading with the trend) and aims to “buy low” in the value zone.
Bearish Sell Setup (Sell the Rally):
If gold surges into the 3385–3402 resistance supply zone without slowing, traders should watch for signs of buyer exhaustion. In a still-range-bound market or if momentum wanes near the top, one might consider a short position in this zone if bearish signals emerge (e.g. a 4H shooting star candle, bearish divergence, or a minor BOS downward on lower timeframe). The idea is that smart money could use the liquidity above 3385/3400 to sell into. Initial downside targets could be the pivot area around 3370 and then the 3355 support. A stop-loss would ideally be just above 3415 (clear of the R3 level), in case gold breaks out to new highs. This counter-trend style trade is riskier since the 4H trend is up, so it’s crucial to wait for confirmation of a reversal before selling. Essentially, you’d be selling high at known resistance, but only if the market shows it can’t push further.
Both setups hinge on patience and confirmation. Rather than blindly picking tops or bottoms, let the price action confirm that the zone is holding. Remember that support and resistance levels are zones, not exact lines – price can wick through slightly before reversing. Always manage risk carefully.
Key Levels Snapshot
Pivot: 3370
R1: 3385 – R2: 3402 – R3: 3415
S1: 3355 – S2: 3340 – S3: 3325 These levels are derived from the classic pivot point formul, using recent price data. The pivot point at 3370 is the average of the previous session’s high, low, and close.
Trading above this pivot supports a bullish bias, while below it turns the bias bearish.
The R1/R2/R3 levels mark successive resistance hurdles above the pivot, and S1/S2/S3 mark support floors below it. Traders often use these as guideposts for intraday moves.
Takeaway:
Gold’s 4H chart shows bullish momentum with key support in the mid-$3300s and resistance near $3400. It’s wise to trade the reaction at these zones – buy dips near support in an uptrend, or sell rallies at resistance if momentum fades. In all cases, wait for price to confirm direction and stick to your trading plan. Happy trading!

XAUUSD:Go long
Gold bottled out and rebounded, hitting the lowest 3319 line, which just gave us the opportunity to leave the 3320 stop profit. Then, under the stimulation of the news surface, it did not break through the 3375 line. Then, combined with the previous ideas, the next need to do long strategy. Keep an eye on the breakout at 3375 during the day.
Trading Strategy:
BUY@3353-58
TP:3375-84
↓↓↓ More detailed strategies and trading will be notified here ↗↗↗
↓↓↓ Keep updated, come to "get" ↗↗↗

Repeated sweeps, gold trend analysis and operation layout📰 Impact of news:
1. Pay attention to the initial unemployment claims data
📈 Market analysis:
Gold price jumped higher in Asian session. The short-term upper pressure is at 3375. Once it breaks, the upward route of bulls will be opened. The RSI indicator in the 1H chart began to retreat after touching the overbought area. Last night's high of 3360 is now a breakthrough, and the previous strong suppression is at 3350. This morning's Asian session was also broken and stabilized. Then 3360-3350 has changed from a suppression position to a support position. Therefore, the next position we should pay close attention to should be around 3360-3350. If it can fall back to 3360-3350 in the future, it is possible to enter the market to do more, but at the same time, it is also necessary to defend 3345. Independent trading requires a SL.
🏅 Trading strategies:
BUY 3360-3350
TP 3370-3380-3400
If you agree with this view, or have a better idea, please leave a message in the comment area. I look forward to hearing different voices.
TVC:GOLD FXOPEN:XAUUSD FOREXCOM:XAUUSD FX:XAUUSD OANDA:XAUUSD
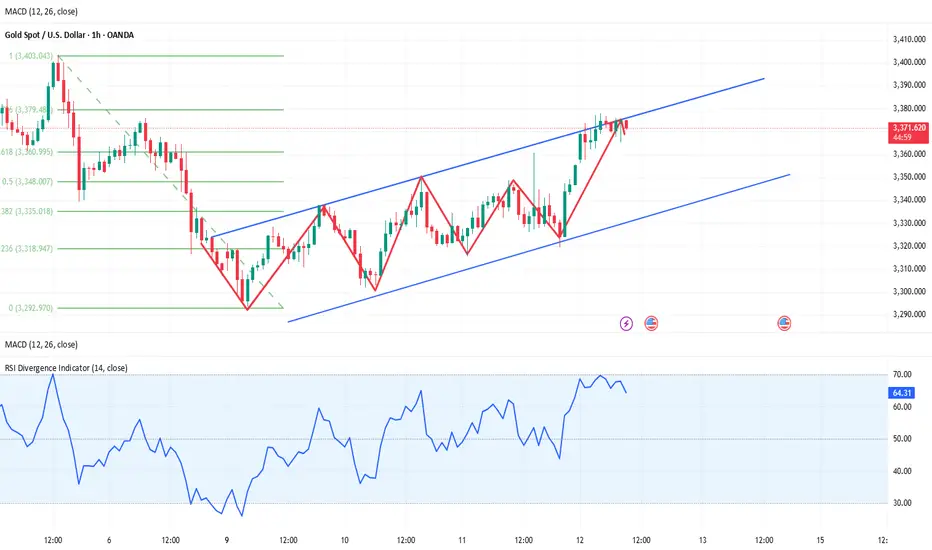
GOLD H1 Intraday Chart Update For 12 June 2025Hello Traders
First of all we have US CPI High Impact event due today
now market is try to testing 3400 Psychological level once it will pass 3380-86 strong resistance zone and once market will break 3400 it will move towards 3423
3350 Psychological level remains in focus for a while due to retesting RBS zone
overall 334050 zone remain solid Buying Zone for now
Also keep an eyes on US CHINA Tariff news
Middle east tensions are remains watchable for now
Disclaimer: Forex is Risky

XAU/USD Price Action Analysis – June 12, 2025 XAU/USD Price Action Analysis – June 12, 2025 🪙📈
📊 Technical Overview:
The chart presents a clear range-bound market structure with well-defined zones of support and resistance:
📍 Key Levels:
🔴 Resistance Zone: $3,380 – $3,400
Price has been rejected multiple times from this level, as indicated by red arrows. It marks a strong supply zone.
🟢 Support Zone: $3,280 – $3,300
Price has bounced several times from this demand area, forming a reliable support base.
📏 Intermediate Level: $3,319.38
Marked with a purple line, this is likely a mid-range liquidity zone or a previous minor structure level.
🔄 Price Action Insights:
Double Bottom Formation: Notable at the support zone, confirming strong buying interest (highlighted with orange circles and green arrows). This pattern often signals a bullish reversal.
Current Price: Trading near $3,375.645, approaching the resistance area again.
Projected Scenarios:
Bullish Continuation 📈: Break and close above the resistance could trigger momentum to the upside — watch for a breakout with strong volume.
Pullback Scenario 🔁: A rejection from resistance could cause a retest of $3,319.38 or even the support zone, forming a higher low before a potential rally.
🧠 Strategy Outlook:
Bullish Bias 🐂 as long as price holds above $3,319.38.
Watch for Breakout 🚀 above resistance with volume confirmation for long entries.
Caution ⚠️ near resistance; ideal to wait for either a breakout or clear rejection.
📌 Conclusion:
The chart reflects accumulation within a range, with bullish structure emerging. A break above $3,400 could shift market sentiment decisively upward, while a failure at resistance invites a deeper pullback.

Gold: Rebounding and Stabilizing Near 3340Gold Market Outlook: Watching Inflation, Technical Pressure Builds
Markets are squarely focused on the upcoming U.S. Consumer Price Index (CPI) release, which could serve as a pivotal moment for shaping Federal Reserve policy expectations ahead of the September meeting. Current market pricing suggests a roughly 52% probability of a rate cut, but this is highly sensitive to how inflation data unfolds. The consensus anticipates headline CPI growth of 0.2% and core inflation at 0.3%. Any deviation—especially a softer reading—could significantly sway sentiment in favor of monetary easing, thereby reinforcing gold’s appeal as a defensive asset.
Beyond the macroeconomic calendar, broader geopolitical undercurrents continue to influence the landscape. Optimism stemming from recent progress in U.S.-China trade discussions has buoyed risk appetite, yet this is tempered by lingering concerns after a court ruling upheld former President Trump’s authority to maintain certain tariffs. This legal development introduces fresh layers of ambiguity, keeping the U.S. dollar on the defensive and lending indirect support to gold prices.
From a technical standpoint, gold remains confined within the narrowing bounds of a symmetrical triangle pattern—a classic sign of consolidation and potential volatility ahead. The price action reflects a broader indecisiveness prevalent across multiple asset classes, as traders await clearer macro signals before committing to directional moves.
Key support lies at 3301, 3330, and 3340, while resistance is seen at 3349, 3361, and 3375. Special attention should be paid to the critical 3330–3340 range, which has acted as a magnet for price in recent sessions. A decisive break and sustained hold above this zone—especially if supported by softer inflation data—could hand the bulls a tactical advantage, opening the door for a push toward higher resistance areas and renewed bullish momentum.
In summary, gold is at a technical and fundamental crossroads. Inflation data will likely determine whether the metal can break free from its current consolidation or remain range-bound amid ongoing uncertainty.

Gold (XAU/USD) Intraday Outlook – 12 June 2025Current Price: ~$3,373 (intraday) –
Gold is holding near recent highs after a sharp rally. Bullish momentum has improved markedly, fueled in part by favorable fundamentals (soft US CPI and geopolitical tensions lifting safe-haven demand)
On the charts, the short-term trend is upward, with buyers firmly in control following a breakout above prior resistance.
4H Trend & Key Levels
4H chart highlighting break of structure, demand (green) and supply (red) zones, and key intraday levels. Note the major demand zone that held around 3,214 (green) and the supply zone near 3,284 (red) which was a focal resistance. The 50% retracement of the prior day’s range (blue line near 3,274) acted as intraday resistance in that earlier session
Such annotations show where institutional activity likely set support (demand) and resistance (supply) areas. On the 4-hour chart, gold’s momentum is strongly bullish. The recent surge to 3375 pushed price above its 10-day moving average and widened the upper Bollinger Bands on both H1 and H4 – signs of a powerful uptrend. This came after gold cleared a major resistance around the $3,350 zone, which had capped prices earlier. With that barrier broken, the next upside target on the higher time frame is the $3,400 level (a notable psychological and technical hurdle)
In fact, it can be projected that a clean breakout above the ~3,380/3,390 zone could open the path toward $3,403 and even $3,430 in extension
Reflecting the next supply areas or Fibonacci extension targets above. Support levels on the 4H are stepping up as the trend rises. Previously, $3,320 (the last day’s high in late May) turned from resistance into support after the breakout. Now, immediate support is seen around $3,345–3,350, which corresponds to the top of the recent consolidation and roughly the 38.2% Fibonacci retracement of this week’s rally
Below that, the $3,330–3,335 zone (around the 61.8% retracement of the rally) is a secondary intraday support area
These levels also align with prior demand zones and the previous day’s lows, making them likely zones where buyers might step in on dips. Overall, as long as gold holds above the mid-$3,300s, the 4H bias remains bullish. The 4H structure shows higher highs and higher lows, and technical signals (price above short-term EMAs and an improving RSI) reinforce the short-term bullish outlook
Educational Note: In an uptrend, old resistance often becomes new support. Here $3,350 was a major resistance in the past and could serve as support if prices pull back. Traders also watch Fibonacci retracement levels within the up-move for potential bounce points – for gold, the 35-50% retracement zone of the latest swing (approximately $3,350 down to $3,330) is viewed as an attractive “buy-the-dip” area intraday.
On the 1-hour chart, gold has been oscillating upward within a rising channel. After each push higher, it has formed brief consolidations or bull flags that resolved to the upside.
For example, after the strong push to ~3375, price coiled in a classic bull flag pattern, hinting at momentum building for another breakout. This pattern of consolidation after a rally shows healthy bullish behavior – buyers pausing before continuing the move. Higher lows (HL) and higher highs (HH) are clearly present, indicating a steady uptrend structure on the 1H
In fact, gold’s price action has been “taking out liquidity then taking out highs and creating new highs,” leaving no sign of bear control so far. This means each time the price dips and grabs some stop-loss liquidity from weak longs, it quickly reverses and surges to a fresh peak – a hallmark of a strong trend supported by larger players. From an SMC perspective, we can spot where institutional traders may be active. Recently, gold retested a major demand zone in the low $3,300s and rocketed higher. Specifically, price dipped to about $3,297 (just below a prior support), which appears to have been a liquidity grab (fake-out) below the obvious support level
Smart money often drives price briefly below such a level to trigger stop-losses, then buys into that liquidity. Indeed, a strong bullish rejection off $3,297-3,300 occurred, indicating aggressive buying (accumulation) by big players at that historical support
This confirmed a solid demand zone, and bulls defended it vigorously – a clear sign that institutional demand underpins that area. After the fake-out and bounce, gold quickly resumed making higher lows, confirming the uptrend’s resumption. Now, the focus shifts to the overhead supply zone. Gold is trading just below $3,380–3,390, a zone that previously acted as major intraday resistance.
In past attempts, price sharply sold off from this area, suggesting it’s a pocket of supply (sell orders) or profit-taking for institutions. This makes $3,380-$3,390 a key decision point: if bullish momentum is strong enough to drive a clean break through this supply, we could see a swift move higher (as mentioned, targets in the low $3,400s become viable)
However, if gold struggles and prints bearish signals (e.g. aggressive wick rejections or a change in character to lower lows on 15m/1H) near 3380-3390, it may indicate that sellers are defending this zone again, potentially causing a pullback. Traders are watching closely to see if smart money will cap the price here or let it run. It’s worth noting that intraday liquidity has built up around certain levels. Minor equal highs around $3,375-3,377 were taken out earlier (as gold hit a weekly high of ~$3,377) ,and now liquidity might reside just above $3,390 (at buy stops of breakout traders) and below $3,340 (sell stops of longs). The path of least resistance intraday appears upward unless those lower support levels start breaking. As long as gold remains inside this rising structure, the bias is to buy dips rather than sell rallies. Only a clear break below the $3,337–3,340 support (recent range floor) would hint at a short-term trend shift down. Until then, bulls are in charge. Educational Note: Order blocks and supply/demand zones are areas where price saw a sharp move, indicating institutional orders. In gold’s case, an H1 demand block near $3,300 (origin of the recent rally) is such an area – price dipped into it and then launched higher
Conversely, the $3,380-$3,390 area is a supply zone from which price fell previously.
Watching price behavior at these zones (e.g. strong rejection vs. breakthrough) gives clues: a heavy rejection implies continued range or reversal, while a breakthrough suggests a new leg of trend.
Trade Setups
Buy on Dip (Bullish Setup):
If gold retraces into the $3,345–3,355 support zone, consider a long entry near ~$3,350 (a key Fibonacci support & prior breakout level)
A suggested stop-loss is just below $3,335 (to stay under the 61.8% retracement and recent swing low). Target the $3,375 area for partial profits, and $3,385–3,390 if momentum continues. This buy-on-dips approach aligns with the prevailing uptrend – as one analyst noted, “Gold below 3350 is an opportunity to buy on dips”
(Rationale: You’re buying at support in an uptrend, aiming for a retest of the highs.)
Sell Near Resistance (Bearish Setup):
If gold rallies toward the $3,390–3,400 zone but shows rejection (stalling candles or a bearish reversal pattern) at that resistance, one can consider a short entry around ~$3,395. Place a tight stop-loss above $3,405 (just beyond the major resistance). Target a pullback to about $3,370 first, and $3,350 on an extended drop. This trade fades a possible near-term top in case the supply zone holds. For instance, a suggested plan from another analyst was to “sell around 3397–3400” with stops above 3409, looking for a move back to the mid-$3,300s
(Rationale: You’re selling at an identified supply zone, expecting a short-term correction.)
Breakout Scenario:
For traders who prefer momentum plays, watch $3,380 on the upside and $3,340 on the downside. A 1H candle close beyond $3,380 with strong volume would confirm a breakout – you could then target ~$3,405 and above (trail stops as it goes)
Conversely, a drop below $3,340 might signal a bearish intraday reversal, opening downside targets near $3,315 and $3,300
If trading the breakout, ensure confirmation (no fake-outs) – wait for a retest if possible, and then ride the move. (This scenario is only for when price definitively exits the current range.)
Remember: The intraday trend is bullish, so lean toward long setups unless key supports break. Keep it simple – trade the price action you see. Gold can be volatile, so it's wise to use stop losses and not over-leverage. Happy trading! 📈✨

Insist on shorting gold on ralliesToday we made a total profit of 350 pips in 2 short trades. First, we shorted gold near 3345, and when gold fell to around 3330, we manually closed the order to lock in profits; the second time, gold rebounded sharply with the help of CPI data, and we seized the opportunity to short gold again near 3360, and ended the transaction by hitting TP: 3340. We accurately grasped the profit of gold shorting.
At present, gold is in a narrow range of fluctuations near the 3330 mark. Relatively speaking, gold is still in a weak position. Although gold has rebounded sharply with the help of the positive CPI data, it has shown a long upper shadow in the candle chart due to the rapid retracement, which has strengthened the resistance above and limited the rebound space of gold in the short term. In addition, the morphological structure shows signs of building a head and shoulders top structure. The resistance area in the short term is 3345-3355; followed by 3360-3370. Although gold is currently in a narrow range of fluctuations near the 3330 mark, it does not show obvious signs of support. It is easy to fall below the area near 3330 in a weak situation. The relatively strong support is in the 3320-3310 area, followed by the area near 3300-3290.
So for short-term trading, I still advocate taking the 3345-3355 area as resistance first and continue to short gold!

Analysis of Current Gold Trends and Trading RecommendationsYesterday, the daily K-line closed as a shooting star Doji with a long upper shadow, confirming a wide consolidation range between 3,300 and 3,350 for gold prices. In the short term, gold stabilizing above 3,250 is expected to maintain a mildly bullish trend within the consolidation, with focus on the 3,345-3,350 resistance zone today.
From a 4-hour perspective, support lies at 3,315-3,320. On pullbacks to this level, long positions can be considered for rebound continuation, while resistance stands at 3,350. The trading strategy remains centered on "buy low, sell high" within the 3,350-3,315 range.
Critical Monitoring: Closely track the progress of Sino-US trade negotiations and today's CPI data release, as both events may exacerbate market volatility and influence short-term trend direction.
