Gold 8H Bullish Reversal Setup After Channel Break. Gold/USD 8H Chart Analysis:
Price has broken below an ascending channel, indicating potential short-term weakness. However, a bullish reversal setup is marked, with a suggested buy zone near current levels (~3339), targeting the 3428–3459 USD range. Stop loss placed below 3310 for risk management.
Xauusdsignals

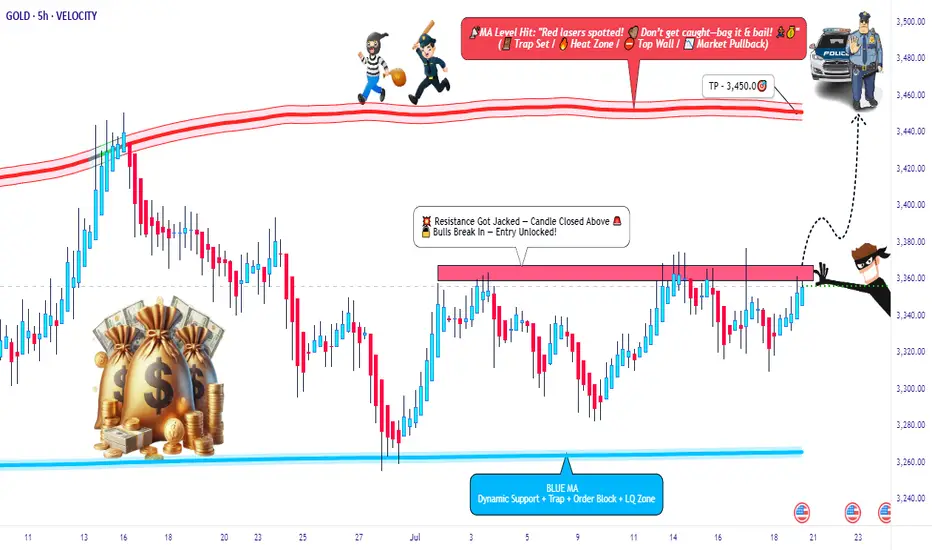
XAU/USD Breakout Playbook – Rob the Market!🚨💰 GOLD HEIST IN MOTION! | XAU/USD Thief Trading Strategy (Breakout Edition) 🏴☠️
🧠 Strategic Mindset | Not Your Average Chart Talk
Yo Market Bandits & Pip Hunters – welcome to the underground playbook!
This isn't your grandma’s chart breakdown – it’s a Thief Trading Takedown on XAU/USD (Gold), where we’re not chasing the market… we’re outsmarting it.
THE MASTER PLAN: Enter Like a Ghost, Exit Like a King 👑
📍 ENTRY POINT – The Break-In Begins!
💥 Breakout Level: Watch for 3370.00 resistance to crack – this is our green light.
🕵️♂️ Entry Style:
• Buy Stop above MA resistance zone (fast & clean)
• OR Buy Limit near swing low zones after confirmation pullback (sniper entry)
🧠 Thief Tip: Wait for the breakout to happen. No orders, no SL before it. Patience is profit.
🔄 Layer the Entry:
• Deploy DCA (Dollar Cost Averaging) or scaling entries with precision
• Build positions like stacking cash bags — smart, silent, and calculated
🛡️ PROTECT THE LOOT – Stop Loss Logic 💣
📍 SL Guide: 3310.00 (4H swing low – update as price structure evolves)
🔥 SL ONLY comes after breakout. Set it too early? That’s how you get caught.
⛔ No pre-breakout orders. No early SL. Stay invisible till it's go time.
🎯 THE ESCAPE – Profit Like a Phantom 🚀
💸 Take Profit: 3450.00
📉 Scalpers: Trail SL as price pushes – never give back stolen pips
🌀 Swing Traders: Monitor resistance layers – don’t let the bulls turn on you
🧭 CONTEXT – Why This Setup?
🔍 Macro Snapshot:
• Trend: Neutral/Bullish Lean
• Influencers: COT reports, geopolitical tension, dollar flows
• Sentiment Shifting – watch the herd, but don’t run with it
🗞️ News Risk: Don’t get wrecked by events! Avoid entries during high-impact news.
🚨 Trailing SL is your best weapon during volatility.
⚡ POWER UP THE CREW – Support the Movement
💬 Drop a comment, hit the 🔥 like button, and share with your trading gang
More Thief Trading blueprints coming soon – bigger breakouts, cleaner setups
⚠️ STAY SHARP, THIEVES!
This ain't financial advice – it’s an outlaw’s edge on the market.
Trade smart. Risk well. Protect the bag.
🏴☠️ XAU/USD GOLD HEIST IN PROGRESS... Join the Movement. Let’s Rob the Market.
XAUUSD Does it need to test the 1D MA100 first?Gold (XAUUSD) is attempting to break below its Triangle formation just 4 days after marginally breaking above it. This has invalidated that pattern so after breaking also below its 1D MA50 (blue trend-line), it could technically go for a 1D MA100 (green trend-line) test for the first time since January 06 2025.
If it does, there will be more probabilities for a stronger than before rebound to make a new High. Our Targe is the 2.0 Fibonacci extension at $3620.
Keep also an eye on the 1D RSI Buy Zone, which has been giving the most optimal buy signals since April 07 2025.
-------------------------------------------------------------------------------
** Please LIKE 👍, FOLLOW ✅, SHARE 🙌 and COMMENT ✍ if you enjoy this idea! Also share your ideas and charts in the comments section below! This is best way to keep it relevant, support us, keep the content here free and allow the idea to reach as many people as possible. **
-------------------------------------------------------------------------------
Disclosure: I am part of Trade Nation's Influencer program and receive a monthly fee for using their TradingView charts in my analysis.
💸💸💸💸💸💸
👇 👇 👇 👇 👇 👇

Gold is going down. It may continue next week.On the last trading day of this week, the bears attacked strongly and continued to refresh the recent lows, reaching the lowest point near 3325 before stopping.
From Monday's 3345 to 3440, it closed near 3337. This week, it also walked out of the large range roller coaster pattern, and all the strengths in the previous period did not exist. Under the continuous downward trend, the bulls were also vulnerable, and there was not even a strong rebound, which indirectly explained the strength of the bears in the short term.
As for the current trend, the bears are likely to continue to be strong, and before there is a symbolic upward breakthrough, we still need to maintain the idea of shorts to operate. The current upper pressure is maintained near 3350, which is also the bottom position touched for the first time in the previous period. It is possible that it will be transformed into a top-bottom conversion pattern; and the strong support level below is near 3310.
When the Asian market opens next Monday, we need to pay close attention to whether there is a gap problem on both the bulls and bears. After three consecutive negative daily lines, all the moving average systems have been broken, and it is also likely to form a resonance pressure pattern. On Monday, gold will first touch around 3350 and continue to short. The profit range will be around 3330-3320, and the stop loss will be 3360. If the European session is stronger, you can adjust the point before the US session.
Gold Spot / U.S. Dollar (XAUUSD) - 4 Hour Chart (OANDA)4-hour chart from OANDA displays the price movement of Gold Spot (XAUUSD) from late July to early August 2025. The current price is $3,332.775, reflecting a decrease of $35.935 (-1.07%) as of 07:54 PM PKT on July 25, 2025. Key levels include a sell price of $3,332.480 and a buy price of $3,333.050. The chart shows recent volatility with a shaded support zone around $3,312.314 to $3,367.326, indicating potential price stabilization or reversal areas.

Gold Softens — Watching for a Tactical Long OpportunityYesterday, gold hit a low of around 3351 and then began to rebound. During the rebound, it hit a high of around 3377 and then retreated again. We can clearly see that below 3400, gold is still weak overall, and even failed to reach 3380 during the rebound. In the short term, the 3380-3390 area has become an obvious resistance area.
Yesterday, gold rebounded after dropping to around 3351. Whether the support near 3350 is effective has not been verified again, so from a technical perspective, gold still has the need to retreat again and test the support near 3350. Once gold falls below the area when testing the support near 3350, gold may continue to fall to the 3335-3325 area.
Therefore, in today's trading, the focus is still on shorting gold, supplemented by trying to go long on gold with the support.
1. Consider shorting gold in the 3380-3390 area, TP: 3365-3355;
2. Consider going long gold in the 3355-3345 area, TP: 3365-3375; strictly set SL
3. If the 3355-3345 area is broken, try to go long gold again in 3335-3325, TP: 3360-3370
Gold fluctuated downward. Or it will continue.Gold was blocked near 3393 in the early trading on Thursday and began to fluctuate and fall, falling to 3351 as low as possible, then stopped falling and rose, and after rebounding near 3377, it was blocked and fell back to 3370 and fluctuated up and down, and the daily line closed with a negative line.
After three consecutive positive rises from last Friday to Tuesday this week, gold ushered in a turning point on Wednesday. On Thursday, it continued to fall and broke through the 5-day and 10-day moving averages, and the short-term market weakened. From the overall structure, the rising channel since June 26 remains valid. The highs on Tuesday and Wednesday approached the upper edge of the channel and then fell. The current price turned to fall and approached the lower edge of the channel.
There are two key positions for the support below: the first support level is near 3345, which is the lower edge support of the current rising channel; the second support level is near 3325, which is the trend line support formed by the connection of the previous low points.
From the 4-hour chart, the 3351 low point and the rebound resistance level can be used as a reference for today's long-short game. The breaking of key support and resistance will determine the trend direction of the next stage.
Operation strategy:
Short near 3375, stop loss 3385, profit range 3350-3330
Long near 3330, stop loss 3320, profit range 3350-3370

350pips Secured — Focus Shifts to Dip-Buying StrategyToday's trading was very successful, and the grasp of the long and short rhythm was very accurate. Today's trading situation is as follows:
1. Close the short position with an overnight entry price of around 3386 near 3380, with a loss of 60 pips, and the loss amount exceeded $6K;
2. Directly short gold near 3380, manually close the position near 3366, profit 130pips, profit amount exceeded $12K;
3. Long gold near 3356, hit TP: 3372 and end the transaction, profit 160pips, profit amount exceeded $8K;
4. Long gold near 3362, hit TP; 3375 and end the transaction, profit 120pips, profit amount exceeded $6K.
Intraday trading summary: Today, the long and short sides completed a total of 4 transactions, one of which suffered a loss, but the net profit was 350pips, and the profit amount exceeded $20K. For short-term trading, I think I can submit a satisfactory answer to myself today!
How to execute the transaction next? Gold started to pull back from around 3438 and has now reached a low of around 3351, with a retracement of more than 870pips. The retracement space is not small. However, gold has stabilized above 3350 and has started a technical rebound repair, and the upward force is not weak, so gold may have completed the retracement. Under the support of these two technical conditions, gold may regain its upward momentum and hit 3400 again.
At present, the short-term resistance is obvious, located in the area near 3380. Once gold breaks through 3380, gold will inevitably continue to rise and hit 3400 again; but I think as long as gold stabilizes above 3350, it is not difficult to break through the short-term resistance of 3380, so gold will inevitably test the 3400 mark again; and the short-term support below is in the 3365-3355 area. Gold may still retreat to this area first during the rise in order to increase liquidity and accumulate momentum, helping gold to break through 3380 more easily.
So for the next short-term trading, I think it is feasible to go long on gold in the 3365-3355 area, first looking at the target area of 3380-3390, and then 3400.

XAUUSD Traders - Turn Chaos into Pips with This StrategyHello Traders,
Struggling to trade XAUUSD due to its high volatility? Taking small profits but suffering big losses?
We’ve got your back.
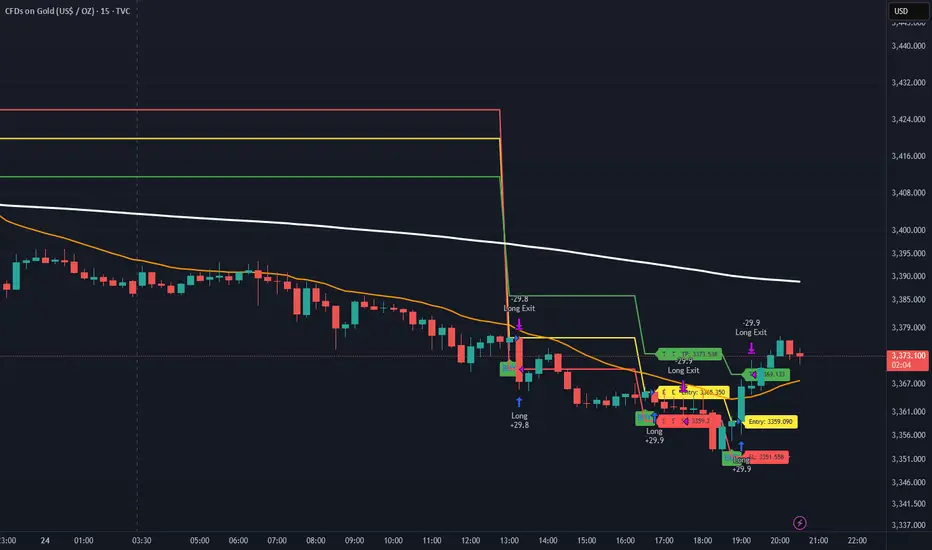
Introducing Gold Sniper — a high-probability strategy specially crafted for XAUUSD traders. With a 65%+ win rate and a consistent 1:1.33 risk-reward ratio, it’s designed to help you catch sharp moves with confidence.
🚨 Live Performance Highlights:
Today’s Trades:
Signal 1
🟢 Buy @ 3365.350
🔴 SL @ 3359.209
🟢 TP @ 3373.538
❌ Result: SL Hit → 61 Pips Loss
Signal 2
🟢 Buy @ 3359.090
🔴 SL @ 3351.558
🟢 TP @ 3369.133
✅ Result: TP Hit → 75 Pips Profit
📊 Net Profit Today: +13 Pips
📅 Yesterday’s Profit: +150 Pips
✅ Gold Sniper helps you:
• Avoid fake breakouts
• Catch real momentum
• Stick to disciplined entries and exits
🎯 Want to boost your trading accuracy?
📩 DM us now to get access and start using Gold Sniper directly on your TradingView chart.
If you find this valuable, like the idea and show your support. Let’s grow together!
Happy Trading,
InvestPro India
Double Down on Gold — Targeting 3400–3410!Obviously, gold did not give us the opportunity to short gold near 3440 today. In the process of its recent pullback, gold tested 3400 as expected, and after falling below 3400, it continued to fall to around 3385 as if it was planned by me. Although the lowest point had reached around 3381, it quickly rebounded above 3385. What is relatively regrettable today is that both of our plans to short gold ended in failure. The first time was when gold did not give us the opportunity to short near 3440. The second time was when we were preparing to short gold at 3400 and set the TP to 3385. However, we did not have time to create an order because the price fell too quickly, causing us to miss the gold short trade again.
At present, I have a trading order to go long on gold near 3386. And I go long on gold with twice the usual trading volume. Why am I still optimistic about the rebound of gold in the short term after the gold price fell by nearly $60? Because the area around 3385 is the short-term bull-bear dividing line, although gold has fallen sharply, as long as it stays above the area around 3385, gold is still in a bullish trend as a whole, and the bullish structure has not been destroyed, so in the short term, gold still has a lot of room for rebound after the pullback. This is why I dare to use twice the usual trading volume to buy gold near 3386.
However, because the current gold long and short continuity is not strong, and the market uncertainty is still increasing due to complex news, the gold market is prone to violent fluctuations in the short term, so we have to be more careful in trading. At present, I still hold a gold long position near 3386, and I hope that gold can continue to rebound to the target area: 3400-3410.

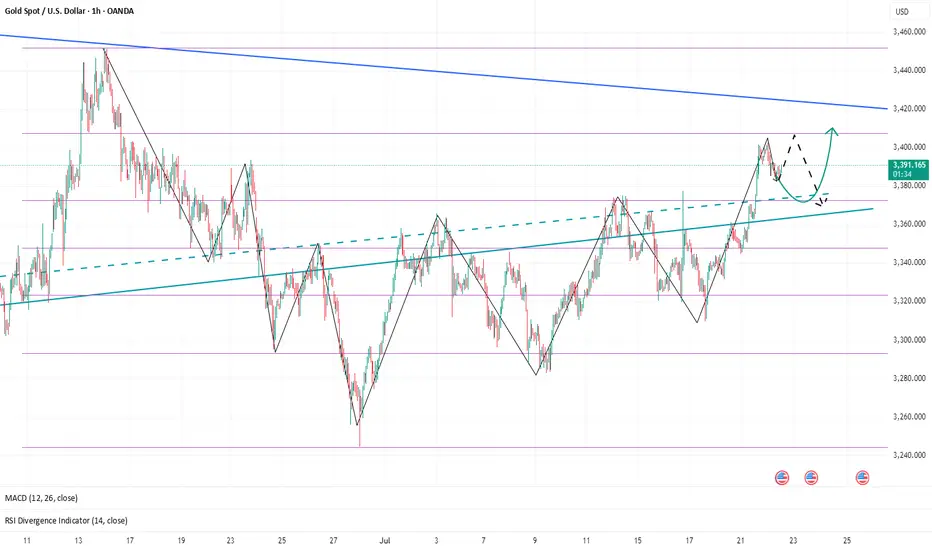
#GOLD Will Keep Growing!
HI,Traders !
#GOLD keep trading in An uptrend
along the rising support So as the gold
is approaching A the support we will be
Expecting a bullish rebound !
Comment and subscribe to help us grow !

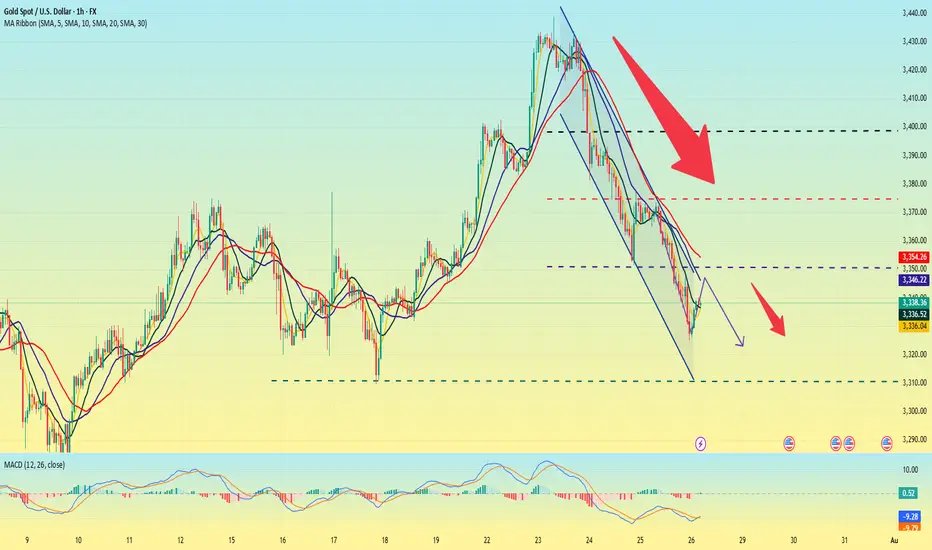
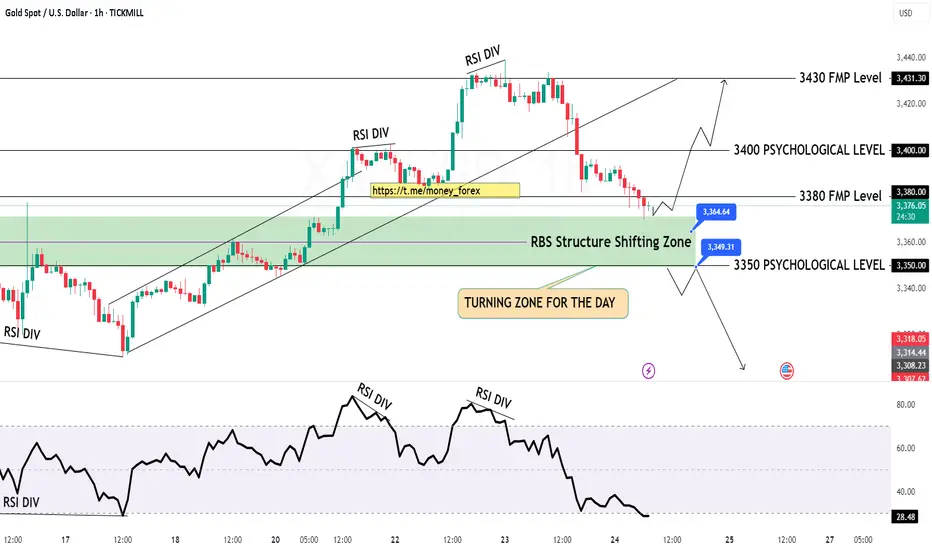
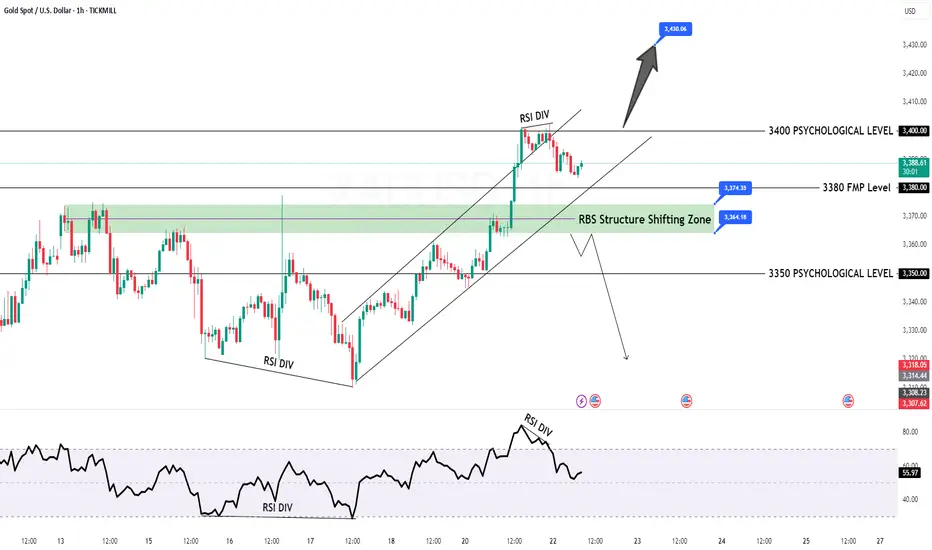
GOLD H1 Chart Update for 24 July 2025Hello Traders,
we got fall yesterday on RSI DIV and right now all eyes on 3350 Psychological level breakout if market successfully breaks that level then it will move towards 3330 or even 3315 level
some retracements remains pending around 3400-3412 zone GOLD will might retrace that zone before going further down
Reminder: PMI's day in the market
Disclaimer: Forex is Risky
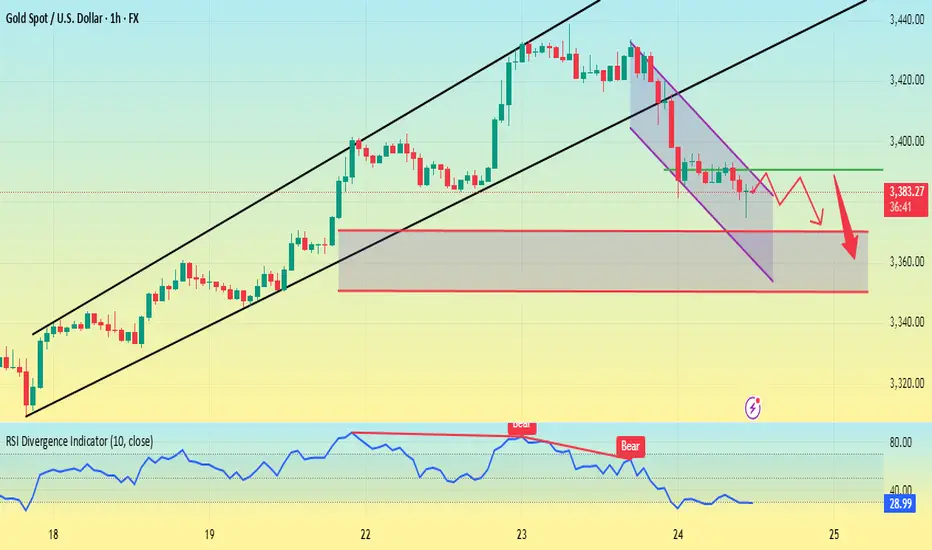
Gold peaked in the short term. Welcome a new trend?The previous rising structure of gold was broken, especially yesterday's rapid decline broke through the previous support of 3385. Although it rebounded slightly, it was difficult to change the adjustment. Yesterday's high point of the US market was at 3396-98 US dollars. Today, the adjustment trend continued. The dividing point between long and short is 3395 US dollars today. Before the price reaches here, do not consider long.
Many traders are confused. Why are there longs one day and shorts the next day? In fact, this is the characteristic of the volatile market. Breaking the key position cannot last. No matter what you think about the market, you must pay attention to the current shape changes. In the volatile market, you should consider the market of the day more, not the long-term direction.
From the 1-hour chart, the gold price rebounded near 3390 and shorted, and the profit range is 3370-3350.
The backup strategy is to break through 3400 and go long, and pay attention to 3415-3425 on the upside.
In other words, look for opportunities to short on a rebound below 3400 today, and adjust your thinking after breaking through the key resistance.
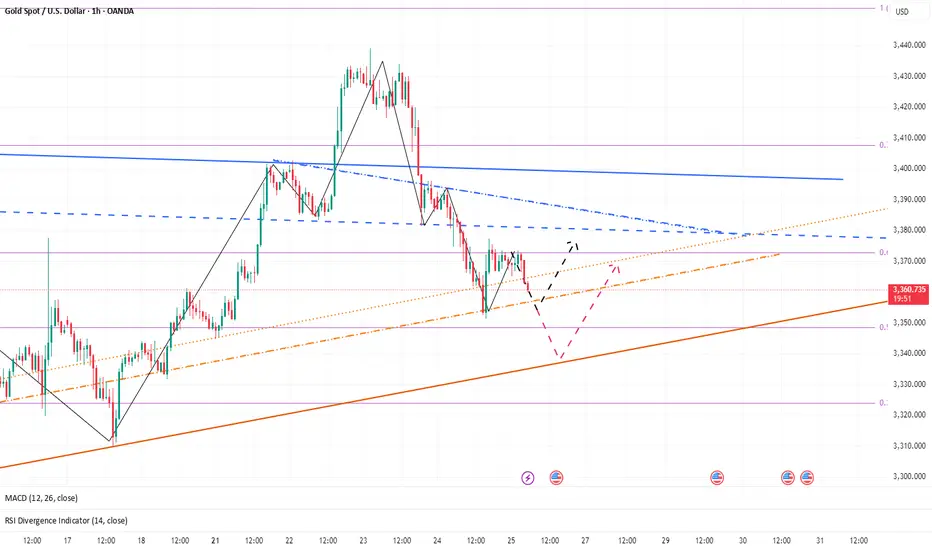
Deep Pullback on XAUUSD Gold: What I'm Watching Now🚨 Gold Update & Trade Plan 🚨
Taking a look at Gold (XAUUSD) right now — it's been trending strongly in an uptrend 📈, showing impressive momentum over the past sessions. However, we've recently seen a deep pullback 🔻 that has tapped into a key liquidity pool 💧.
From this level, I'm anticipating a bullish reaction 🔁, and I’m eyeing a potential scalping or intraday opportunity. In the video, we break down:
🔹 Market structure
🔹 Price action analysis
🔹 Trend context
🔹 A complete trade plan
🎯 Entry, stop-loss, and targets are all discussed based on technicals — with precision and discipline.
This is my personal trading plan based on how I read the markets — not financial advice. Trade safe and stay sharp! ⚔️💹

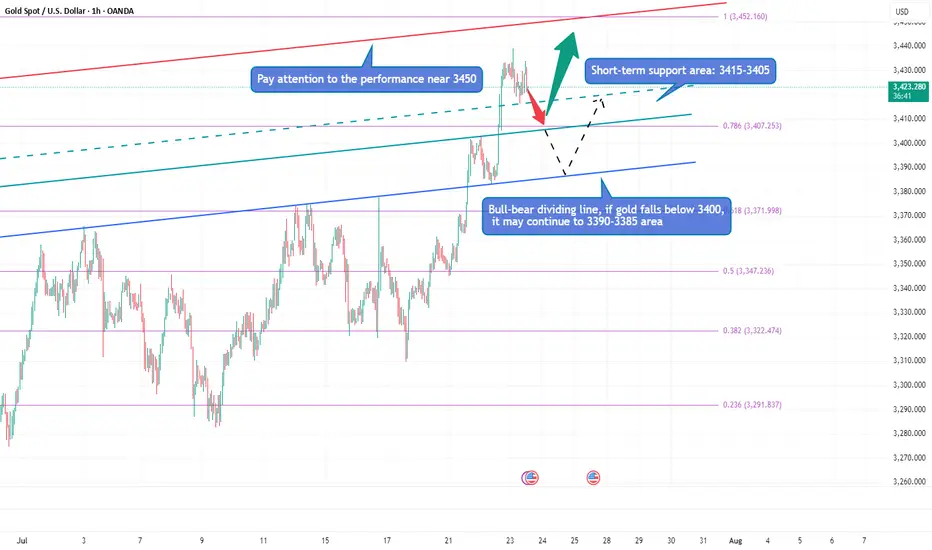
Gold is surging, can it hit 3500?Due to the trade tensions caused by tariffs and the continued conflict between the White House and the Federal Reserve, gold continued to rise, and the current highest has reached around 3438. Obviously, after gold rose strongly and broke through the 3400 and 3420 areas, the bullish sentiment of gold has been ignited. Next, we need to pay attention to whether gold can test and stand firm at 3450.
Gold is currently extremely strong, and there is basically no room for retracement during the rise. As gold rises, the short-term support below has also moved up to the 3415-3405 area; and the upper side needs to pay attention to the breakthrough of the 3450 mark. If gold continues to break through 3450, then gold has the potential to challenge 3500 again; however, if gold still cannot effectively break through when it touches the area near 3500 again, the sentiment of gold cashing out and leaving the market may be stimulated, resulting in gold There may be room for retracement in the short term. If gold falls below 3400 during the retracement, the decline may continue to the 3395-3385 area.
Therefore, for the next short-term trading, we can first wait for the opportunity for gold to pull back, and then consider going long on gold with the 3415-3405 area as support; if gold does not give a chance to pull back, then when gold first touches the area around 3440-3450, we can consider starting to short gold.
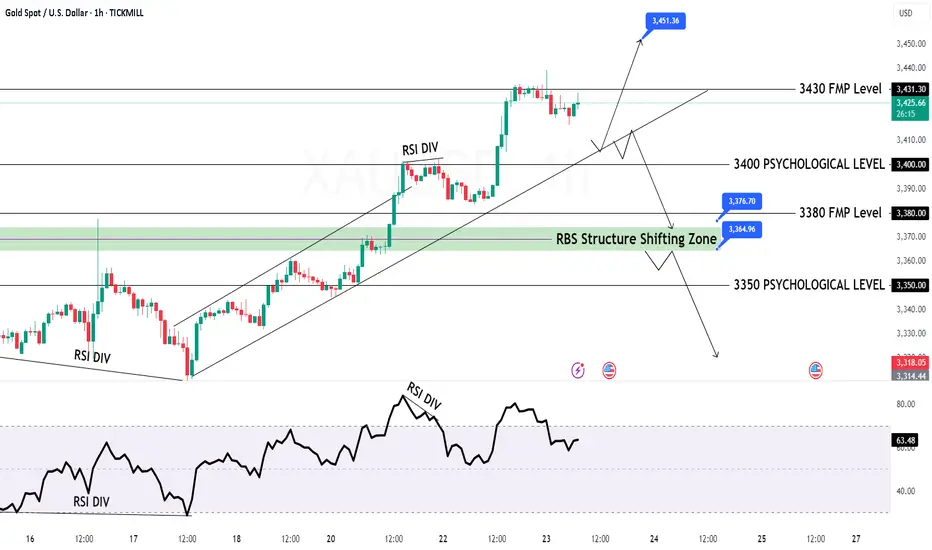
GOLD Intraday Chart Update for 23 July 25Hello Traders
First of all i hope you were enjoying yesterday move with 400 Pips Reward
For today we have 3400 Psychological remains in focus if market breaks below 3400 then it will move towards 3364-76 zone otherwise we are remain buyers above 3400 Level
Strong Resistance zone for intraday is at 3445-3465 if market cross 3465 the it will move towards ATH test which is around 3500
Disclaimer: Forex is Risky
Gold (XAU/USD) 4‑Hour Technical Analysis: July 23, 2025Gold continues to trade in a bullish structure on the 4‑hour timeframe, holding above $3,420 after a steady advance from early July lows. At the time of writing, XAU/USD stands at $3,423.8, confirmed by Investing.com. This analysis employs a comprehensive blend of globally‑recognized technical tools — ranging from price action and classical indicators to institutional concepts — to identify the most probable trading zones and a high‑conviction setup.
Current Price Structure and Trend
On the 4‑hour chart, gold maintains a clear bullish market structure, consistently printing higher highs and higher lows since early July. The current price action unfolds within a well‑defined rising channel, bounded approximately between $3,400 on the lower side and $3,450 on the upper. Twice in the past week, price has tested and respected the channel’s lower boundary, confirming its validity.
Support and resistance levels are evident: immediate support lies at $3,410, coinciding with the 50% Fibonacci retracement of the July impulse wave. Below that, $3,390–$3,395 offers secondary support at the channel’s base and a longer‑term Fibonacci cluster. Resistance is concentrated at $3,445–$3,450, aligning with the channel top, upper Bollinger Band, and prior swing highs, while a secondary ceiling may emerge near $3,468–$3,470, corresponding to an Elliott Wave 3 extension target.
Candlestick, Volume, and Momentum
Recent price action has been supported by bullish candlestick formations. Notably, a strong bullish engulfing bar formed at $3,410 earlier this week, affirming institutional demand at that level. Volume profile analysis shows the heaviest transaction cluster between $3,410–$3,420, confirming this area as a smart money accumulation zone.
Volume‑weighted average price (VWAP ) currently runs near $3,418, with price holding above it, reflecting institutional positioning in favor of the bulls. Momentum indicators support the trend: MACD on the 4‑hour has just crossed bullish, RSI prints at 60 — strong but not overbought — and ADX climbs to 24, indicating a trend strengthening phase.
Indicators, Patterns, and Institutional Concepts
Trend indicators reinforce the bullish view. The 50‑ and 100‑period exponential moving averages converge around $3,415–$3,420, providing dynamic support. Ichimoku analysis shows price well above the Kumo (cloud), with a bullish Tenkan‑Kijun configuration. Bollinger Bands are widening, and price is leaning toward the upper band — a classic signal of volatility expansion in trend direction.
Classical and harmonic patterns offer further evidence. The current consolidation resembles a bull flag, suggesting continuation. Elliott Wave analysis points to a third wave in progress, with an upside projection into the $3,448–$3,468 area. Smart money concepts confirm that the recent break above $3,420 constituted a bullish break of structure (BOS), with price now retracing into a favorable gap (FVG) and a 4‑hour bullish order block anchored around $3,410–$3,415.
Liquidity and stop‑clusters likely sit above $3,445 and $3,468, making these logical targets for bullish campaigns.
Market Context and Sentiment
Gold is benefiting from a softening US dollar and a drop in volatility indexes. Seasonal tendencies also lean bullish into late summer. Sentiment on professional platforms aligns with this view: TradingView top authors and FXStreet analysts favor buying pullbacks into $3,410–$3,415 and targeting $3,450–$3,468, which harmonizes with this analysis. No major divergence from consensus is noted, adding to confidence.
Identified Trading Zones
Two strong buy zones emerge on the 4‑hour chart. The most immediate and highest‑confidence zone is $3,410–$3,415, supported by channel support, Fibonacci retracement, VWAP, moving averages, and an order block. Below this lies a secondary buy zone at $3,390–$3,395, tied to deeper Fibonacci support and the rising channel’s lower boundary.
On the other hand, clear sell zones are defined at $3,445–$3,450, where upper channel resistance, Bollinger bands, and prior highs converge, and a secondary zone at $3,468–$3,470, aligned with wave targets and round‑number psychological resistance. These areas are likely to attract profit‑taking and potential reversals.
The Golden Setup
Among the findings, one trade stands out as the highest‑conviction setup:
A long position at $3,415, with a stop loss at $3,405 and a take profit at $3,450.
This trade is backed by strong confluence: price pulling back into a well‑defined demand zone ($3,410–$3,415) that features order block support, Fibonacci retracement, VWAP alignment, EMA cluster support, and a rising channel boundary. The target sits just below the first significant resistance band ($3,445–$3,450), offering a favorable risk‑to‑reward ratio. The confidence level on this setup is rated at 8/10, given the multi‑method alignment and consistent sentiment from professional sources.
Summary Table
Category Levels / Details
Buy Zones $3,410–$3,415, $3,390–$3,395
Sell Zones $3,445–$3,450, $3,468–$3,470
Golden Setup Long @ $3,415 / SL $3,405 / TP $3,450 (Confidence: 8/10)
In conclusion, gold maintains a constructive technical outlook on the 4‑hour timeframe. The prevailing bullish structure, reinforced by classical and institutional methodologies, supports a continuation toward the $3,450–$3,468 region. The suggested Golden Setup provides a disciplined, high‑probability entry at a key inflection zone, consistent with both technical evidence and prevailing market sentiment.

GOLD: Price Made A New HHLooking to buy gold, market structure is bullish on the H1 and H4. I went over 2 different scenarios in the video...
1. Pullback Entry (Preferred)
🟢Entry Zone: 3365–3380
TP1: 3432
TP2: 3450
TP3: 3475–3500 (extended target if momentum holds)
2. Breakout Buy (Aggressive)
Trigger: M15 breaks and closes above 3405–3410 with strong displacement.
Entry: Retest of breakout zone at 3402–3405
Same Targets
Don't forget to set those price alerts!

XAUUSD Breakout Structure | Smart Money Bullish Roadmap 🚨 XAUUSD 2H | Smart Money Concept Setup
Price perfectly tapped into demand zone and showed a strong bullish reaction — now forming a clear BOS (Break of Structure).
📍 Key Liquidity Zones:
• Price swept previous lows and is now targeting major liquidity levels marked as “Target Points.”
• Bullish momentum is expected to push price towards 3410 – 3425 range 📈
🔁 Expect possible consolidation before a continuation to upper targets.
💡 Strategy:
Wait for a minor pullback near the 3380–3390 level for confirmation, then ride the momentum to higher targets.
🎯 Target Levels:
1. 3398 ✅
2. 3410 🚀
3. 3425+ (Final Target)
📌 Like, Follow & Save if you caught this early 📊
#XAUUSD #SMC #LiquidityGrab #GoldSetup #TradingViewIdea #SmartMoney #Breakout

Gold Spot / U.S. Dollar (XAUUSD) 2-Hour Chart - OANDA2-hour candlestick chart displays the price movement of Gold Spot against the U.S. Dollar (XAUUSD) from OANDA, covering the period up to July 22, 2025. The current price is 3,395.285, reflecting a 1.775 (-0.05%) decrease. The chart includes buy/sell indicators (3,395.780 buy, 3,394.890 sell), a highlighted resistance zone around 3,400-3,425, and a support zone around 3,370-3,386. The chart also features technical analysis tools and annotations indicating potential price trends.
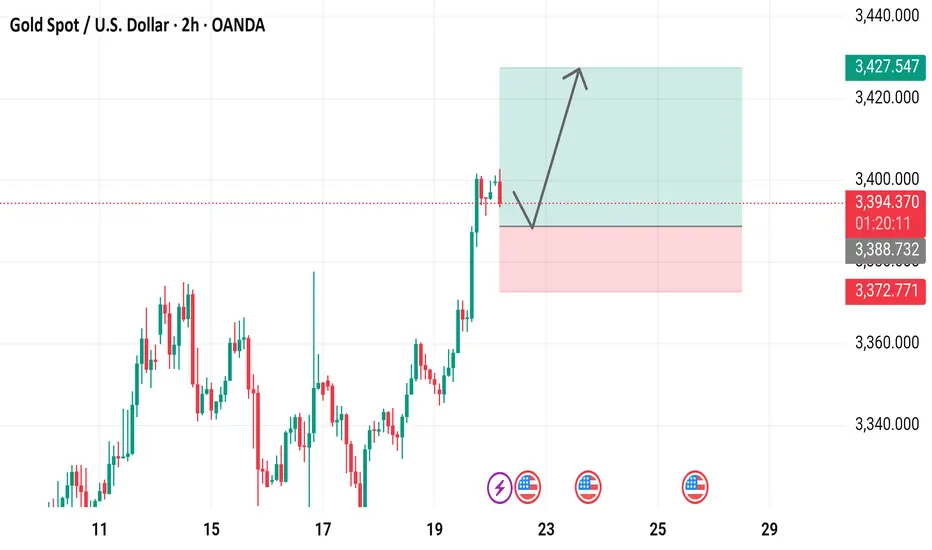
More Pain for Gold? The Charts Say It’s PossibleSince the start of the London market, gold has almost maintained a narrow range of fluctuations in the 3390-3385 area. Compared with yesterday, the market is much weaker today, and gold has failed to stabilize at 3400 several times, indicating that the sentiment of cashing out near this area is also very high. From the current gold structure, gold is obviously biased towards a long structure. Since gold broke through 3400, 3375-3365 has become the key support area after the top and bottom conversion in the short term.
However, gold rose strongly yesterday but did not stabilize at 3400. The bullish sentiment may no longer be strong. Moreover, after the accelerated rise in gold, the sustainability was not strong, so gold still needs to retreat in the short term. This is why I insisted on shorting gold again near 3400 yesterday. Therefore, I think gold has not yet retreated to the right level. I will pay attention to the opportunity to go long on gold after it pulls back to the 3375-3365 area.
Gold fell after touching 3400 twice. Whether a short-term effective "M" double top structure has been formed, I think more signals are needed to verify. However, in the short term, it is still under pressure in the 3405-3410 range, so if there is no major positive news, I think gold may maintain a wide range of fluctuations in the 3410-3360 range. Therefore, if gold rises to the 3400-3410 range again, I will continue to try to short gold!
GOLD Intraday H1 Chart Update For 22 July 2025Hello Traders,
Today we have FED Chair Powell Speech ahead
all eyes on 3400 Psychological Level Break for now, if market successfully breaks 3400 then it will move towards 3435
below 3400 it will move back towards 3350 level
Disclaimer: Forex is Risky
GOLD (XAUUSD): Bearish Move From Resistance Confirmed
Gold tested a significant confluence cluster on a daily time frame
that is based on a rising trend line and a horizontal resistance.
A double top formation on that on an hourly time frame indicates
a highly probable retracement from that.
Goal - 3378.5
❤️Please, support my work with like, thank you!❤️
I am part of Trade Nation's Influencer program and receive a monthly fee for using their TradingView charts in my analysis.
