XAU/USD Bearish Bomb Ready to Explode? (Entry Levels Inside)🏦💰 GOLD HEIST ALERT: XAU/USD Bearish Raid in Progress! (Short Setup Inside) 💰🏦
🚨 Cops Waiting at Resistance? Here's How to Steal Pips & Escape Safely! 🚨
🦹♂️ ATTENTION ALL MARKET BANDITS!
To the Profit Pirates & Risk-Takers! 🌍💣
Using our 🔥Thief Trading Tactics🔥 (a lethal mix of liquidity grabs + institutional order flow + macro traps), we're executing a bearish gold heist on XAU/USD—this is not advice, just a strategic robbery plan for traders who play by their own rules.
📉 THE GOLD VAULT RAID (SHORT ENTRY PLAN)
🎯 Loot Zone: 3280.00 (or escape earlier if bulls fight back)
💣 High-Stakes Play: Neutral trend turning bearish - trap for late buyers
👮♂️ Cop Trap: Where bullish traders get arrested by resistance
🔪 ENTRY RULES:
"Heist Activated!" – Strike when price breaks 3340.00
Sell Stop Orders above MA OR Sell Limit on pullbacks (15-30min TF)
Aggressive? Enter at market but use tighter stops
📌 SET ALERTS! Don't miss the breakdown
🚨 STOP LOSS (Escape Plan):
Thief SL at 3390.00 (4H swing high)
⚠️ Warning: "Ignore this SL? Enjoy your margin call."
🎯 TARGETS:
Main Take-Profit: 3280.00
Scalpers: Ride the bear waves only
🔍 FUNDAMENTAL BACKUP (Why This Heist Works)
Before raiding, check:
✅ COT Data (Are big players dumping gold?)
✅ Real Yields (TIPS vs Gold correlation)
✅ Geopolitical Heat (Safe-haven flows drying up?)
✅ DXY Strength (Dollar crushing commodities?)
🚨 NEWS RISK WARNING
Avoid NFP/CPI/FOMC periods (unless you like volatility torture)
Trailing stops = your get-out-of-jail-free card
💎 BOOST THIS HEIST!
👍 Smash Like to fund our next raid!
🔁 Share to recruit more trading outlaws!
🤑 See you at the target, rebels!
⚖️ DISCLAIMER: For entertainment only. Trade at your own peril.
#XAUUSD #GoldTrading #TradingView #LiquidityGrab #ThiefTrading
💬 COMMENT: "Short already—or waiting for confirmation?" 👇🔥
Xauusdsignals

GOLD (XAUUSD): Updated Support & Resistance Analysis
Here is my latest support and resistance analysis for Gold.
Horizontal Structures
Support 1: 3294 - 3312 area
Support 2: 3231 - 3287 area
Support 3: 3121 - 3176 area
Resistance 1: 3338 - 3368 area
Resistance 2: 3441 - 3451 area
Resistance 3: 3493 - 3500 area
Vertical Structures
Vertical Support 1: Falling trend line
Consider these structures for pullback/breakout trading.
❤️Please, support my work with like, thank you!❤️
I am part of Trade Nation's Influencer program and receive a monthly fee for using their TradingView charts in my analysis.

Trading Strategy (XAUUSD) – June 25, 2025 After a sharp decline in the previous session, XAUUSD has shown a mild recovery and is currently trading around 3,332 USD. However, price action suggests this could merely be a pullback within a broader downtrend, as gold has yet to break above the key resistance zone.
Technical Analysis
Price Action
Gold has bounced from the support zone between 3,291 – 3,317 USD, which has historically acted as a strong demand area. This zone also aligns with the Fibonacci 0.382 retracement from the previous bullish leg.
However, XAUUSD remains below the key resistance zone at 3,373 – 3,392 USD, which is a confluence of:
- The Fibonacci 0.618 retracement from the most recent downtrend
- A historical supply zone that has been rejected multiple times
- The upper boundary of the sideways range formed since May
- If price fails to break through this zone in the coming sessions, the risk of continued downside remains high.
RSI Indicator
- The RSI (14) is currently hovering around the neutral zone (49–54), indicating that the rebound lacks the strength needed to confirm a trend reversal.
- The RSI has not crossed above the 55 threshold, suggesting the dominant trend is still bearish.
Key Technical Levels to Watch
Resistance:
- 3,373 – 3,392 USD: Confluent resistance zone (Fibonacci 0.618 + prior supply zone)
- 3,435 – 3,452 USD: Major swing high, a key medium-term reference level
Support:
- 3,291 – 3,317 USD: Immediate support zone, still holding strong
- 3,250 – 3,224 USD: Potential downside target if the bearish momentum resumes
Suggested Trade Setups
Scenario 1 – Buy if price holds above 3,291 and shows confirmation signals
Entry: 3,295 – 3,300 USD
Stop-loss: Below 3,289 USD
Take-profit: 3,340 – 3,355 – 3,370 USD
Conditions: Must show clear bullish reversal patterns (Pin Bar, Bullish Engulfing) on H1 or H4 timeframe
Scenario 2 – Sell if price rejects from resistance zone with confirmation candle
Entry: 3,370 – 3,375 USD
Stop-loss: Above 3,392 USD
Take-profit: 3,330 – 3,310 – 3,290 USD
Conditions: Clear bearish rejection candle + declining volume
Note: XAUUSD is currently in a technical rebound phase after a strong drop but lacks solid reversal confirmation. Traders should closely monitor the price reaction near the 3,373 – 3,392 USD resistance zone over the next sessions. This area will determine whether the downtrend will resume or a reversal begins.
Stay tuned for more daily trading strategies, and make sure to save this analysis if you find it helpful for your trading plan.
Strategy analysis by @Henrybillion

Gold Spot / U.S. Dollar (XAUUSD) 4-Hour Chart - OANDA4-hour candlestick chart from OANDA displays the price movement of Gold Spot (XAUUSD) from late June to early July 2025. The current price is $3,332.245, reflecting a +0.26% increase (+$8.795) as of 07:39 AM CEST on June 25, 2025. The chart highlights a recent price range between $3,320.076 and $3,365.226, with a notable support level around $3,329.934 and resistance near $3,355.226. The chart includes a shaded area indicating a consolidation or trading range.

Buy gold, there may be a rebound in the short termAt present, gold has touched the area of 3325-3315 mentioned in my previous article, and the lowest price is around 3316. At present, due to the current important support area of 3310-3300 below, gold still has a rebound demand in the short term; although gold has not rebounded sharply at present, the downward momentum has indeed slowed down, and gold may rebound after the short force is consumed. Moreover, the ceasefire between Iran and Israel has not yet been settled. Moreover, the ceasefire between Iran and Israel has not yet been settled. With the fluctuating situation in the Middle East, bulls may have opportunities to counterattack.
However, the current performance of gold is indeed relatively weak, so there is no need to expect gold to rebound and fill the upper gap area of 3360-3370 in the short term; in trading, the rebound expectation can be appropriately lowered, and long positions can continue to be held and look up to the 3340-3350 area.

6/24 Gold Analysis and Trading OutlookGood morning, everyone!
Gold closed yesterday with a T-shaped candlestick. Although there was an intraday recovery after briefly breaching the MA20, the closing price remained below the MA5, indicating continued pressure on the upside.
Today’s opening saw a direct drop in price, suggesting a potential break below key support. Two important levels to monitor today:
Whether the closing price stays above 3355
Whether the intraday support at 3328 holds
If 3328 breaks down, the 3300 level may become the next major battleground between bulls and bears.
Driven by geopolitical news, gold has shown sharp volatility over the past two days. While this increases trading risk, it also presents more opportunities. From a technical perspective, today’s strategy should prioritize selling on rebounds, with buying at lower levels as a secondary approach. As always, stay disciplined and manage risk effectively.

GOLD Bearish Breakout!
HI,Traders !
#GOLD is trading in a
UPtrend and Broke our of the bearish
Wedge pattern then made
A retest and is going down
Now so we are bearish
Biased and we will be
Expecting a further move down !
Comment and subscribe to help us grow !

Gold (XAU/USD) Analysis - 24 June 2025📊 4-Hour Chart: Supply & Demand Structure
1. 📐 Market Structure & Bias
Gold has bounced off the $3,340–3,350 demand area multiple times—confirming a strong support structure on the 4H timeframe .
Following this bounce, gold made a higher-low, reinforcing a bullish trend.
Overall bias remains bullish, as long as prices hold above the $3,340 region. A break below this zone may bring deeper correction.
2. 🔍 Demand Zones (Buy Areas)
Zone A – $3,340 to $3,350
Comes with trendline support and prior consolidation.
Volume and price action confirm institutional buying interest.
Zone B – $3,300 to $3,310
A more significant base zone for deeper pullbacks or additional liquidity running.
3. ⚠️ Supply Zones (Sell Areas)
Zone C – $3,380 to $3,390
Shallow zone where recent rallies have stalled—ideal for supply fade strategies.
Zone D – $3,400 to $3,410
Major resistance zone—historical retracement area with institutional selling.
🔍 1-Hour Chart: Intraday Entry Zones (Aligned with 4H Bias)
Below are premium-level intraday buy setups made for quick execution within the bullish structure:
Entry Type Zone ($) Description
1. Buy the Dip 3,340 – 3,345 Touches 4H demand + trendline — watch for bullish rejection wicks or volume pickup.
2. Quick Dip Buy 3,350 – 3,355 Opportunistic entry higher in demand zone — quicker reentries with lighter pullback.
3. Deep Bounce 3,300 – 3,310 For deeper intraday swings only—requires strong confirmation from lower timeframes.
(Optional) Sell Supply Fade 3,380 – 3,390 Aggressive fade only if strong price rejection appears—caution advised.
Tips for Entry Confirmation:
Look for bullish pin bars, engulfing candles, volume confirmation, or trendline bounces within these zones. Only trade entries with clear price action confirmation.

There are still profit opportunities in short selling!As gold continues to rebound, bulls are reversing their decline. After gold broke through the 3370-3380 area, the current market consensus on 3350-3340 as the bottom area was strengthened. However, as gold fell back under pressure several times after the rebound, it proved that there was still a certain amount of selling pressure above, and it was obvious that the resistance was in the 3395-3405 area; once gold broke through this resistance area, gold bulls would regain the upper hand and are expected to continue to probe the 3320-3330 area. However, before gold effectively broke through the 3395-3405 area, bulls and bears would still fiercely compete for control, so it is still in a wide range of fluctuations.
Therefore, before gold broke through the 3395-3405 area, we can still appropriately short gold in the 3385-3395 area, and expect gold to retreat to the 3375-3365 area in the short term. In trading, we must pay attention to the changes in the rhythm of gold. Once gold chooses a direction and makes a breakthrough, we need to change our trading strategy!

XAUUSD Channel Up bottomed, giving a strong buy signal.Gold (XAUUSD) has been trading within a 1-month Channel Up since the May 20 low and right now it is consolidating within and just outside the 4H MA50 (blue trend-line) and 4H MA100 (green trend-line) zone. At the same time, it has touched the bottom of the Channel Up.
This is exactly the kind of price action the pattern had during its previous bottom formation following a Higher Low (June 9-11). With the 4H RSI having also formed a Higher Low pattern consistent with all previous 3 Lows, we expect the price to start its new Bullish Leg now. Our Target is 3495 (+4.75% from the bottom).
-------------------------------------------------------------------------------
** Please LIKE 👍, FOLLOW ✅, SHARE 🙌 and COMMENT ✍ if you enjoy this idea! Also share your ideas and charts in the comments section below! This is best way to keep it relevant, support us, keep the content here free and allow the idea to reach as many people as possible. **
-------------------------------------------------------------------------------
Disclosure: I am part of Trade Nation's Influencer program and receive a monthly fee for using their TradingView charts in my analysis.
💸💸💸💸💸💸
👇 👇 👇 👇 👇 👇

Short gold, gold still has at least one chance to pullback!At present, gold has rebounded to the 3370-3380 area again, which largely confirms that 3350-3340 is the bottom area at this stage. However, what we still cannot underestimate is that even with the support of safe-haven, gold has still failed to effectively break through the resistance of 3385-3395-3405 area, and even fell under pressure several times. To a certain extent, it weakened the willingness and confidence of bulls, so it aggravated the trend of wide fluctuations in the short term. During this period, we must pay attention to the rhythm change of gold.
According to the current bullish strength of gold, I think gold does not have the conditions to directly break through the heavy resistance of 3385-3395-3405 area for the time being, so gold still needs at least one retracement expectation, so I think we can still try to short gold in the 3375-3385 area, but the retracement expectation should not be too large, 3365-3355 is enough!

Gold Spot Price Trend Analysispresents a detailed analysis of the gold spot price trend against the U.S. dollar, captured over a four-hour interval. The chart displays a fluctuating pattern, with prices ranging from approximately $3,320 to $3,383.74 USD. A notable decline is observed, marked by a red box indicating a support level at $3,332.53, while a green box suggests a resistance level at $3,383.74. The current price stands at $3,353.94, with a slight decrease of 0.42%. The chart provides valuable insights for investors and traders seeking to understand the dynamics of the gold market.

GOLD (XAUUSD): Intraday Bullish Confirmation
Gold is retesting a recently broken trend line of a bullish flag
pattern that I shared with you earlier.
A double bottom pattern on that and a violation of its neckline
provide a strong intraday confirmation.
I think that the price may rise to 3392 level.
❤️Please, support my work with like, thank you!❤️

GOLD Intraday H1 Chart Update For 23 June 25 GOLD Intraday Chart show mid term Bearish move for now
For Today keep an eyes on 3368 level Breakout for Buy Scalping for long trade we may wait for dip around 3330-3340 zone SL remains possibly 100 pips
As long as market sustains below 3400 Psychological Level it will remains Bearish and will try to move towards 3200-30 Psychological


GOLD (XAUUSD): Bullish Move After Opening?!
I think that there is a high chance that Gold will have a bullish opening.
The market closed, breaking a resistance line of a bullish flag pattern
on an hourly time frame.
Fundamentals strongly support this bullish outlook.
Resistance 1: 3392
Resistance 2: 3420
❤️Please, support my work with like, thank you!❤️
I am part of Trade Nation's Influencer program and receive a monthly fee for using their TradingView charts in my analysis.

Perhaps 3300 or even 3280 is foreseeable!Obviously, gold is currently fluctuating downward, and in the short term, there is a certain support in the 3340-3330 area, so gold will not fall below this support area in one fell swoop, and it is still possible to rebound to the 3360-3370 area with the support of this area. If gold encounters resistance and retreats again after touching the 3360-3370 area, if there is no major good news, gold is likely to fall below the 3340-3330 area. After gold falls below this support area, the 3300 and 3280 areas are foreseeable.
So according to the above logic, I still hold a long position executed near 3345, and I am very much looking forward to gold reaching the 3360-3365 area;
If gold continues to rebound to the 3365-3375 area, I will try to short gold again; and look forward to the accelerated downward movement of gold!
The above is a preview of the performance of gold. There may be some deviations in the specific execution of transactions, because in short-term transactions, it is necessary to judge the true breakthrough and false breakthrough in advance, but I will still roughly follow the above preview process to execute the transaction! I also hope that this can provide some reference for everyone!

GOLD (XAUUSD): Technical Analysis & Important Pattern to Watch
For some known reason, Gold remains bearish this entire week.
The market is currently correcting within a falling channel - a bullish flag on a 4H time frame.
Ahead, I see a bunch of strong intraday supports.
From one of these structures, a bullish rally may resume.
A trigger that you should look for is a bullish breakout of
a resistance line of the flag and a 4H candle close above that.
A bullish continuation will be expected then.
❤️Please, support my work with like, thank you!❤️
I am part of Trade Nation's Influencer program and receive a monthly fee for using their TradingView charts in my analysis.

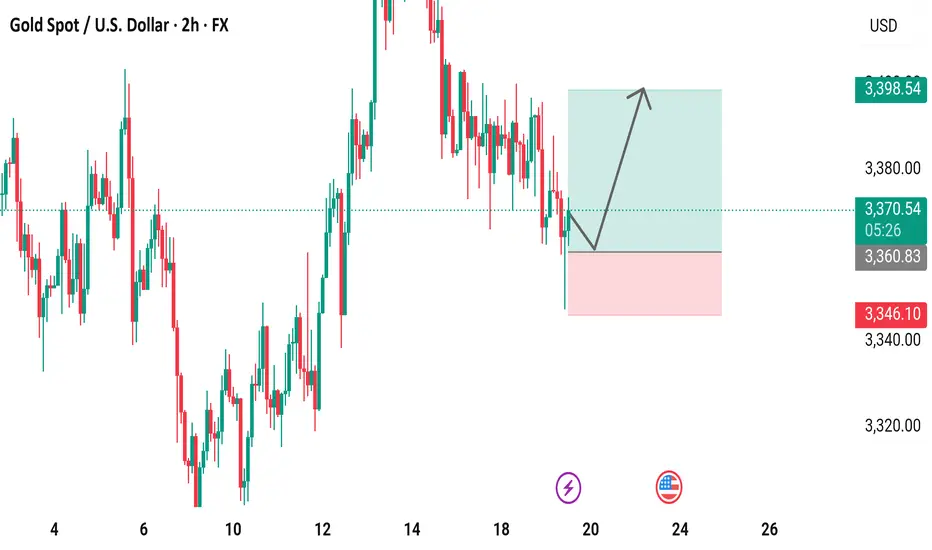
XAU/USD 2-Hour Chart Analysis: Bullish Breakout in Progress2-hour candlestick chart of the Gold Spot/U.S. Dollar (XAU/USD) currency pair, displayed on TradingView, a popular trading platform. The chart tracks price movements over a period from the 4th to the 26th, with each candlestick representing a 2-hour interval. The price levels, shown on the y-axis, range from 3,320.00 to 3,398.54 USD, while the x-axis marks the corresponding dates. The current price is 3,370.55 USD, up by 1.61 points (+0.05%), highlighted in green to indicate a positive change. Green candlesticks represent bullish (upward) price movements, while red ones indicate bearish (downward) trends, offering a clear view of market dynamics.
Gold Slips Below Key Support – Is $3,326 Next?OANDA:XAUUSD TVC:GOLD Gold has broken beneath the $3,365–$3,369 support zone, which now aligns with descending trendlines TL1 and TL2 acting as resistance. The 30-minute chart confirms a clean bearish breakout and retest, signalling potential continuation toward lower support near $3,326.
🎯 Short Setup
Entry: $3,365 (retest of broken support / trendline confluence)
Stop: $3,375 (above TL2 and intraday highs)
Target 1: $3,330
Target 2: $3,326
R:R: ~1:3.95
📊 Technical Context
• Price is capped below the $3,365–$3,369 supply zone
• Trendline resistance (TL1, TL2) remains intact from mid-June
• Structure favours continuation lower as long as price stays beneath the retest zone
🌐 Fundamental Backdrop
• Fed held rates steady, but Powell’s tone remained hawkish, warning of “elevated inflation” — supporting USD strength
• Rising Middle East tensions (Israel-Iran conflict) offer safe-haven bids, but not enough to break resistance
• Trump’s tariff threats and criticism of Fed policy add macro uncertainty — mildly supportive of gold in the longer run
📘 Trade Bias
As long as gold holds below $3,365, the bearish thesis remains intact. A sustained push above $3,375 would invalidate the setup and signal a potential reversal or breakout retest.
⚠️ Disclaimer
This analysis is for educational purposes only. Always do your own research and consult a licensed advisor before making financial decisions.

XAU/USD 4H Market Analysis- 19 June 2025XAU/USD 4H Market Analysis
Market Structure: Gold has been in a mild uptrend on the 4‑hour chart, making higher lows and highs since early June. The recent swing high was around ~$3,428 (mid-June), and price has pulled back toward the rising support line near ~$3,373.
A break above the recent high (around $3,404–$3,428) would continue the bull trend; conversely, a drop below the ~3,373 trendline/50% Fib level would signal a bearish turn.
In other words, bulls remain in control as long as ~$3,373 holds – breaking that would threaten lower support around ~$3,338.
Overall Bias: Moderately bullish on 4H. Gold is respecting its rising trendline and 50-period EMA, and analysts note that holding above ~$3,373 keeps the uptrend intact.
Momentum (MACD) is neutral to slightly bearish short-term, so we expect consolidations and range bounces more than a reversal.
In summary, assume an upward bias while price stays above key support near $3,370–$3,380; a firm break below would flip bearish.
Key SMC/Zones:
Price is currently in a range/consolidation roughly between $3,370 and $3,400.
Important zones include:
Demand (Support) Zone:
~ $3,368–$3,378 — this 50% Fib retracement area has been defended as a bullish order block.
Below that, stronger supports sit near ~ $3,354 and $3,333 .
Supply (Resistance) Zone:
~$3,395–$3,415 — a cluster of swing highs and Fib levels. Analysts highlight $3,395, $3,412, $3,435 and even $3,450 as major resistance barriers.
In particular, the $3,400 level is a known psychological and technical ceiling.
Trendlines/BOS: The rising 4H trendline (currently near $3,370–$3,380) is key support.
A break of structure (BOS) below that line would be a bearish Change-of-Character. Similarly, the prior swing low around $3,373 is a flip zone – bulls want to keep that hold.
Liquidity: Stop-loss/liquidation clusters may lie just above recent highs ($3,428–$3,450) and just below recent lows ($3,338–$3,354). For example, stops above $3,428 could fuel a rally if hit, and stops below $3,338 could accelerate a drop.
In short, high-probability zones on the 4H chart are around ~$3,370 (demand/support) and ~$3,400 (supply/resistance).
We’ll look for trades that align with that structure (see setups below).
1H Trade Setups (Aligned with 4H Bias)
Long around $3,370–3,375 (Buy Dip to Demand Zone) –
Entry: ~3,370–3,375 (green zone). Stop: ~$3,365 (≈$5 below zone). Take-Profit: $3,380 first, then $3,390–$3,400.
Reason: This zone is a 4H demand area (50% Fib + order block) and coincides with the rising 4H trendline.
Price has repeatedly bounced here, so a bullish reversal is likely.
Trigger: Look for a bullish 1H signal (e.g. engulfing or pin bar) at ~3,370–3,375, or a break of the short-term 1H down-structure.
Entry on such a signal would target a retest of the mid-range (~3,380) and beyond toward resistance.
Short around $3,395–3,400 (Sell Rally to Supply) –
Entry: ~3,395–3,400 (red zone). Stop: ~$3,405 (≈$5 above zone). Take-Profit: $3,375 first, then $3,365.
Reason: This area is a clear 4H supply zone (near multiple Fibonacci levels/resistance).
It’s just below the $3,400 psychological barrier. A failure or bearish reversal here would likely send price back toward the demand zone below.
Trigger: Watch for a bearish 1H candle or a break of the short-term 1H up-structure in the 3,395–3,400 range. A clear rejection (e.g. bearish engulfing or strong wick) would be the signal to enter short.
(Note: If price breaks cleanly above $3,405–3,410 instead, a bullish continuation trade would then be favored, targeting $3,415+.)
Takeaway: Trade gold with the 4H structure in mind. With price above the ~$3,370 trend support, favor longs on pullbacks into that demand zone and shorts only at proven supply near $3,400. Always use a tight ~$5 stop beyond each zone and scale out at logical pivot levels to manage risk.

6/19 Gold Analysis and Trading SignalsGood morning!
Yesterday, the Federal Reserve's interest rate decision aligned with market expectations, bringing no major surprises. The market had already priced in bearish sentiment in advance, which led gold to trade within the Bollinger Bands' upper, middle, and lower bounds, with all three bands trending sideways, indicating limited intraday volatility.
🔍 Technical Overview:
On the 30-minute chart, the Bollinger Bands began to tilt downward near the close, with price currently pressured by the middle band;
However, MACD structure suggests the middle band may be broken, with potential for price to challenge the upper band resistance near 3392–3400;
More importantly, on the 1D chart, the MACD is showing signs of a bearish crossover (death cross). If confirmed, it may break the bullish structure, weakening support from the weekly MA5;
If gold sustains below the weekly MA10 at 3317, it could open the door for a broader correction, with a drop toward 3200 becoming increasingly likely.
📊 Fundamental Factors:
Today’s U.S. market holiday means fewer economic data releases. As such, gold will likely be driven by technical structure and geopolitical headlines, especially those related to the Middle East. If no new developments emerge, selling on rallies remains the preferred strategy.
📌 Trading Plan (VIP-Focused):
✅ Sell Zone: 3392–3409
✅ Buy Zone: 3338–3321
✅ Scalp/Flexible Zones: 3387 / 3373 / 3364 / 3356 / 3345

Strong support at 3365/3350In recent years, following the easing of high inflation pressures in the U.S., the Federal Reserve has maintained a high-interest-rate policy, a decision that has significantly impacted gold and U.S. dollar markets: high rates have boosted the U.S. dollar while suppressing gold demand 📉.
This week, gold prices defied market expectations: fueled by geopolitical conflicts, gold surged last Friday and opened higher on Monday, only to trend lower thereafter ⬇️. The hourly chart shows a series of lower lows, with 3,400 emerging as short-term resistance, while gold currently oscillates around 3,380 🔄. With key economic data pending release, gold may still rebound (the initial jobless claims data was advanced to Wednesday) ⏰.
Technically, gold remains in a unilateral uptrend on the daily chart, with strong support at 3,365/3,350 from the 5-day and 10-day moving averages—though not yet in an extremely strong trend 📈. Key resistances lie at 3,430/3,450: a break above 3,450 could pave the way for a challenge to the previous high of 3,500 🏔️!
⚡️⚡️⚡️ XAUUSD ⚡️⚡️⚡️
🚀 Buy@ 3365 - 3375
🚀 TP 3395 - 3405
Accurate signals are updated every day 📈 If you encounter any problems during trading, these signals can serve as your reliable guide 🧭 Feel free to refer to them! I sincerely hope they'll be of great help to you 🌟 👇
