GOLD Will Keep Falling!
HI,Traders !
GOLD is going down
Now and the pair broke
The rising support line
Made and is going
Down again now so we are
Bearish biased and we will
Be expecting a further
Bearish move down !
Comment and subscribe to help us grow !
Xauusdsignals

Gold Enters PRZ and TRZ – Correction is Coming!?Gold ( OANDA:XAUUSD ) moved as I expected in the previous Idea and reached the Resistance zone($3,387-$3,357) and Resistance lines .
Gold is moving near the Resistance lines , Resistance zone($3,387-$3,357) , Potential Reversal Zone(PRZ) and Time Reversal Zone(TRZ) .
Also, we can see the Regular Divergence(RD-) between Consecutive Peaks .
In terms of Elliott Wave theory , Gold appears to be completing microwave 5 of Main wave 3 , so Main wave 3 could have an extended structure .
I expect Gold to experience at least one correction after entering the PRZ and TRZ , the correction could continue to $3,329 . If the Support lines are broken, the next target could be the Support zone($3,280-$3,245) .
Note: If Gold touches $3,420, there is a possibility of further pumping and breaking the Resistance zone($3,435-$3,406).
Gold Analyze ( XAUUSD ), 2-hour time frame.
Be sure to follow the updated ideas.
Do not forget to put a Stop loss for your positions (For every position you want to open).
Please follow your strategy; this is just my idea, and I will gladly see your ideas in this post.
Please do not forget the ✅' like '✅ button 🙏😊 & Share it with your friends; thanks, and Trade safe.

Gold plummeted? Here comes the latest analysis.Today, the gold market continued its downward trend. It failed to break through the key resistance level of $3,365 in the early stage, and then fell under pressure. It is a normal price adjustment for the Asian market to break through the previous support level. The current price fluctuates around the strong support of $3,300. Coupled with several news to be released in the United States, the price trend is full of uncertainty. In this period of time, I don’t think it is suitable for shorting.
From the 4-hour chart, gold has insufficient upward momentum. After failing to break through the upward resistance level for a long time, it began to decline.
In the market last week, the price has always fluctuated between $3,330 and $3,365. In the narrow range of fluctuations, once a new trend appears, whether it is upward or downward, it may accelerate the price fluctuation range in a very short time; this is an instant release after accumulating energy. This is why the Asian markets suddenly started to move downward.
From the current market situation, the bulls are under great pressure, which is completely different from the strong upward pattern last week. At present, the trend of gold is more dominated by weak fluctuations.
Based on the current trend, we still follow the strategy of high-altitude and low-volume trading in our operations.

Gold price pullback. How to trade?Information summary:
On Monday, due to Trump's policy changes, high tariffs on the EU were suspended. The market's risk aversion sentiment has declined, and spot gold fell at the opening, but recovered some of its losses in the US market, maintaining a consolidation range of 3320-3355.
When the US market opens, there must be large fluctuations. Gold recovered all the gains on Friday due to the increase in tariffs on the EU on Monday. Then, when the US market opens, it is very likely to rise sharply, and also recover the losses on Friday.
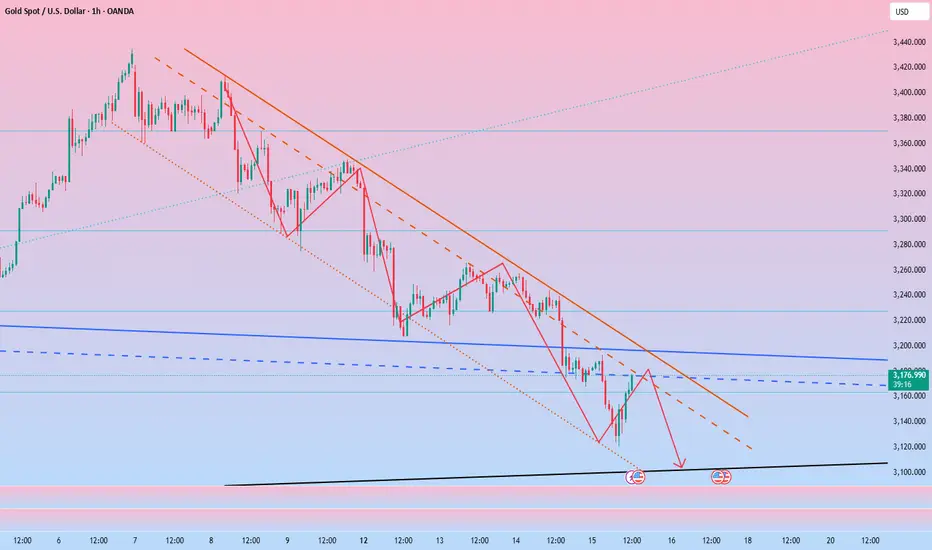
And from the current gold 1-hour chart:
The current trend line of gold has fallen below, and the early trading has also completed the retracement. Therefore, gold may go down next. There is a high probability that it will test the bottom support position of 3310-3300.
From the daily chart:
You can see that the daily chart is currently an important support position near 3300. Once it falls below 3300, it can be officially confirmed that the correction trend is coming. And the trend after the US market opens is critical.
Operation strategy:
Short immediately, stop loss 3335, profit range 3310-3300.

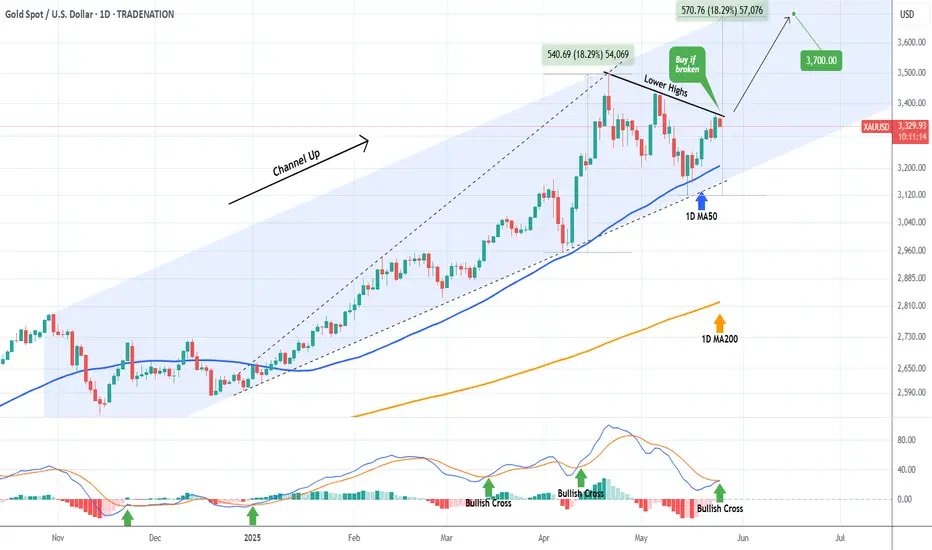
XAUUSD This is the level to look for a break-out.Gold (XAUUSD) has been trading within a Channel Up since the October 30 2024 High, which then transitioned inside it into a Bullish Megaphone. The recent May 15 rebound took place on the 1D MA50 (blue trend-line), which has been the pattern's Support since basically the start of the year (January 08 2025).
Today however we see this rebound taking a pause on the Lower Highs trend-line that started on the April 22 High and until it breaks we can't speculate on a bullish price action as it is more likely to test again the 1D MA50, if not break the pattern downwards.
If however Gold closes a 1D candle above the Lower Highs trend-line, we will turn bullish again, targeting 3700 (+18.29% from the bottom, similar to the previous Bullish Leg).
Notice also that the 1D MACD just completed a Bullish Cross, which favors the buyer's case.
-------------------------------------------------------------------------------
** Please LIKE 👍, FOLLOW ✅, SHARE 🙌 and COMMENT ✍ if you enjoy this idea! Also share your ideas and charts in the comments section below! This is best way to keep it relevant, support us, keep the content here free and allow the idea to reach as many people as possible. **
-------------------------------------------------------------------------------
Disclosure: I am part of Trade Nation's Influencer program and receive a monthly fee for using their TradingView charts in my analysis.
💸💸💸💸💸💸
👇 👇 👇 👇 👇 👇
Critical Resistance Ahead–Will Gold Confirm the Bullish Reversal🔶 What happened last week on Gold (XAUUSD)?
Last week was an excellent one for Gold bulls – the price surged by nearly 1500 pips, fully recovering the drop from the 12–16 May week.
Looking at the chart, the decline from the last ATH at 3500 appears clearly corrective, forming a classic ABC 3-wave pattern which now seems complete.
Gold is currently testing a major confluence resistance zone, aligned with:
• The 17 April ATH
• The end-of-April resistance
• And the early May support
Also worth noting: this week’s breakout above resistance followed the formation of an ascending triangle, which is typically bullish.
________________________________________
❓ Key question – Will the bullish move continue, or will price reject from here?
________________________________________
🔍 Why a bullish continuation is probable:
1. The ABC corrective structure seems to have ended.
2. Price broke out after an ascending triangle – a bullish signal.
3. The broader structure still leans bullish after the ATH at 3500.
________________________________________
⚠️ But this resistance zone is critical:
• Without a clear breakout above 3360 zone, bulls don’t have full control.
• A drop below 3300 would shift momentum back to the bears, with 3360 becoming a potential lower high.
________________________________________
🧭 My Trading Plan:
✅ I favor a bullish scenario, aiming for:
• 3430
• 3500 (ATH retest)
❌ This outlook gets invalidated if price falls below 3300 – in that case, I’ll reassess for more downside.
________________________________________
🚀 The market must confirm the direction. We’re just here to read the map.
Disclosure: I am part of Trade Nation's Influencer program and receive a monthly fee for using their TradingView charts in my analyses and educational articles.

XAUUSD[GOLD]: Another Possible Swing Sell Happening! Swing MoveGold rejected twice as we had described in our last two analyses on Gold. We remain heavily bearish on Gold and expect a swift bearish move within the next week or following week. We are eyeing two targets. Please use this analysis accordingly and avoid overtrading. This is not a confirmation, and do not use the marked arrow as an entry or exit point. The marked red area drawn there represents a potential reversal zone from which price may reverse.
As always, this analysis does not guarantee that price will move as described in the chart. Please use your own knowledge and trading plan while trading Gold. Good luck and trade safely.
Want to support us? Do the following ❤️
-LIKE THE IDEA
-COMMENT YOUR VIEW
-SHARE IF YOU AGREE
Much love ❤️
Team Setupsfx_

GOLD (XAUUSD): More Growth Ahead?!
Gold violated a significant intraday horizontal resistance on Friday.
The broken structure and a rising trend line compose a strong
contracting demand area now.
It will be a perfect spot to try to buy Gold after a pullback.
Next goal for the buyers will be 3400.
❤️Please, support my work with like, thank you!❤️
I am part of Trade Nation's Influencer program and receive a monthly fee for using their TradingView charts in my analysis.

XAUUSD[GOLD]: Bearish Correction Is Happening! Gold rejected at 3350, dropping almost 600 pips to 3290. We can expect the price to drop further to around 3250, potentially reversing from there. A possible entry point is 3304, followed by a drop from there.
If you’d like to contribute, here are a few ways you can assist us:
- Like our ideas
- Comment on our ideas
- Share our ideas
Team Setupsfx_🚀❤️

GOLD D1 chart update for the 26-30 May weekkindly read level carefully as market on it's way to ATH but keep in mind downside some major retracements are remains pending
Right all eyes on 3330 level if market successfully sustain below 3330 then it will definitely move towards 3300 or even 3280 and then 3250
Main levels for the week 3400 \ 3250 \ 3308

Gold Retests Broken Resistance – Is the PRZ Next?As I expected in the previous IDEA , Gold ( OANDA:XAUUSD ) managed to break the Resistance zone($3,280-$3,245) and touched the first target .
Gold appears to be completing a pullback to the Resistance zone($3,280-$3,245) .
On my chart , the Resistance zone($3,280-$3,245) is currently labeled Support zone($3,280-$3,245) .
I expect Gold to move towards the Potential Reversal Zone(PRZ) and Resistance lines after the pullback is completed .
Note: If Gold touches $3,243 , we should expect a drop.
Gold Analyze ( XAUUSD ), 1-hour time frame.
Be sure to follow the updated ideas.
Do not forget to put a Stop loss for your positions (For every position you want to open).
Please follow your strategy; this is just my idea, and I will gladly see your ideas in this post.
Please do not forget the ✅' like '✅ button 🙏😊 & Share it with your friends; thanks, and Trade safe.

5/23 Gold Analysis and Trading SignalsGood afternoon everyone!
Gold did not touch our key buy or sell zones yesterday, but flexible intraday range trading worked well, resulting in decent profits.
Currently, the price has reached around 3330, and from a technical standpoint, bulls remain in control. If no negative surprise hits the market, gold could target 3368 today, with a potential to test 3400 resistance next week.
🔔 On the news front, two key events during the U.S. session today deserve attention:
A speech by Fed Governor Lisa Cook on financial stability — may provide hints about the Fed’s stance.
An executive order signed by Donald Trump, which might impact markets depending on its content (e.g., taxes, tariffs, or spending).
Also, note that U.S. markets will be closed next Monday, but this is unlikely to cause major disruptions. Positions held over the weekend can still be adjusted during the Asian session on Monday.
📈 Today’s Trading Recommendations:
📉 Sell near 3382–3398 (Resistance zone)
📈 Buy near 3274–3256 (Support zone)
🔁 Flexible trading levels:
3285 / 3296 / 3307 / 3316 / 3328 / 3337 / 3346 / 3361 / 3373

XAUUSD How VIX points to a Gold Bear Cycle.Gold (XAUUSD) may be on a 5-week correction but on the long-term it remains within a Channel Up since the October 31 2022 Low. That was essentially when its Bear Cycle ended and the new Bull Cycle (Channel Up) started.
The previous Bull Cycle stopped 4.5 months after the Volatility Index (VIX) shown in blue, peaked during the March 2020 COVID flash crash.
We are now on a similar situation as VIX topped on the week of March 31 2025 during the Trade War and has already started to decline aggressively.
In symmetrical terms, we could be around the end of May 2020 on Gold's last short-term pull-back before the final rally to the August 03 2020 Top (where its Bear Cycle started).
As a result, according to this correlation, we may see Gold forming a Bull Cycle Top by the end of July (2025) and then start a new +2 year Bear Cycle.
-------------------------------------------------------------------------------
** Please LIKE 👍, FOLLOW ✅, SHARE 🙌 and COMMENT ✍ if you enjoy this idea! Also share your ideas and charts in the comments section below! This is best way to keep it relevant, support us, keep the content here free and allow the idea to reach as many people as possible. **
-------------------------------------------------------------------------------
💸💸💸💸💸💸
👇 👇 👇 👇 👇 👇

Gold rebound height is limited, short goldTechnical aspects:
Gold has failed to make a major breakthrough in the recent rebound process, and the rebound height has been limited to a smaller and smaller level. Overall, gold is now in a state of shock and short position; as the center of gravity of gold shifts downward, the current short-term resistance is in the 3220-3230 area; and gold has tested downward many times recently, which makes it easier for gold to fall below 3200. Once gold falls below 3200 again, it is very likely to extend to 3190, or even around 3160.
Trading strategy:
Consider starting to short gold in batches in the 3220-3230 area, TP: 3205-3195

Gold still has the potential to rebound, continue to buy goldTechnical aspect:
Gold has just retreated to around 3217 and then rebounded again. It has now rebounded to around 3235. Although the rebound strength is a little weak, it has even hovered around 3235 for a long time. But structurally, gold did not destroy the rising structure during the decline, and the strength of structural support was strengthened after the effective retracement support. After being recognized and accepted by the market, gold will continue to rise with structural support. Once gold breaks through the short-term resistance area of 3250-3260, it will continue to rise to 3280-3290, or even around 3320.
Trading strategy:
Before the short-term rising structure is destroyed, we can still continue to try to go long on gold in the 3325-3315 area, TP: 3240-3250

GOLD Will Grow!
HI,Traders !
GOLD is trading in an
Uptrend and Made a bullish breakout
And a pullback so affter
The retest of the broken
Falling resistance which
Is now a support we will
Be expecting a further
Bullish move up !
Comment and subscribe to help us grow !

XAUUSD Targeting the 1D MA100.When we looked at Gold (XAUUSD) on May 05 (see chart below), we called for a strong sell on the 1D MA50 (blue trend-line) and a 3155 Target:
Now that this target was hit and the 1D MA50 broke, we expect a short-term bearish continuation, as the last 3 times the price broke below the 1D MA50, it always hit the 1D MA100 (green trend-line).
Still, all candles since the test closed above the 1D MA50 so we need to seek a confirmation of the bearish continuation and that is the 4H MA50 (red trend-line). If rejected there, expect an instant drop. If not, the last Resistance is the top of the Channel Down. In both cases, our short-term Target is 3060.
-------------------------------------------------------------------------------
** Please LIKE 👍, FOLLOW ✅, SHARE 🙌 and COMMENT ✍ if you enjoy this idea! Also share your ideas and charts in the comments section below! This is best way to keep it relevant, support us, keep the content here free and allow the idea to reach as many people as possible. **
-------------------------------------------------------------------------------
Disclosure: I am part of Trade Nation's Influencer program and receive a monthly fee for using their TradingView charts in my analysis.
💸💸💸💸💸💸
👇 👇 👇 👇 👇 👇

Gold fluctuates greatly. What will happen next week?Gold fluctuated greatly on Thursday and Friday. It is difficult to implement an operation strategy in this market. It is difficult to go short or long. The market does not continue the next day, and there are few suitable trading opportunities in the process of changing the market. So what should gold do next week? Has the rhythm of gold changed again?
The rhythm of gold has changed rapidly recently, and next Monday is actually the key; the 1-hour moving average of gold has begun to show signs of turning, so whether it can form an upward trend is the next key.
The strength of gold on Monday is very important. Gold closed with a big positive line on Thursday, but it fell directly on Tuesday and pierced the support level, which cannot be said to be completely bullish. Although it rebounded slightly in the late trading, it still closed with a real big negative line.
Next week, we need to pay attention to two key positions. Pay attention to $3175 below. If it falls and breaks quickly after the opening on Monday, then gold will still be weak overall; pay attention to $3215 above. If gold breaks through this point strongly and stabilizes above the point, then gold will be strong overall.
If gold opens flat in early trading on Monday and the upward momentum is not strong, then you can continue to short in the short term.

XAUUSD[GOLD]; Is it the beginning of the major correction? XAUUSD dropped from 3265$ to 3127$, as predicted in our previous analysis. However, after touching 3127$, the price has retraced slightly and is currently trading at 3178$. In our opinion, the price can go up to $3220 maximum and reject at that level. We need to wait and see how prices behave. Another possible entry point is at 3178$, which is the current trading price. We believe this region is good for selling because the price has struggled to break through it. Please use a proper trading plan while trading gold.
As always, this analysis doesn’t guarantee that price will move as described in the chart. Please use your own knowledge and trading plan while trading gold. Good luck and trade safely.
Want to support us? Do the following ❤️
-LIKE THE IDEA
-COMMENT YOUR VIEW
-SHARE IF YOU AGREE
Much love ❤️
Team Setupsfx_

5/16 Gold Trading Signals
🌇Good afternoon, everyone!
Gold made a strong one-way rally from 3120 to above 3200 yesterday, perfectly achieving our bullish target with substantial profits.
Today, after a slight uptick at the open, gold started to pull back and enter a consolidation phase. Technically, this is a normal correction after a $120 surge. However, the key question now is:
🔍 Is this just a healthy pullback, or a bearish continuation pattern?
There’s some uncertainty in the current structure:
On the larger scale, the market still appears to be forming a double top.
On the shorter-term, this week’s pattern resembles a head and shoulders bottom, and price is now testing the neckline zone.
🧭 So, while the direction remains unclear, we can still identify key trading zones to act on.
🗞 News Watch:
Several important U.S. data releases are scheduled during the New York session. They may provide crucial directional signals for gold.
📌 Today’s Gold Trading Strategy:
🟢 Buy Zone: 3176 – 3148
🔴 Sell Zone: 3265 – 3287
🔄 Flexible Trading Zones (watch for reversals or breakout plays):
▫️3187-3198-3209-3237-3258-3267
✅ Reminder: With the structure being complex and direction unclear, avoid aggressive positioning. Focus on scalp or short-term trades near key zones and react to market post-data.

Continue to short gold after the reboundFundamentals:
1. Focus on Powell's speech at the Thomas Laubach Research Conference;
2. Pay attention to the situation of the Russia-Ukraine negotiations;
Technical aspects:
Gold has successively broken through the important support area of 3200 and 3160, and continued to around 3120; the short-term bearish trend is very obvious; although gold has rebounded to around 3170 again in the short term, I think the reason is one of the technical rebound repair after the decline; the second is the result of profit-taking of some short positions. So I fully believe that gold has the need to fall again after the rebound;
At present, we need to focus on the resistance of the 3175-3180 area, followed by the resistance of the 3195-3200 area; if gold cannot break through this resistance area during the rebound, gold is expected to fall again and continue to the area around 3100.
Trading strategy:
Consider the opportunity to short gold after gold rebounds to the 3275-3285 area; TP: 3150
TVC:DXY FOREXCOM:XAUUSD OANDA:XAUUSD CAPITALCOM:GOLD
Rebounds are opportunities to short goldAt present, gold has tried to fall below the 3200 mark and completely broke the recent low support, laying the foundation for the downward structure. As the center of gravity of gold shifts downward, the upper resistance also moves down to the 3210-3220 area. The relatively clear support below in the short term is in the 3165-3160 area, and after breaking this area, it may even continue to the 3105-3100 area.
Trading strategy:
Consider continuing to short gold in the 3210-3220 area, TP: 3180-3170
CAPITALCOM:GOLD OANDA:XAUUSD FOREXCOM:XAUUSD TVC:DXY

Gold 3200 Life and Death Battle!Gold stabilized after touching the support of the 3193-3202 rising trend line. Although the US market rebounded, it did not form an effective breakthrough. In the short term, it is still dominated by shorts.
Short-term strategy:
Before 3200 is broken, you can go long on dips. If it falls below, stop the loss decisively, and use a small stop loss to game the potential bull reversal. Whether the 3250 pressure is broken or not determines the short-term direction
