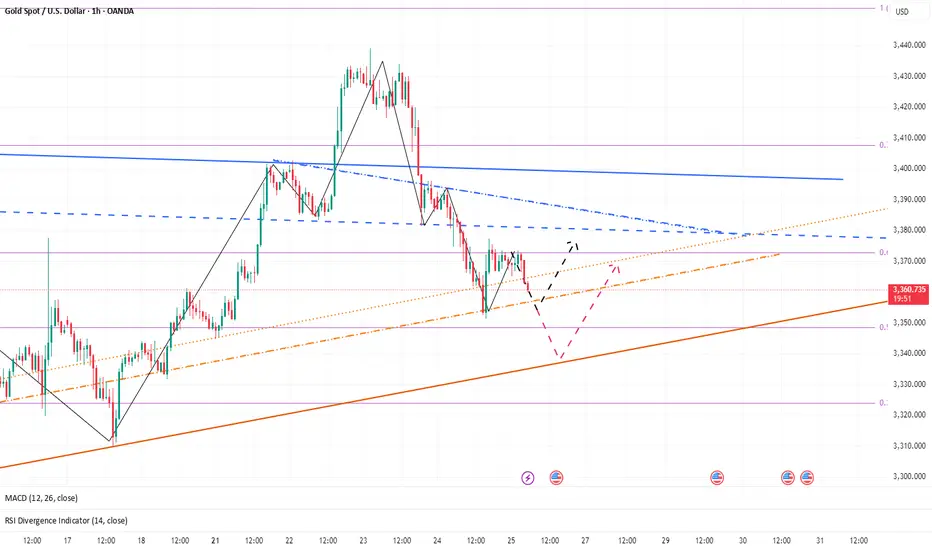
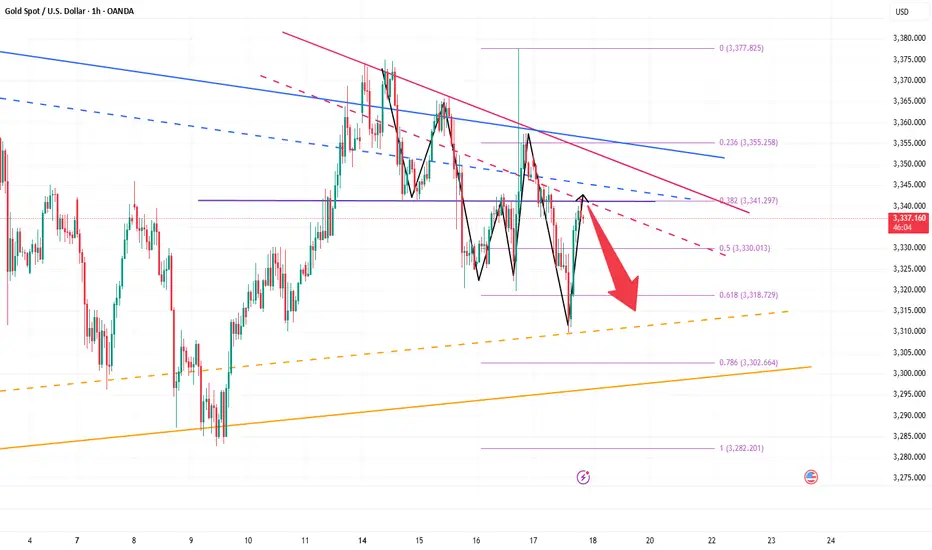
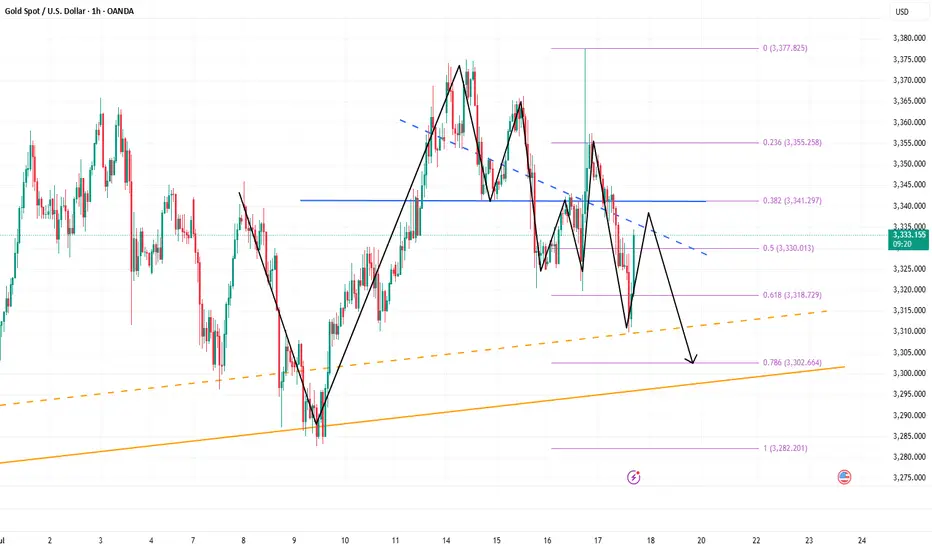
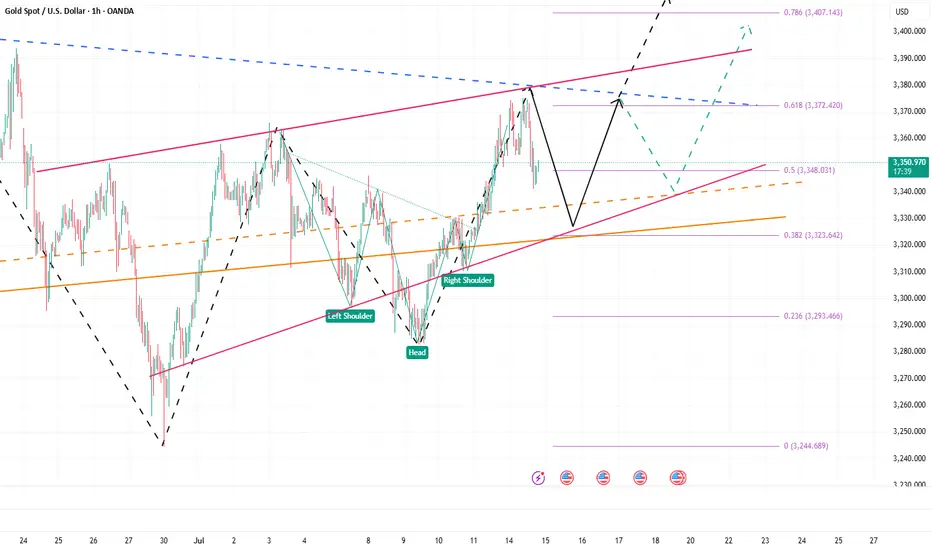
Gold Softens — Watching for a Tactical Long OpportunityYesterday, gold hit a low of around 3351 and then began to rebound. During the rebound, it hit a high of around 3377 and then retreated again. We can clearly see that below 3400, gold is still weak overall, and even failed to reach 3380 during the rebound. In the short term, the 3380-3390 area has become an obvious resistance area.
Yesterday, gold rebounded after dropping to around 3351. Whether the support near 3350 is effective has not been verified again, so from a technical perspective, gold still has the need to retreat again and test the support near 3350. Once gold falls below the area when testing the support near 3350, gold may continue to fall to the 3335-3325 area.
Therefore, in today's trading, the focus is still on shorting gold, supplemented by trying to go long on gold with the support.
1. Consider shorting gold in the 3380-3390 area, TP: 3365-3355;
2. Consider going long gold in the 3355-3345 area, TP: 3365-3375; strictly set SL
3. If the 3355-3345 area is broken, try to go long gold again in 3335-3325, TP: 3360-3370
Xauusdtechnicalanalysis
350pips Secured — Focus Shifts to Dip-Buying StrategyToday's trading was very successful, and the grasp of the long and short rhythm was very accurate. Today's trading situation is as follows:
1. Close the short position with an overnight entry price of around 3386 near 3380, with a loss of 60 pips, and the loss amount exceeded $6K;
2. Directly short gold near 3380, manually close the position near 3366, profit 130pips, profit amount exceeded $12K;
3. Long gold near 3356, hit TP: 3372 and end the transaction, profit 160pips, profit amount exceeded $8K;
4. Long gold near 3362, hit TP; 3375 and end the transaction, profit 120pips, profit amount exceeded $6K.
Intraday trading summary: Today, the long and short sides completed a total of 4 transactions, one of which suffered a loss, but the net profit was 350pips, and the profit amount exceeded $20K. For short-term trading, I think I can submit a satisfactory answer to myself today!
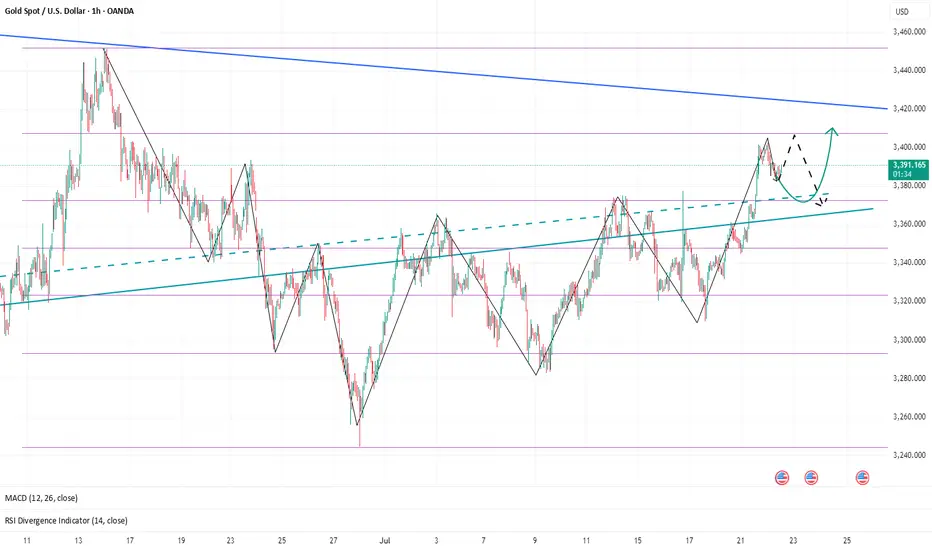
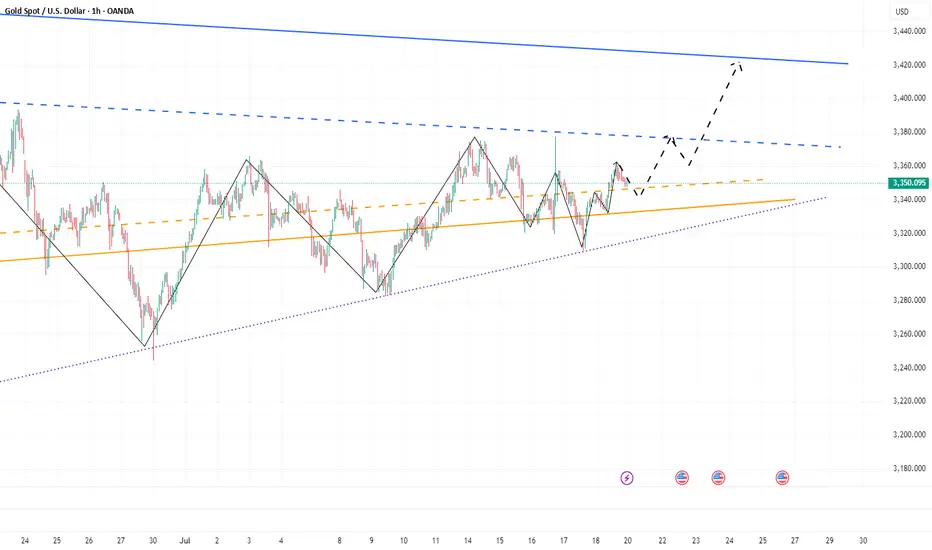
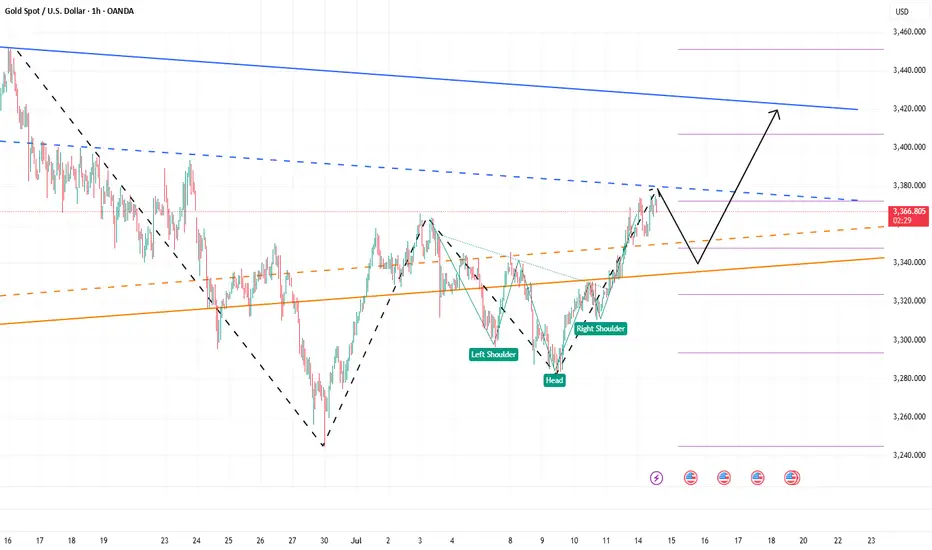
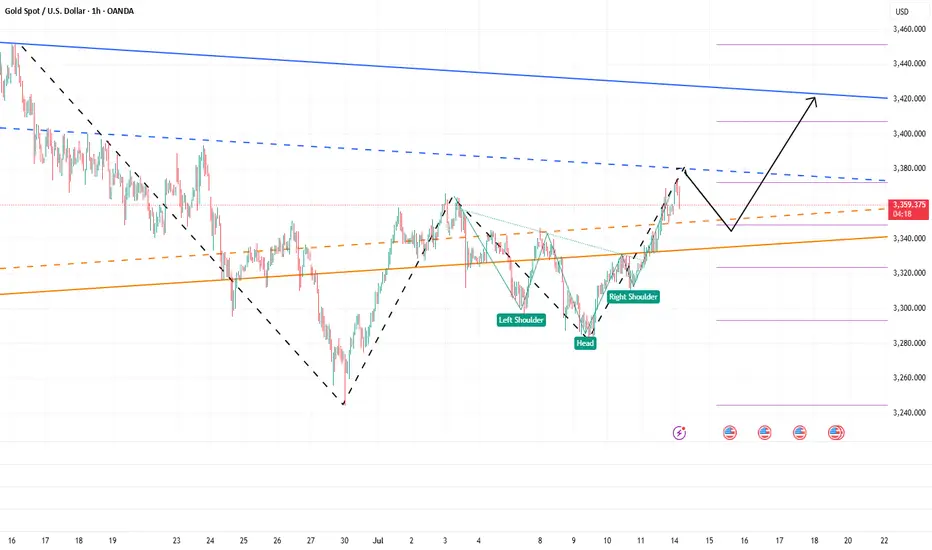
How to execute the transaction next? Gold started to pull back from around 3438 and has now reached a low of around 3351, with a retracement of more than 870pips. The retracement space is not small. However, gold has stabilized above 3350 and has started a technical rebound repair, and the upward force is not weak, so gold may have completed the retracement. Under the support of these two technical conditions, gold may regain its upward momentum and hit 3400 again.
At present, the short-term resistance is obvious, located in the area near 3380. Once gold breaks through 3380, gold will inevitably continue to rise and hit 3400 again; but I think as long as gold stabilizes above 3350, it is not difficult to break through the short-term resistance of 3380, so gold will inevitably test the 3400 mark again; and the short-term support below is in the 3365-3355 area. Gold may still retreat to this area first during the rise in order to increase liquidity and accumulate momentum, helping gold to break through 3380 more easily.
So for the next short-term trading, I think it is feasible to go long on gold in the 3365-3355 area, first looking at the target area of 3380-3390, and then 3400.

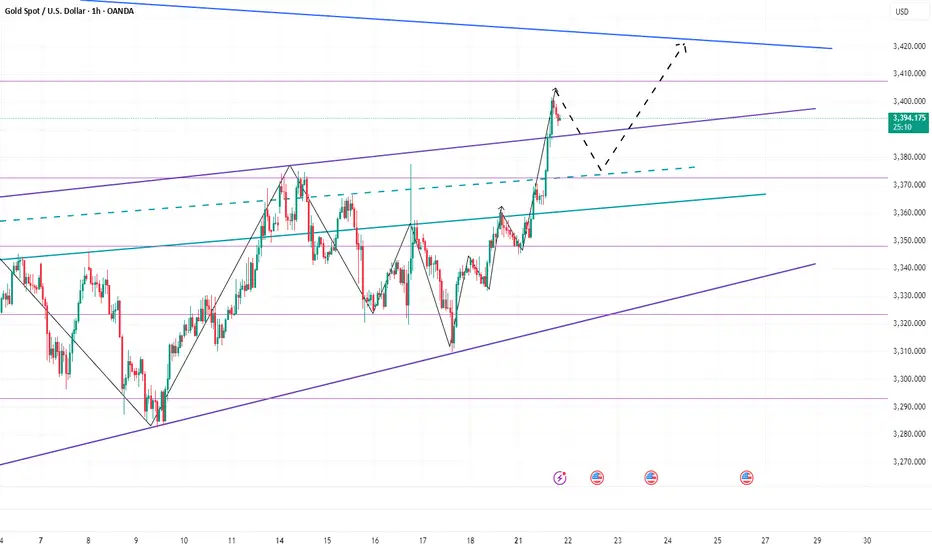
Double Down on Gold — Targeting 3400–3410!Obviously, gold did not give us the opportunity to short gold near 3440 today. In the process of its recent pullback, gold tested 3400 as expected, and after falling below 3400, it continued to fall to around 3385 as if it was planned by me. Although the lowest point had reached around 3381, it quickly rebounded above 3385. What is relatively regrettable today is that both of our plans to short gold ended in failure. The first time was when gold did not give us the opportunity to short near 3440. The second time was when we were preparing to short gold at 3400 and set the TP to 3385. However, we did not have time to create an order because the price fell too quickly, causing us to miss the gold short trade again.
At present, I have a trading order to go long on gold near 3386. And I go long on gold with twice the usual trading volume. Why am I still optimistic about the rebound of gold in the short term after the gold price fell by nearly $60? Because the area around 3385 is the short-term bull-bear dividing line, although gold has fallen sharply, as long as it stays above the area around 3385, gold is still in a bullish trend as a whole, and the bullish structure has not been destroyed, so in the short term, gold still has a lot of room for rebound after the pullback. This is why I dare to use twice the usual trading volume to buy gold near 3386.
However, because the current gold long and short continuity is not strong, and the market uncertainty is still increasing due to complex news, the gold market is prone to violent fluctuations in the short term, so we have to be more careful in trading. At present, I still hold a gold long position near 3386, and I hope that gold can continue to rebound to the target area: 3400-3410.

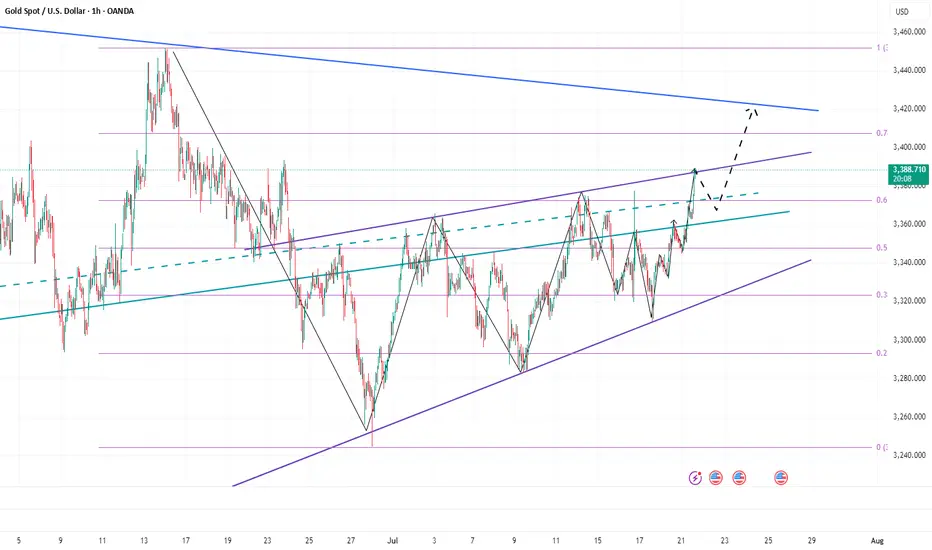
More Pain for Gold? The Charts Say It’s PossibleSince the start of the London market, gold has almost maintained a narrow range of fluctuations in the 3390-3385 area. Compared with yesterday, the market is much weaker today, and gold has failed to stabilize at 3400 several times, indicating that the sentiment of cashing out near this area is also very high. From the current gold structure, gold is obviously biased towards a long structure. Since gold broke through 3400, 3375-3365 has become the key support area after the top and bottom conversion in the short term.
However, gold rose strongly yesterday but did not stabilize at 3400. The bullish sentiment may no longer be strong. Moreover, after the accelerated rise in gold, the sustainability was not strong, so gold still needs to retreat in the short term. This is why I insisted on shorting gold again near 3400 yesterday. Therefore, I think gold has not yet retreated to the right level. I will pay attention to the opportunity to go long on gold after it pulls back to the 3375-3365 area.
Gold fell after touching 3400 twice. Whether a short-term effective "M" double top structure has been formed, I think more signals are needed to verify. However, in the short term, it is still under pressure in the 3405-3410 range, so if there is no major positive news, I think gold may maintain a wide range of fluctuations in the 3410-3360 range. Therefore, if gold rises to the 3400-3410 range again, I will continue to try to short gold!
Gold’s Rapid Surge: A Trap Before the Drop?Gold finally showed signs of retreat. We are still holding a short position near 3400. So far, we have made a profit of 50 pips. However, I will still hold it to see if gold can fall back to the 3385-3375 area as expected. We have completed 2 transactions today, and there is still 1 transaction left to hold.
1. First, we bought gold near 3345 and ended the transaction by hitting TP: 3370, making a profit of 250 pips, with a profit of more than $12K;
2. We shorted gold near 3385 and ended the transaction by hitting SL: 3395, with a loss of 100 pips, a loss of nearly $5K;
3. We are still holding a short gold transaction order near 3400, with a current floating profit of 60 pips and a floating profit of nearly $4K;
The above is the detailed transaction situation today. To be honest, today's rebound strength far exceeded my expectations, and after our first long position hit TP, the market never gave any chance to go long on gold after a pullback, but accelerated to around 3401. But obviously, the accelerated rise of gold is suspected of catching up with the top, and in the short term it faces resistance in the 3405-3410 area, and secondly pressure in the 3420-3425 area. So I don't advocate chasing gold at the moment. On the contrary, I am still actively trying to short gold around 3400, first expecting gold to pull back to the 3385-3375-3365 area.
And I think if gold wants to continue to test the 3405-3415 area, or even sprint to the area around 3425, gold must go through a pullback to increase liquidity to accumulate upward momentum. I think it will at least pull back to the 3385-3375 area.
Warning Signs After Gold’s Sharp Rise — Is a Pullback Coming?Today, gold rebounded from around 3345, and has now rebounded to around 3389, which is only one step away from the 3400 mark. Gold has hardly retreated during the rise, and the rise is strong. However, we can see from the small-level candle chart that gold suddenly accelerated its rise after consolidating around 3365, and continued to around 3390, and is now oscillating near the recent high trend line.
After gold accelerated its rise and oscillated near the recent high trend line, this made me have to be more cautious, because we must be careful that the acceleration of gold's rise in the short term is a trap for buyers, so even if we are bullish on gold in the short term, we should not directly chase gold at a high level; according to the current structure of gold, I think it is necessary for gold to retest the 3370-3360 area support before continuing to rise and hitting 3400. Only after verifying that the support in this area is effective can it be conducive to a better rise in gold!
So for short-term trading, I think we can still try to short gold now, and then wait patiently for gold to retest the 3370-3360 area.
Is This the Start of a New Gold Bull Run?News that must be paid attention to:
1. The Middle East region is in constant conflict and the situation is unstable, which may re-stimulate the market's risk aversion sentiment;
2. Trump strongly called for a rate cut, and many Fed directors agreed to the rate cut. Under the situation of internal and external troubles, can Powell withstand the pressure of rate cuts? In addition, the tense relationship between Trump and Powell, as well as the development of Powell's dismissal storm, have increased the market's risk aversion demand and enhanced the market's bullish sentiment;
3. The uncertainty brought about by the tariff issue may disrupt the market.
Technical aspects:
This week, the gold market is roughly a bottoming out and rebounding trend. We can clearly see from the recent candle chart that the recent trend line suppression is located near 3380, and this week gold has repeatedly encountered resistance and fallen in the 3375-3380 area, which has strengthened the suppression effect of resistance in this area to a certain extent; and gold has repeatedly tested the 3320-3310 area support during the retracement process. Gold has not fallen below the support of this area during multiple retracements, giving the market bulls great confidence.
On Friday, gold hit 3360 during the rebound and closed above 3350, which is strong in the short term. As gold continues to rebound, the current bull-bear dividing line is in the 3345-3335 area. If gold cannot even fall below the 3345-3335 area during the retracement next week, it will greatly boost buying power and is expected to hit the 3380 area again. Once gold breaks through the 3380 area during the rise, there will be a chance to further continue the rise and test 3400, or even the 3420 area.
Therefore, at the beginning of next week, if gold retreats to the 3345-3335 area for the first time, I think we must make an attempt to buy gold, first focusing on the target 3370-3380 area, and then bullish to the 3400-3420 area after a strong breakthrough.
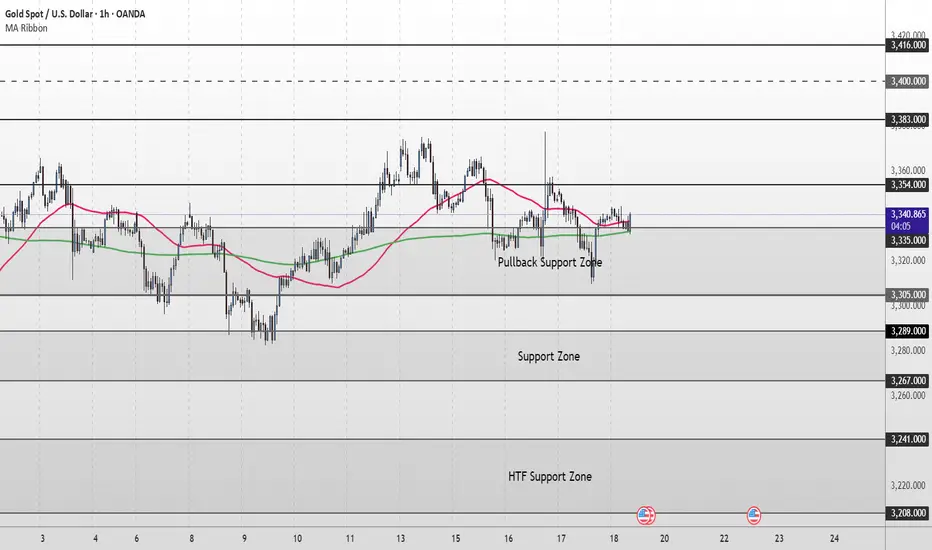
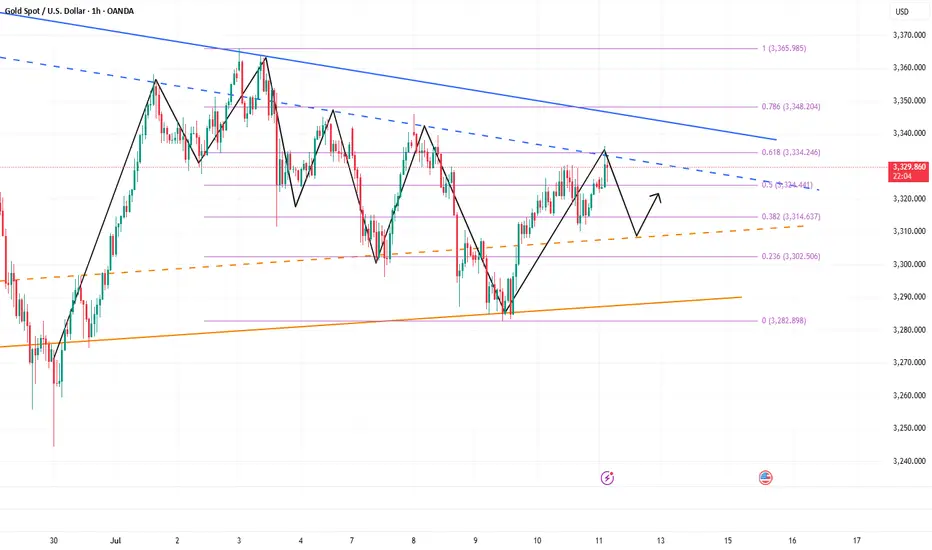
Gold Short Term Outlook Gold has held above the Pullback Support Zone (3,335–3,305) after yesterday’s volatility, with buyers stepping in to defend the zone.
Price is now trading around 3,338, caught between the 50MA and the 200MA.
Despite the recent dip, the structure remains supportive as long as price holds above 3,335.
A clean break and hold above 3,354 would confirm renewed bullish momentum, opening the path toward 3,383 and 3,400, with 3,416 as a higher‑timeframe target.
If price fails to clear 3,354 and turns lower again, watch for signs of exhaustion back into the Pullback Support Zone (3,335–3,305).
A decisive break below 3,305 would shift focus to the Support Zone (3,289–3,267), with further downside exposing the HTF Support Zone (3,241–3,208).
📌 Key Levels to Watch
Resistance:
‣ 3,354 ‣ 3,383 ‣ 3,400 ‣ 3,416
Support:
‣ 3,335 ‣ 3,305 ‣ 3,289 ‣ 3,267 ‣ 3,241
🔎Fundamental Focus
📌 4:00pm: UoM Sentiment & Inflation Expectations – can spark sharp USD/gold moves.
➡️ Expect volatility around releases.
Gold’s Last Stand? Major Retest at 3310–3300 Under the influence of negative news, gold today fell below the recent low of 3320 and continued to fall to around 3310. The current gold structure looks particularly obvious, the center of gravity of gold gradually moves downward, and the short trend is extremely obvious; however, as gold repeatedly probes the 3320-3310 area, we can clearly see the resistance of gold to falling, and multiple structural supports are concentrated in the 3320-3300 area. So as long as gold does not fall below this area, gold bulls still have the potential to rebound.
However, for now, after experiencing discontinuous sharp rises and falls, gold needs to undergo a short-term technical repair, so it may be difficult for a unilateral trend to appear in the short term. So I have reason to believe that gold will focus on rectification and repair next. The important resistance area we have to pay attention to above is in the 3340-3350 area; and the important support below is in the 3310-3300 area.
Currently, gold is fluctuating in a narrow range around 3340, and the short-term rebound momentum is sufficient, but I still believe that gold will fall back again and test the support of 3320-3300 area after consuming the bullish energy. So for short-term trading, first of all, I advocate shorting gold in the 3340-3350 area, and expect gold to retreat to the 3320-3300 area during the consolidation process.
3340-3300: Lock in the buy high and sell low in this area!Under the influence of unemployment benefits and zero monthly sales data, gold fell sharply in the short term, but it did not effectively fall below 3310 during multiple tests, effectively curbing the further downward space of the shorts. Multiple structural supports are also concentrated in the 3310-3300 area, so as long as gold does not fall below this area, gold bulls still have the potential to rebound.
However, for the current gold market, it may be difficult to see a unilateral trend in the short term. After experiencing discontinuous surges and plunges, gold may focus on consolidation and repair, and the consolidation range may be limited to the 3340-3300 area.
So for short-term trading, first of all, I advocate going long on gold in the 3320-3310 area, and expect gold to rebound and reach the 3330-3340 area;
If gold reaches the 3335-3345 area as expected, we can start to consider shorting gold, and expect gold to step back to the 3320-3310 area during the shock and rectification process.
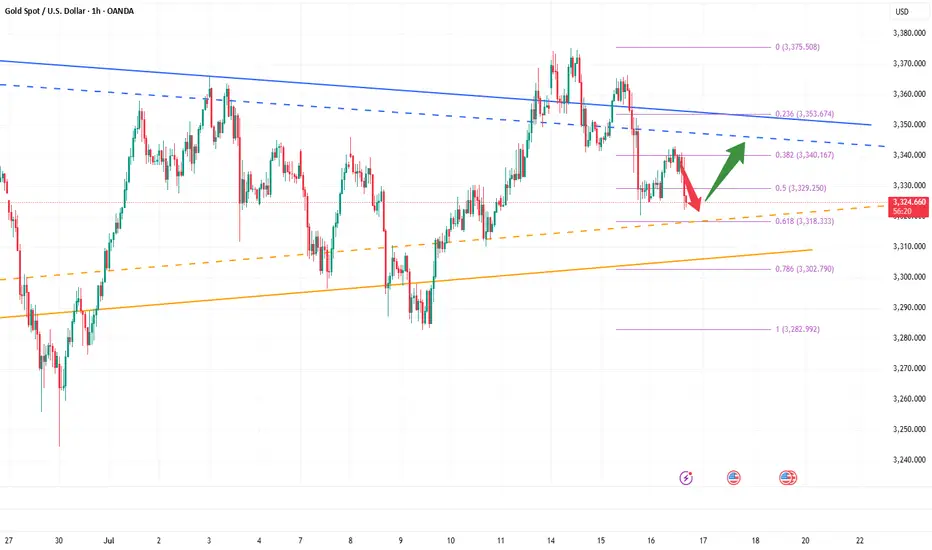
3325–3315: Potential Bullish Reversal ZoneGold maintained a volatile trend today, but the highest intraday price only touched 3343. Overall, gold is still weak, but the bulls have not completely given up, and there is still a certain amount of energy, which limits the retracement space of gold. The current short-term support is in the 3325-3315 area. If gold cannot fall below this area in such a weak situation, the market may reach a consensus that 3325-3315 is the support area, thereby attracting a large amount of buying funds to flow into the gold market, thereby boosting gold to regain the bullish trend again and is expected to hit the 3350-3360 area.
So for short-term trading, I currently prefer to start long gold with the 3325-3315 area as support, first expecting gold to recover some of its lost ground and return to the 3350-3360 area!
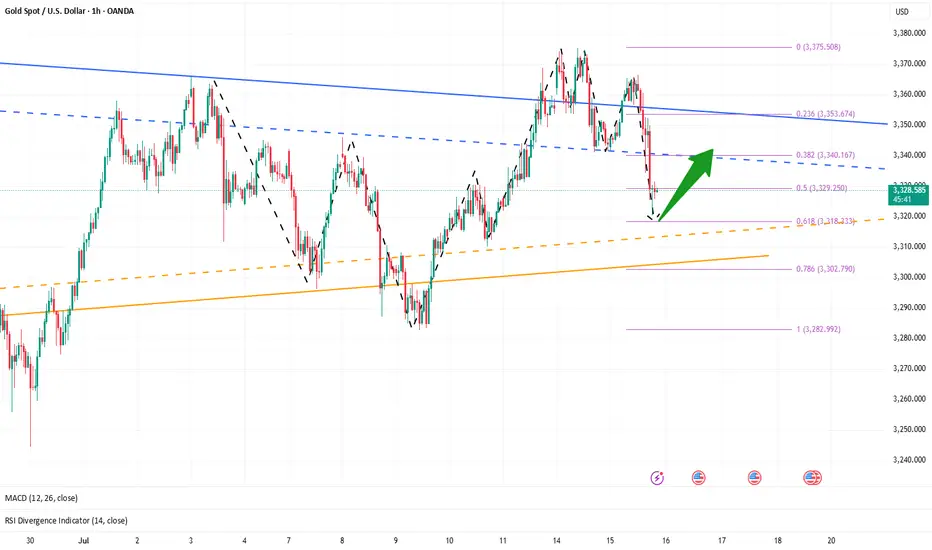
Golden Support Holds — Bulls Poised for Another Leg Higher"If gold cannot break through the 3365-3375 area, gold will fall under pressure again, or refresh the recent low of 3341, and continue to the 3335-3325 area." Gold's performance today is completely in line with my expectations. Gold just retreated to a low of around 3320, but soon recovered above 3325, proving that there is strong buying support below.
From the current gold structure, the short-term support below is mainly concentrated in the 3320-3310 area. If gold slows down its downward momentum and its volatility converges when it approaches this area, then after the gold bearish sentiment is vented, a large amount of off-site wait-and-see funds will flow into the gold market to form strong buying support, thereby helping gold regain its bullish trend again, thereby starting a retaliatory rebound, or a technical repair rebound.
Therefore, for short-term trading, I still insist on trying to go long on gold in the 3330-3320 area, first expecting gold to recover some of its lost ground and return to the 3340-3350 area.
Don’t hesitate, a massive gold move Is brewingRefer to my previous trading idea. Gold retreated as expected. We almost caught the highest point of the day and shorted gold near 3365, and successfully hit TP: 3346, which enabled us to successfully profit 190pips in short-term trading, with a profit of nearly $10K, which is a good result in short-term trading.
Currently, the lowest point of gold in the retracement process has reached around 3335, which has fully released the short energy and vented the bearish sentiment in the market. All the bad news is out, which means good news! Although gold fell from 3375 to 3335, the retracement was as high as $40, but the rising structure has not been completely destroyed. The previous W-shaped double bottom support structure and the resonance effect of the inverted head and shoulder support structure still exist. As long as gold stays above 3325, gold bulls still have the potential to attack.
Moreover, after this round of retracement, the bearish sentiment of gold was vented, and the liquidity was greatly increased, attracting more buyers to actively enter the market. Gold may start a retaliatory rebound, and even touch 3375 again or even break through and continue to the 3380-3390 area.
So for short-term trading, I think we can try to go long on gold in the 3335-3325 area appropriately, first looking forward to gold regaining lost ground: 3350-3360 area, followed by 3380-3390 area.
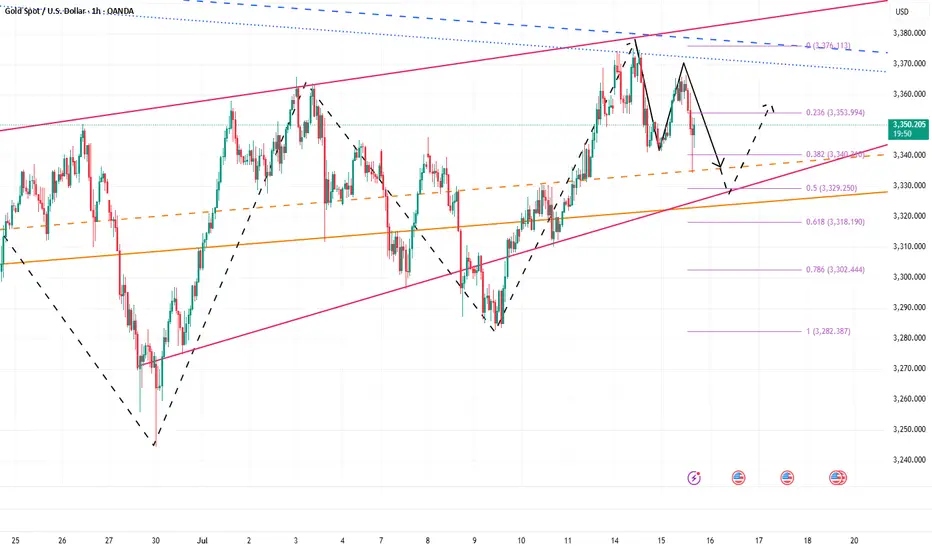
Gold’s Uptrend Is a Mirage, Bears Are Lurking Beneath!Gold repeatedly touched around 3375 yesterday and then fell under pressure, proving that there is strong resistance above. Moreover, after gold retreated and touched around 3341 yesterday, it did not recover in time and stand above 3350. It was not until today that it rebounded and touched around 3365. The rebound cycle has been extended to the present, and the rebound strength is not very strong.
Since gold retreated, it has not been able to recover the lost ground in time. Gold is under pressure in the 3360-3370 area in the short term. If gold cannot successfully break through this resistance area during the day, then gold will retreat again, and will refresh the 3341 low again, and continue to the 3335-3325 area.
So for short-term trading, I think we can try to short gold in the 3360-3370 area appropriately, looking at the target area: 3350-3340
Eyes on 3335–3325: Next Bullish Launchpad!!!Today, gold hit 3375 several times and then fell back after encountering resistance. The lowest has reached 3341. Although the rising structure has not been completely destroyed, and the technical double bottom structure and the inverted head and shoulder structure support resonance effect still exist below, since gold fell below 3350, it has not even been able to stand above 3350 in the current rebound. The gold bull pattern has been weakened to a certain extent, and the market has begun to diverge in the long and short consciousness.
Gold encountered resistance and fell back near 3375 three times, proving that the upper resistance is relatively strong. Gold must increase liquidity by retracement to store more energy for breakthrough, so the short-term correction of gold is actually within my expectations, which is why I advocate brave shorting of gold today! However, according to the current retracement range and the fact that gold has been unable to stabilize above 3350, I believe that gold has not fallen to the right level and there is still room for retracement below. So I think gold will continue to pull back to test the 3335-3325 area. If gold retests this area and does not fall below, we can boldly go long on gold in this area.
Once gold rebounds after testing the 3335-3325 area, as liquidity increases, the market may form a strong bullish force to support gold to continue its rebound and continue to the 3380-3390 area, or even the 3400-3410 area.
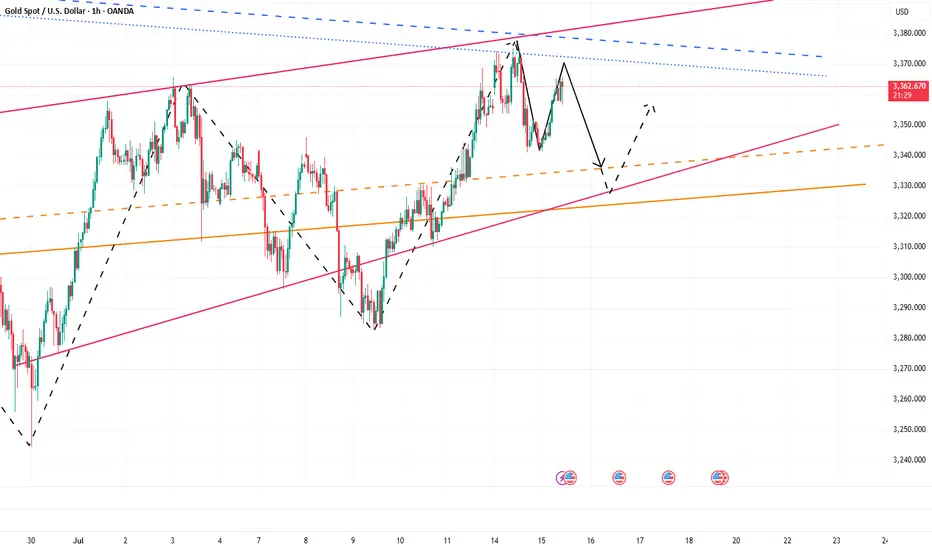
Gold still has room to pull back, be brave and short gold!Gold continued to rebound today, and we also successfully gained 150pips profit in long gold trading. However, although gold is currently maintaining its upward trend, the rebound strength of gold is not strong during the European session, and it has repeatedly touched 3375 and then fell back, proving that there is still some resistance above. In my previous trading point of view, I also emphasized that gold is under pressure near 3380 in the short term. In addition, from a technical perspective, today's intraday high is limited to 3395.
So in order to dump the bullish momentum so that it can break through 3380 more smoothly, or even continue to above 3340, gold will inevitably have a retracement in the short term. So when most people in the market are still waiting for a retracement to go long on gold, I will definitely not waste the opportunity of gold retracement in vain.
So for short-term trading, I will consider shorting gold appropriately in the 3375-3395 area, with the target looking at 3360-3350. After gold falls back as expected, we might as well consider going long on gold at a low level.
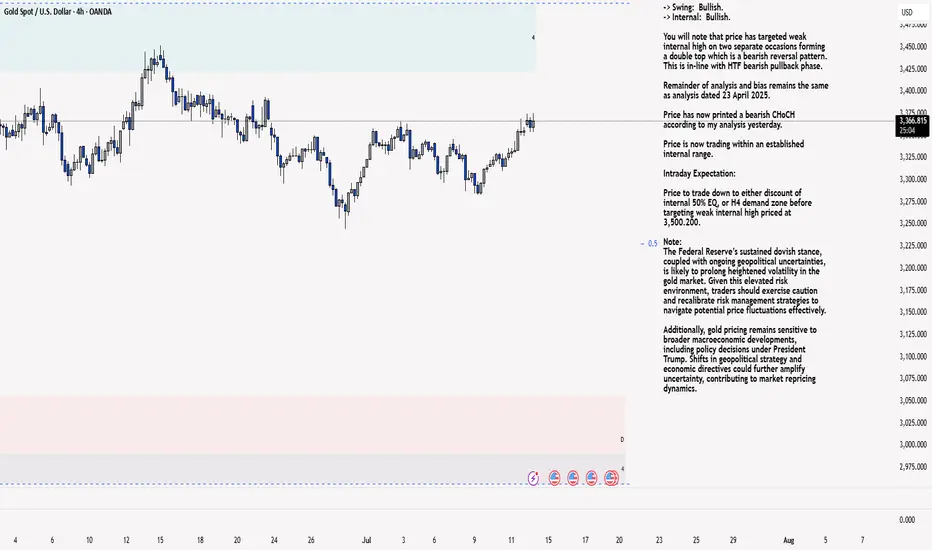
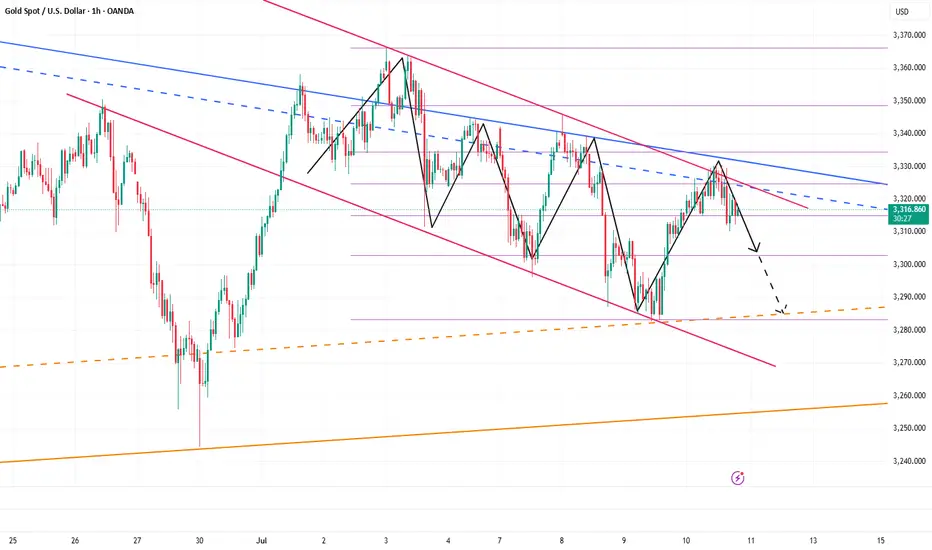
XAU/USD 14 July 2025 Intraday AnalysisH4 Analysis:
-> Swing: Bullish.
-> Internal: Bullish.
You will note that price has targeted weak internal high on two separate occasions forming a double top which is a bearish reversal pattern. This is in-line with HTF bearish pullback phase.
Remainder of analysis and bias remains the same as analysis dated 23 April 2025.
Price has now printed a bearish CHoCH according to my analysis yesterday.
Price is now trading within an established internal range.
Intraday Expectation:
Price to trade down to either discount of internal 50% EQ, or H4 demand zone before targeting weak internal high priced at 3,500.200.
Note:
The Federal Reserve’s sustained dovish stance, coupled with ongoing geopolitical uncertainties, is likely to prolong heightened volatility in the gold market. Given this elevated risk environment, traders should exercise caution and recalibrate risk management strategies to navigate potential price fluctuations effectively.
Additionally, gold pricing remains sensitive to broader macroeconomic developments, including policy decisions under President Trump. Shifts in geopolitical strategy and economic directives could further amplify uncertainty, contributing to market repricing dynamics.
H4 Chart:
M15 Analysis:
-> Swing: Bullish.
-> Internal: Bullish.
H4 Timeframe - Price has failed to target weak internal high, therefore, it would not be unrealistic if price printed a bearish iBOS.
The remainder of my analysis shall remain the same as analysis dated 13 June 2025, apart from target price.
As per my analysis dated 22 May 2025 whereby I mentioned price can be seen to be reacting at discount of 50% EQ on H4 timeframe, therefore, it is a viable alternative that price could potentially print a bullish iBOS on M15 timeframe despite internal structure being bearish.
Price has printed a bullish iBOS followed by a bearish CHoCH, which indicates, but does not confirm, bearish pullback phase initiation. I will however continue to monitor, with respect to depth of pullback.
Intraday Expectation:
Price to continue bearish, react at either M15 supply zone, or discount of 50% internal EQ before targeting weak internal high priced at 3,451.375.
Note:
Gold remains highly volatile amid the Federal Reserve's continued dovish stance, persistent and escalating geopolitical uncertainties. Traders should implement robust risk management strategies and remain vigilant, as price swings may become more pronounced in this elevated volatility environment.
Additionally, President Trump’s recent tariff announcements are expected to further amplify market turbulence, potentially triggering sharp price fluctuations and whipsaws.
M15 Chart:
The bulls have started, aiming at 3400!Gold rose as soon as the market opened, and the highest has now reached above 3374. The upward momentum of gold is strong. It can be seen that after breaking through the recent high of 3365, its morphological structure has obviously tended to a bullish structure, and the technical form shows a "W" double bottom structure and an inverted head and shoulder resonance. The resonance of this technical structure will continue to support the continued rise of gold.
At present, gold is under pressure near the 3380 area in the short term, followed by the area near 3405. At present, gold has a technical retracement near 3380, but it is difficult to destroy the already formed rising structure based on the current retracement strength. Once gold rises again, 3380 will definitely be conquered! It will even continue to the 3400-3410 area; and the area with obvious short-term support is concentrated in the 3350-3340-3330 area, so gold may still rebound again with the support of this area after the decline, and continue to rise.
So for short-term trading, I would consider buying gold in batches based on the support of the 3350-3330 area, with the first target looking at 3380, followed by the 3400-3410 area.
Gold’s Uptrend Is a Mirage,Bears Are Lurking Beneath!Gold has rebounded to around 3336, and seems to have tried to stand above 3335, but it has not stood firm. Therefore, it cannot be considered that the bulls have an advantage just because gold has tried to break through 3335. Recently, I have been reminding everyone that before gold stands above 3335, the bears still have the spare power to dominate the market, so I fully believe that the gold bulls and bears will fight fiercely for control around 3335!
Why do I think it is difficult for gold bulls to have a good performance in the short term? Because since gold fell and touched 3285, it has fallen below many key supports. The market is short-selling. The previous support has become a key resistance under the effect of technical top and bottom conversion, and multiple resistances are concentrated in the 3335-3345-3355 area. Under the suppression of multiple resistances, it is difficult for gold bulls to make any progress in the short term.
So before the resistance is effectively broken, I think any rebound may be an opportunity to short gold, so I will try to find the band top and short gold based on the resistance area, and now I think it is still worth a try to short gold in the 3330-3340 area as originally planned! And look at the target area of 3320-3310
Golden Trap: Bulls Exhausted, Bears Ready to StrikeToday, the gold market is in a stalemate between long and short positions, with the market fluctuating sideways for a long time and maintaining an overall volatile trend. Although the rebound of gold has won a respite for the bulls, the rebound of gold during the day is not enough to completely reverse the decline. I think that before the 3325-3335 area is stabilized, the bears still have spare power to dominate the market!
According to the current structure, although gold rebounded again after touching 3310 during the retracement, it has retreated many times during the rebound. The candle chart is interspersed with obvious negative candle charts, indicating that the rebound strength is weak. In the short term, it is under pressure in the 3330-3340 area, and it is difficult to break through in a short time.
So I think the role of the gold rebound may be to trap more buyers, so we try not to chase gold after the rebound. The area near 3310 is not a key support in the short term. 3305-3300 is the current key support area. Once the bears regain control of the situation, gold may test the 3305-3300 area again. Once it falls below the reformed area, it may test 3280 again, or even refresh the recent low to around 3270.
So the downward potential of gold is not over yet. We can still look for opportunities to short gold in the 3325-3335 area and look at the target 3305-3295 area.
Short gold ,the downside potential is far from over.After we waited patiently for a long time, the gold bears finally showed signs of strength and began to fall as expected. Why do I insist on being optimistic about the gold retracement and wait patiently for it to retrace? !
In fact, it is very simple. Gold started to rebound from around 3283 and touched around 3330, which only recovered 50% of the decline. When facing the 50% retracement level, the bulls were unable to do so and could not stand above 3335, and could not even stabilize above 3330. The bulls' willingness was obviously insufficient. Then it can be determined that the gold rebound is only a technical repair of the sharp drop, and it cannot be completely regarded as a reversal of the trend. Then after a certain degree of repair, the gold bears will counterattack again.
Moreover, from the perspective of market psychology, the recent gold bull and bear markets have been discontinuous, and Trump often stirs up the gold market, making it difficult for the market to stand unilaterally on the bull side. Therefore, before gold stabilizes in the 3330-3340 area, there is limited room for rebound in the short term. Once gold falls below the 3310-3305 area again during the retracement, gold may test the area around 3280 again, or even around 3270.
So the above is why I insist on shorting gold, and I have shorted gold at 3320-3330 as planned, and patiently hold the position to see its performance in the 3310-3305 area, which is also the target area of our short-term short position.

Don’t be too optimistic, gold may change its face at any time!Gold continued to rebound to around 3320, and it seems to have completely stood above 3300. The bulls are recovering. Should we chase gold in a big way? In fact, due to the disruption of news such as the Federal Reserve's interest rate decision and tariffs, the gold market has clearly shown the characteristics of frequent switching between long and short positions and discontinuity between long and short positions. Therefore, even if gold rebounds to a certain extent, it is difficult for the market to stand unilaterally on the bull side.
In the short term, gold began to retreat from around 3366, reaching a minimum of around 3283, with a retracement of $83; and currently it has only rebounded from the low of 3283 to around 3320, and the rebound is even less than 50%. Gold bulls are not as strong as imagined; although gold continues to rebound, before regaining the 3325-3335 area, it can only be regarded as a technical repair of the sharp drop, and cannot be completely regarded as a reversal of the trend. So after the rebound of gold, gold bears may counterattack strongly at any time.
Therefore, in short-term trading, after gold rebounds, you can consider shorting gold with the 3325-3335 area as resistance, and the first entry area worth paying attention to is 3320-3330.

The intraday low has already appeared, so go long on gold boldlyGold unexpectedly fell sharply to around 3287. To be honest, the short position is relatively strong. However, since gold fell below 3000, we can clearly see that gold has shown strong resistance to falling during the decline, and the volatility tends to converge around 3287, proving that the buying support below is strong; and as gold continues to retreat, the off-market wait-and-see funds will be more willing to go long on gold; and some short positions will be more willing to go long on gold after profit taking;
In addition, although the short position is strong, it is difficult to continue in the short term. The intraday decline is basically in place. It is estimated that 3287 is the intraday low, so at this stage, it is inconvenient for us to continue to chase short gold. On the contrary, we can boldly go long on gold in the 3305-3295 area and look at the target area: 3320-3330.
