Impact of the Non-Farm Payrolls? Latest Analysis.Information Summary:
Most traders are turning their attention to the crucial US labor market report, which is being closely watched as the market actively searches for new clues regarding the timing of the next interest rate cut this year.
The July non-farm payrolls report will be released at 8:30 AM US time. US non-farm payrolls increased by 110,000 in July, seasonally adjusted, lower than the 147,000 increase in June. The US unemployment rate is expected to rise from 4.1% to 4.2% in July.
If the non-farm payrolls figure falls below 100,000 and the unemployment rate rises, it could signal a weakening job market, undermining the Fed's rekindled hawkish outlook and dampening the dollar's upward momentum. In this scenario, gold prices could re-cross the 3,400 mark. However, if the non-farm payrolls unexpectedly exceed 150,000, it could support the dollar's continued rise and hurt gold. Strong US employment data could rule out two rate cuts from the Fed this year.
Market Analysis:
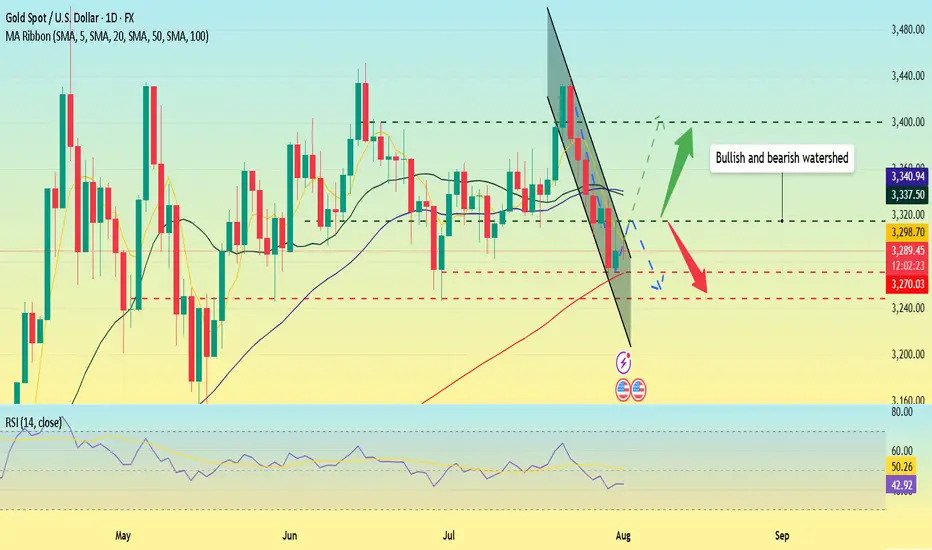
Quaid believes that the current moving average crossover is trending downward, and downward momentum is still in play. The RSI remains at 42.7, hovering below the midline, indicating that gold's downward trend remains intact. The 20-day moving average fell below the 50-day moving average on Wednesday, confirming the bearish momentum.
Therefore, if gold closes below the key support level of the 100-day moving average at $3,270 on a weekly basis, a new downtrend could begin, potentially leading to a drop towards the June 30 low of $3,248.
Quaid believes that the current bull-bear watershed needs to focus on around 3315, which is the previous intensive trading area and is also the first resistance position for short-term upward movement.
On the last trading day of Super Data Week, Quaid hopes that everyone has gained something and has a happy weekend; I wish you all good luck.
Xauusdtrade
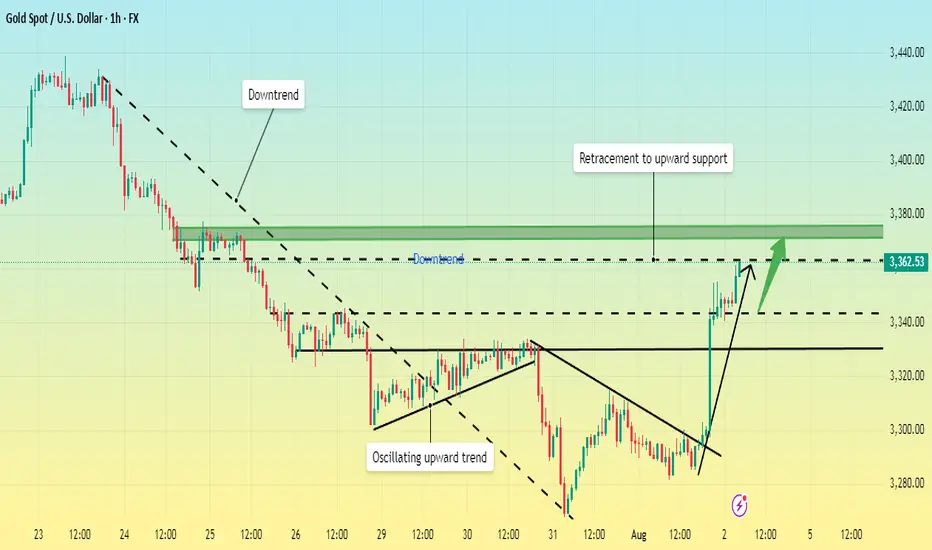
Has a bull market started? In-depth analysis.Friday's non-farm payroll report was unexpectedly disappointing, sending gold soaring.
Data released by the U.S. Department of Labor on Friday showed that non-farm payrolls added only 73,000 jobs in July, far below market expectations of 100,000. The weak employment report quickly shifted market sentiment regarding the Federal Reserve's policy path. Market expectations for a September rate cut have soared to 75%, with another cut expected before the end of the year.
This shift has provided strong support for gold prices. Amidst persistent inflationary pressures and disappointing employment data, a Fed rate cut would be a substantial boon for gold.
Friday's data triggered a sharp rise in gold prices on the daily chart, reversing a week-long decline. This is the first sign of a pattern that breaks a weak downward trend. Following consecutive declines, the daily chart began to rise, directly reversing a week's losses. This pattern is likely to continue next week, forming a bullish pattern, with a potential second leg higher. Therefore, next week will be crucial for bullish sentiment, with key focus on whether it can break through the highs and the continuity of the bullish trend.
The bullish trend is likely to continue next week. It's also important to note that Friday's pullback to around 3340 marked an inflection point, a watershed between bulls and bears and a secondary bullish level. Since Friday's close was near resistance, it's important to watch whether the market will surge directly next week or retreat before rising again. If the rally isn't sustained in the early Asian session, a correction is likely to occur, accumulating upward momentum.
Non-farm payrolls are coming. Will it trigger the market?On Thursday, the US dollar index briefly rallied after the Federal Reserve's favorite inflation indicator unexpectedly rebounded, crossing the 100 mark for the first time in two months. This marked the sixth consecutive trading day of gains and the first monthly gain since 2025.
Spot gold rebounded as risk aversion lingered amid uncertainty surrounding Trump's tariff deadline, reaching a high of around $3,315, but its intraday gains narrowed after the release of the PCE data.
The dollar has already firmly established itself above the 100 mark on the daily chart, so the next target is likely to be between 101.5 and 102.0. Currently, support levels on the daily chart are visible at 99.5 and 99.0.
The gold market is currently consolidating in the 3315-3275 range. However, if the dollar rises again, Quaid believes gold prices could fall below 3275.
On the daily chart, if it falls below 3275, the price would likely be around 3250. If 3250 falls below, the market could test 3200. However, the possibility of a consolidation between 3315 and 3275 remains undisputed.
Before the release of the non-farm payroll data, scalping within this consolidation range is advisable. However, the risk is relatively high, so please take profits in time.

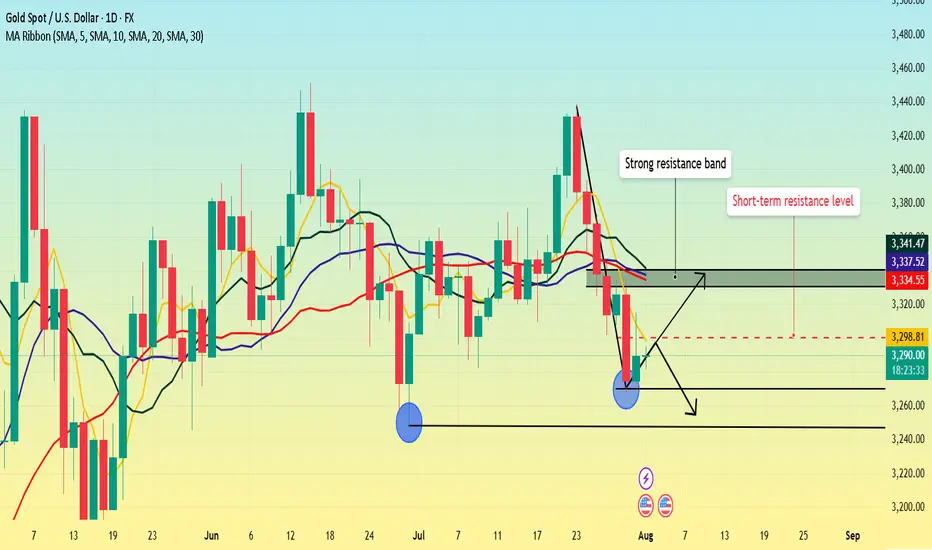
Non-farm payrolls are coming. What's the gold trend?Gold fell sharply on Wednesday, but Thursday's market didn't continue the downward trend as some investors expected. Instead, it showed a trend of rising and then falling.
From the daily perspective, we first need to focus on the resistance level near 3300 where the 5-day moving average is located. This position is not only a short-term technical resistance, but also reflects the market's psychological expectations to a certain extent. If prices can successfully break through this level and stabilize above it, it will indicate that bullish momentum is strengthening, potentially boosting market sentiment. At this point, the next resistance area to watch is the 3330-3340 range. This area converges the 10-day, 20-day and 30-day moving averages, forming a strong resistance band.
As for the support below, the primary focus is Wednesday's low of 3268. However, if this level is lost and the price continues to fall, the next support area will be around 3245, which is the previous low.
Trading strategy:
Short around 3300, stop loss at 3310, profit range 3280-3260.
Gold fluctuates. Is the decline halted?Information Summary:
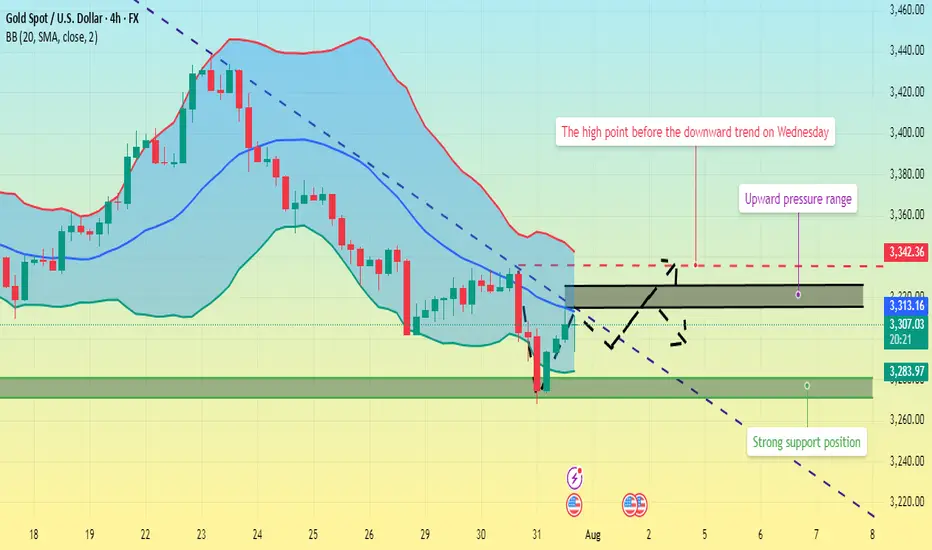
Despite diminished market expectations for a September US rate cut, gold rebounded from a one-month low hit the previous session on Thursday, boosting its safe-haven appeal as newly announced US tariffs sparked new trade uncertainty.
So far, gold has risen 1.15%, hovering around $3,310, a gain of nearly $40 today. On Wednesday, gold prices hit their lowest point since June 30th: $3,267.79.
Market Analysis:
On the 4-hour chart, prices remain below the middle Bollinger Band, with a descending trendline defining the current bearish momentum. Prices rebounded after hitting this month's low on Wednesday. In the short term, watch for price rejection signals near the trendline. Upward pressure currently lies between $3,315 and $3,325, while support lies between $3,280 and $3,270.
Currently, prices are fluctuating upward. Quaid believes the bullish trend may continue. If the current resistance level is broken, it could reach the 3335 high before Wednesday's decline.
Trading strategy:
Go long near 3300, stop loss at 3290, profit range 3320-3330.
XAUUSD 1H AnalysisGold experienced a strong selloff, breaking multiple key S&R levels and forming a clear bearish structure. Currently, price is reacting from the PD Low + 1H demand zone (~3265) and pulling back.
🔍 Key Zones:
PD High – 3335: Major resistance / Supply
Supply Zone – 3295–3305: Key area to watch for bearish reaction
Current Resistance – 3285: Price testing this minor S&R level now
PD Low – 3265: Strong bullish reaction zone
📌 Potential Setups:
Sell Setup: If price enters 3295–3305 (Supply Zone) and forms rejection on 15M/1H → short toward 3265.
Buy Setup: If price breaks and holds above 3305, look for retest and continuation toward 3335.
Scalp Long: Small pullback toward 3275–3270 could offer intraday long up to 3295–3300.
📈 Bias: Still bearish unless price reclaims and sustains above 3305.
Patience is key — let price come to zone and wait for confirmation.

GOLD Bearish Breakout!
HI,Traders !
#GOLD is trading in a strong
Downtrend and the pair
Broke the key horizontal
Level around 3318.97 which
Reinforces our bearish
Bias and we will be
Expecting a further
Bearish move down !
Comment and subscribe to help us grow !

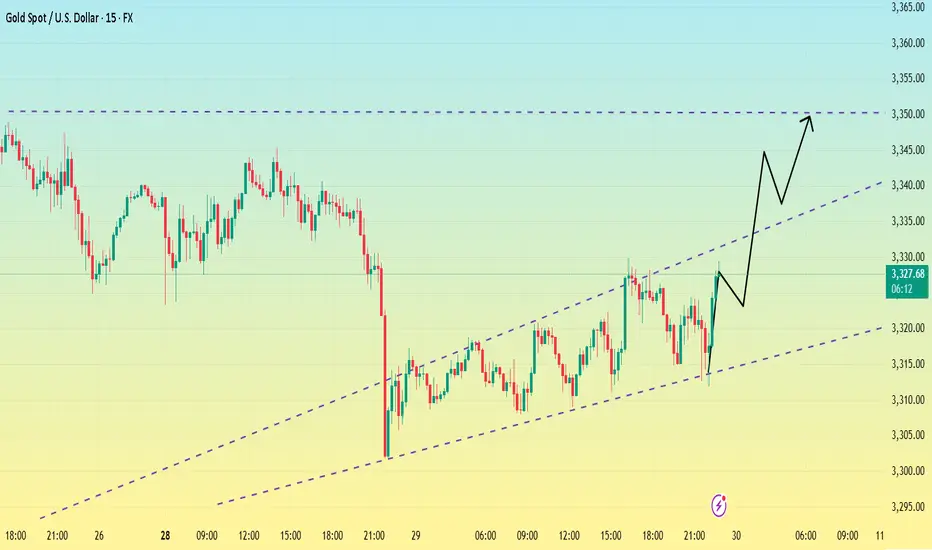
Bottoming out? Be wary of the market.After a sharp drop to around 3300 on Monday, gold rebounded, reaching a high of around 3330 so far.
From the 1-hour chart,Gold has now broken out and stabilized within the hourly chart's downward trend channel. The key upward level is currently around 3330. If it breaks above 3330 again, caution is advised; it may test 3345-3350. Conversely, if it fails to break above 3330, gold may consolidate between 3300-3330 before the non-farm payrolls release.
From a short-term 15-minute perspective, the current 15-minute range has been broken out and stabilized. The current situation is unfavorable for bears. Based on the trend, a breakout above the 15-minute range would indicate a rebound. However, until 3330 holds, the 3320-3330 range is the only option. However, the current trend favors a bullish pullback, so I'm not too keen on shorting. Therefore, focus on support at 3320.
If it fails to break below 3320, enter a long position near 3320. The upper target is the top of the 3345-3350 range.
GOLD H2 Intraday Chart Update For 29 July 2025Hello Traders, Welcome to new day
we have US JOLTS high impact news today, for market sustains above 3300 psychological level
if market successfully break 3280 level then it will move towards 3280 or even 3270
if market crosses 3330 level successfully then it will move towards 3345 or even 3360
All eyes on FOMC & NFP news for the week
Disclaimer: Forex is Risky
Gold repeatedly tested lows. Will it break through?On Monday, the Asian market opened low and rose in the early trading. In the European trading, it rose to around 3345. The European trading was under pressure and fluctuated. The US trading began to accelerate its decline, and the lowest point reached around 3302. Then it continued to fluctuate in the range of 3300-3320.
On July 27, the United States and the European Union reached a framework trade agreement; the agreement reduced market concerns about the global economic recession, promoted the attractiveness of risky assets, and boosted the stock market and the US dollar. Although Trump has repeatedly pressured for a substantial interest rate cut, the market has strong expectations for a September interest rate cut. The current expectation of maintaining a stable interest rate dominates the market, coupled with the strength of the US dollar, which puts gold prices under downward pressure in the short term.
Gold opened low in the early trading on Monday and then rebounded to recover the losses, but then fell below the low again, and the daily line closed in the negative, and now it has formed a four-day negative decline. MA5 and 10-day moving averages form a dead cross, and there is a downward turn.
The focus on the upper side is around Monday's high of 3345, which is also near the current position of MA5, 20, and 30-day moving averages. Below this position, gold is weak; if it breaks upward, it is necessary to prevent the possibility of a rebound correction.
The lower support first focuses on the 3300 integer mark; secondly, focus on the area around 3285-3275.
Operation strategy:
Short near 3340, stop loss 3350, profit range 3320-3300;
Long near 3300, stop loss 3290, profit range 3320-3340.
Before the release of US data on Tuesday, you can maintain this operation strategy; after the data is released, adjust the strategy based on the impact of the data.
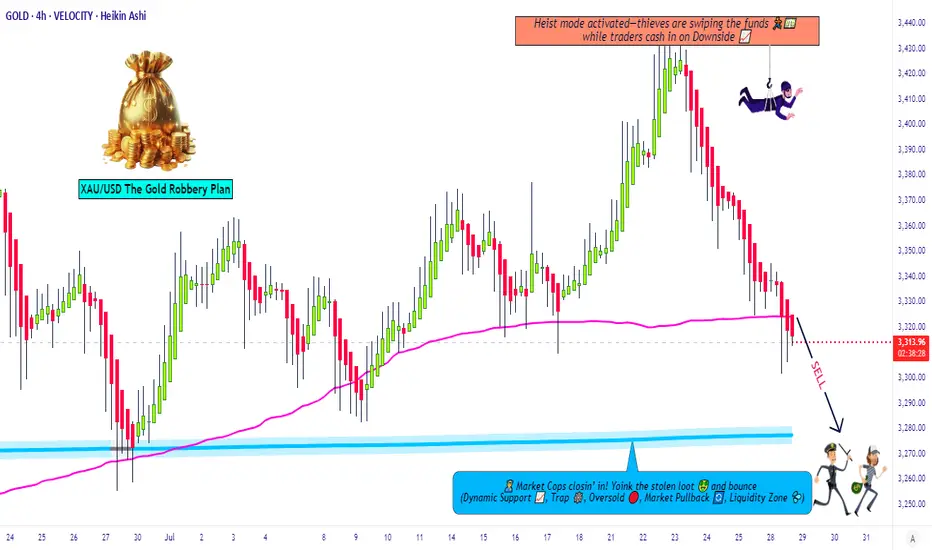
Gold Robbery Blueprint: Smart Bears on the Move Now!💣 XAU/USD GOLD HEIST PLAN: Robbery Begins at Resistance Zone! 🔐💰
🌟Hi! Hola! Ola! Bonjour! Hallo! Marhaba!🌟
Dear Money Makers & Market Robbers, 🕵️♂️💸🚀
Welcome to another strategic strike by Thief Trading Style™—where smart analysis meets bold execution. We're targeting XAU/USD (Gold) in this scalping/day-trade opportunity, primed with fundamentals, technicals, and pure robbery logic.
🔍 THE GAME PLAN
We're looking at a neutral zone turning bearish, and here’s how the robbery unfolds:
🔑 ENTRY POINTS
🎯 “Vault wide open” signal!
Initiate short orders at current price zones or set layered SELL LIMITS near swing highs on 15M/30M charts. We're running a DCA-style pullback entry for max loot.
🕵️♀️ Entry isn't about one shot—it's about precision raids.
🛑 STOP LOSS: THE ALARM SYSTEM
Set SL just above the nearest swing high (4H timeframe preferred).
Use candle wick tips as your defense line (Example: 3350.00).
Adjust SL based on risk appetite and number of orders stacked.
🎯 TARGET: THE GETAWAY PLAN
💸 First Vault: 3280.00
💨 Or escape earlier if price action signals reversal. Protect your gains. Professional thieves don't get greedy.
📊 WHY WE’RE ROBBING HERE
This level is a high-risk barricade zone—police aka "market makers" are strong here.
We spotted consolidation, oversold signals, trend reversal setups, and a bullish trap disguised as support. A perfect time to strike. 🧠🔍
📰 FUNDAMENTAL & SENTIMENTAL CHECKPOINTS
🔎 Stay updated with:
Global news drivers
Macro & Intermarket analysis
COT reports & future trend targets
👉 Check the 🔗🔗🔗
⚠️ TRADING ALERT - STAY SAFE DURING NEWS BOMBS!
Avoid entries during major economic data releases.
Use trailing SL to protect running profits.
Monitor volatility spikes & price anomalies.
💖 JOIN THE CREW, BOOST THE HEIST!
If this plan adds value to your trades, hit that Boost Button 💥
Support the Robberhood and help grow the gang of smart money snipers 🕶️💼💣
Every boost = more ammo for next mission. Let's rob the market—not each other. 🚀🤑
📌 Remember: Market is fluid. Stay sharp, adapt quick, and trade like a shadow.
Catch you soon in the next grand heist 🎭💼
#XAUUSD #GoldTrade #ScalpingStrategy #DayTrading #ThiefTrader #RobTheMarket #BoostForMore #NoChaseNoCase
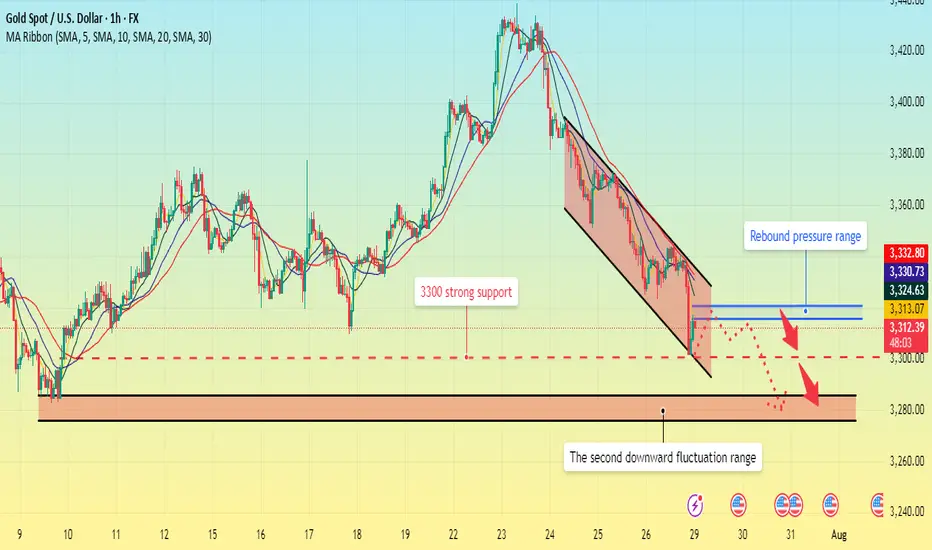
Gold fell below support. What will be the subsequent trend?The 1-hour moving average of gold continues to show a downward short position, indicating that the downward momentum is still sufficient; the wave pattern of gold's current decline remains intact, but the rebound strength is very weak, showing an obvious short trend of gold. Moreover, when gold rebounded in the short term, obvious resistance began to form above 3320, and the upward momentum was slightly insufficient.
From the daily chart, before 3300 fails to fall, it is likely to fluctuate around 3300-3350. On the contrary, if it falls below 3300, it is likely to reach the bottom of the 3385-3375 range.
This week is a super data week. The data of each day may affect the trend of gold on that day, but it will not form a unilateral strong trend. Therefore, the volatility before and after the data is released is likely to be large, so traders should focus on the following data:
1. US ADP employment report, US second quarter GDP preliminary value;
2. Federal Reserve interest rate decision;
3. US PCE annual rate, monthly rate;
4. The last trading day of this week will usher in non-agricultural data.
The US and Europe reached an agreement. Gold rebounded.At the current node, the EU and the US reached a tariff cooperation, 15% tariff + 600 billion US dollars for investment in the United States. The additional tariffs are considered a big deal, and the US has become the winner again this time.
Of course, this is a small negative for the current gold market.
From a multi-period analysis, the monthly chart price is still in a reverse K state. For the current situation, we need to pay attention to the gains and losses of the monthly highs and lows. The weekly chart shows that the price has continued to fluctuate at a high level recently. As time goes by, the weekly watershed is temporarily at 3320. After last week's high and fall, there is currently a further downward performance.
The four-hour chart shows that the price has continued to be suppressed after breaking through the four-hour support last Wednesday. The four-hour level resistance is currently around 3355, and the resistance level has moved up compared with the early Asian market. Therefore, we will pay attention to the pressure at this position in the future. If it fails to break through for a long time, it is likely to fall directly under pressure; pay attention to the support range of 3320-3310 below.
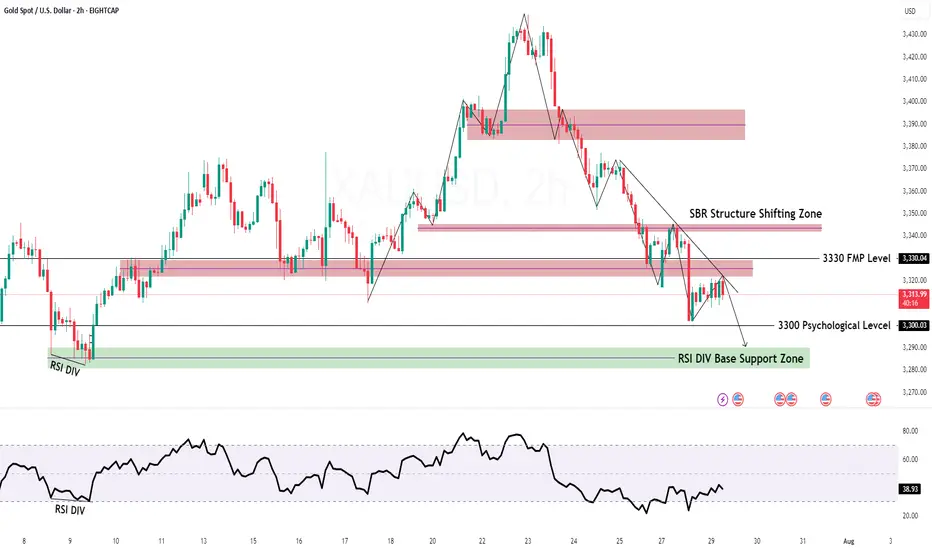
Gold remains unchanged. Still weak.Last Friday, gold rebounded around 3373, but the bullish momentum was insufficient, and then it bottomed out and fell sharply. The price fell below the short-term rising trend line support. At present, the MA5-10 daily moving average is in a high dead cross short arrangement. On this basis, Quaid believes that gold can still be bearish now. At present, the Asian market continues to fluctuate downward in the early trading. Today, we will focus on the support of 3310-3300.
The short-term price is currently maintained at around 3335, which can be regarded as the watershed between long and short today. If the European session stabilizes above the MA50 moving average, the trend will change to a certain extent. Now we still look at the bottom near 3300.
Operation strategy:
Short near 3340, stop loss 3350, profit range 3310-3300.

Gold is weak. It may break through next week.This week, gold rose and fell, rising for two consecutive days on Monday and Tuesday, and falling for three consecutive days from Wednesday to Friday. The weekly line finally closed with a small real body negative line with a long upper shadow.
Gold's trend this week was due to the strengthening of the US dollar and the progress in US-EU trade negotiations, which hit the safe-haven demand, leading to a decline in gold prices.
Next week, focus on multiple time points that may trigger market trends, including the Federal Reserve's decision, non-agricultural data, the August 1 tariff deadline, and the economic and trade talks between Chinese representatives in Sweden and the United States. These events may set the tone for the market in the second half of the year and need to be paid attention to.
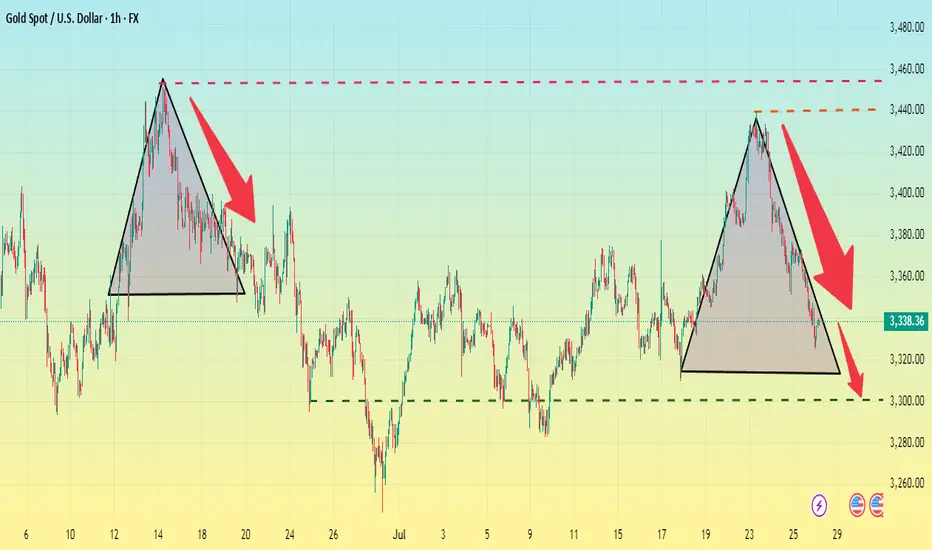
At the beginning of this week, we focused on the triangular convergence pattern formed by the high and low points since 3500 points. On Tuesday, gold broke through the pattern upward, but failed to stand firm on Wednesday. Instead, it fell to form a false breakthrough, and on Friday it fell to the lower edge of the triangular convergence range. However, from the perspective of the international futures market, the overall situation is still in the triangular convergence pattern and has not achieved an effective upward breakthrough. Based on this, we need to continue to keep a close eye on the changes in the triangle convergence pattern next week. The direction of its next breakthrough will have an important impact on the short-term trend.
Operation strategy:
Short near 3350, stop loss 3360, profit range 3320-3315. If the price continues to fall, you can hold a small position, and the area near 3300 is likely to be touched.
"GOLD Bandit Strategy: Loot Pips Like a Pro!🏆 GOLD HEIST ALERT! 🏆 XAU/USD Bandit Strategy (Swing/Day Trade)
Steal Pips Like a Pro! 💰🔓 Bull vs. Bear Raid Plan
🌟 Greetings, Market Pirates! 🌟
"The trend is your accomplice—time to loot!"
🔮 Thief’s Technical & Fundamental Intel:
XAU/USD (The Gold Vault) is flashing BEARISH signals, but we’re ready to raid both sides! Follow the heist blueprint below 👇
🎯 ENRY POINTS (Where to Strike!)
🏴☠️ LONG RAID (Bullish Thieves):
Break & Grab: Enter above 3450.00 (Pullback Zone)
"Wait for the breakout, then ambush!"
🐻 SHORT RAID (Bearish Bandits):
Sneak Attack 1: Sell below 3300.00
Sneak Attack 2: Sell below 3260.00 (Support Wall Cracked!)
🛑 STOP-LOSS (Escape Routes)
Bullish Trade: SL at 3230.00 (Guard your loot!)
Bearish Trade 1: SL at 3360.00 (Don’t get caught!)
Bearish Trade 2: SL at 3280.00 (Risk = Reward!)
(Adjust SL based on your risk appetite & lot size!)
💰 TAKE-PROFIT (Cash Out & Flee!)
Bullish Thieves: TP at 3270.00 (Or escape early!)
Bearish Bandits (1): TP at 3270.00
Bearish Bandits (2): TP at 3210.00 (Big score!)
⚠️ WARNING: Market Traps Ahead!
News = Danger Zone! 📢 Avoid new trades during high-impact news.
Trailing SL = Your Getaway Car! Lock profits & evade reversals.
📰 FUNDAMENTAL BACKUP (Why This Heist Works)
Bearish momentum fueled by macro trends, COT data, & sentiment.
Stay sharp—markets shift fast!
💥 BOOST THIS HEIST! 💥
Like & Share to strengthen our pirate crew! 🚀 More alerts = More profits!
🚨 Next Heist Coming Soon… Stay Tuned! 🚨

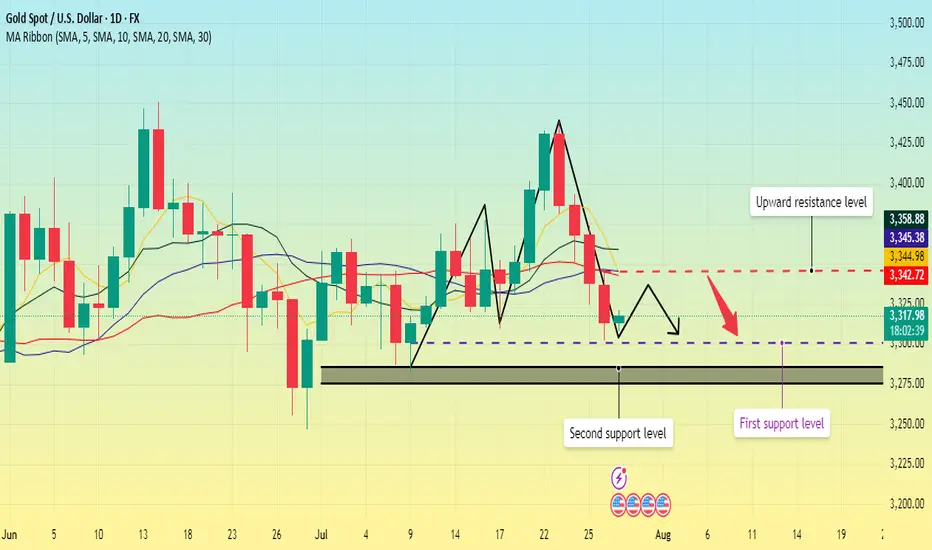
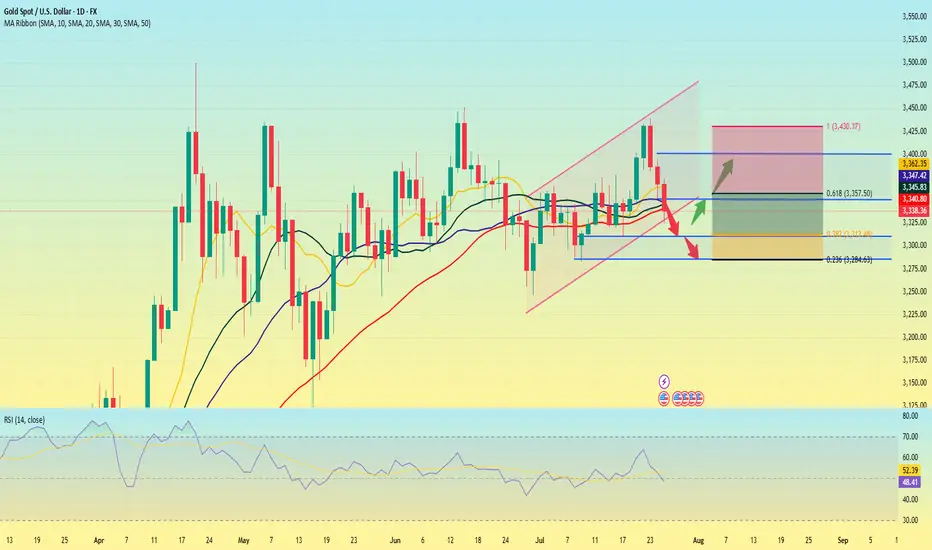
Gold is weak. Will it explode next week?Gold prices failed to stabilize above $3,400 after a bullish breakout this week. The technical outlook highlights the recent indecision of gold bulls.
In the first two trading days of this week, spot gold prices rose by 2.4%, but the cumulative decline in the last three trading days of this week reached nearly 3%. The sharp fluctuations this week were due to the positive progress in Trump's trade negotiations, and the rebound in market risk appetite, which hit the safe-haven demand for gold.
Looking at next week, the economic calendar will provide several high-impact data releases. The Federal Reserve will announce its monetary policy decision after the policy meeting on July 29-30; the US Bureau of Labor Statistics will release the July employment report; and some important news such as the US-China trade negotiations may trigger the next major move for gold.
From a technical perspective, the current market short-term technical outlook highlights the hesitation of gold buyers. The daily chart shows that the RSI is still slightly below 50, and gold prices have difficulty staying away from the 20-day and 50-day MAs after breaking through these two levels earlier this week.
On the upside, 3450 constitutes the first resistance for gold prices. If it breaks through this resistance, gold prices will most likely hit the 3400 integer mark again.
On the downside, if gold prices remain below 3340, technical sellers may still be interested. In this case, 3310 can serve as the first support level, followed by the second support level near 3285.
A new week is about to begin, and I wish all traders good luck.
Gold is going down. It may continue next week.On the last trading day of this week, the bears attacked strongly and continued to refresh the recent lows, reaching the lowest point near 3325 before stopping.
From Monday's 3345 to 3440, it closed near 3337. This week, it also walked out of the large range roller coaster pattern, and all the strengths in the previous period did not exist. Under the continuous downward trend, the bulls were also vulnerable, and there was not even a strong rebound, which indirectly explained the strength of the bears in the short term.
As for the current trend, the bears are likely to continue to be strong, and before there is a symbolic upward breakthrough, we still need to maintain the idea of shorts to operate. The current upper pressure is maintained near 3350, which is also the bottom position touched for the first time in the previous period. It is possible that it will be transformed into a top-bottom conversion pattern; and the strong support level below is near 3310.
When the Asian market opens next Monday, we need to pay close attention to whether there is a gap problem on both the bulls and bears. After three consecutive negative daily lines, all the moving average systems have been broken, and it is also likely to form a resonance pressure pattern. On Monday, gold will first touch around 3350 and continue to short. The profit range will be around 3330-3320, and the stop loss will be 3360. If the European session is stronger, you can adjust the point before the US session.
Gold is weak. Beware of lows.On Thursday, the dollar index ended a four-day losing streak thanks to the progress of the fund between the United States and its trading partners.
As signs of easing global trade tensions curbed demand for safe-haven assets, gold fell for the second consecutive trading day, and yesterday it hit the 3350 bottom support level.
From the 4-hour chart
although it rebounded to the 3370-3380 range after hitting 3350. But it can be found that the current rebound is actually weak, and it is still maintained at 3360-70 for rectification. At present, the bottom of the 4-hour bottom is absolutely supported at 3340-3335. The rebound high is around 3375. As of now, gold has not rebounded above 3375, and gold is actually in a weak position.
Secondly, from the hourly chart, the weakness is even more obvious. The high point on Thursday was around 3395. Today's current high point is around 3375. It can be seen that if the bottom falls below the 618 position 3350 again, it will directly touch around 3335. It coincides with the target position of 3340-3335 in the previous 4-hour chart.
Therefore, it is not possible to buy the bottom and go long today. Be alert to the possibility of further touching 3340-3335.
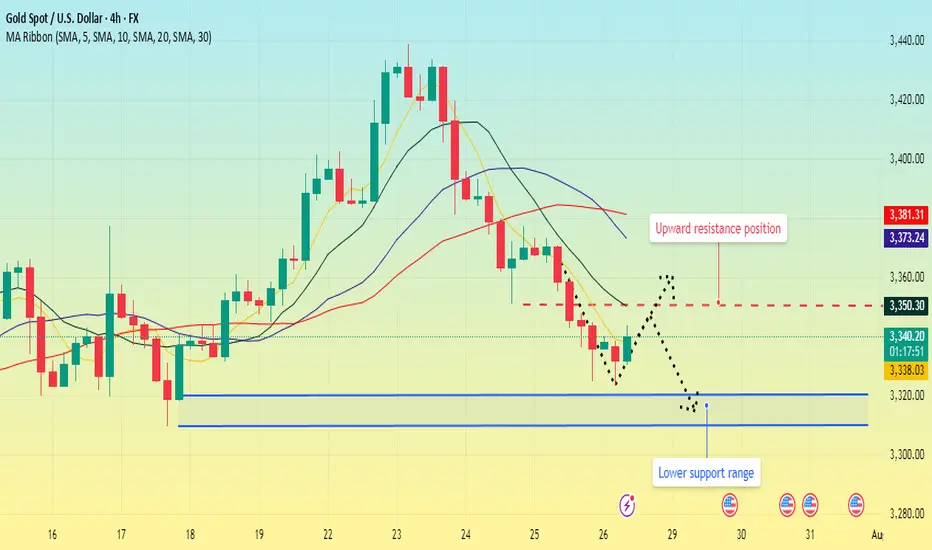
Gold (XAU/USD) 4-Hour Technical Analysis Report - 25 July 2025 📌 Market Context & Sentiment Overview
The gold market is currently trading in a state of technical compression, with the price hovering just beneath the mid-3360s. After a significant rally earlier in the month, the recent sessions have seen price action coiling within a tight ascending triangle—a classic pattern known to precede breakouts.
According to recent publications by FXEmpire, FXStreet, and Investing.com, sentiment remains moderately bullish. Analysts point to strong institutional demand near the 3320–3330 zone, while also warning of resistance pressures near the 3380–3390 zone. These insights align with our technical findings, which suggest a developing structure with increasing breakout potential.
📊 Technical Structure Analysis (4-Hour Timeframe)
🔹 Price Action & Structural Patterns
The prevailing structure is a rising triangle anchored between support at 3320 and resistance near 3380–3390. Price has been forming higher lows, indicative of underlying buying pressure, while simultaneously facing resistance at increasingly frequent tests of the upper band. The contraction of candlestick bodies and volume confirms the presence of a coiling market—hinting at an imminent directional move.
The presence of upper-wick rejections near 3380 signals seller interest, while long-tailed candles at 3330 underscore buyer defense of the rising trendline. This dynamic equilibrium is the hallmark of a triangle formation nearing completion.
🔹 Support & Resistance Levels
Our analysis identifies the following zones as technically significant:
Key Support (Buy Zones):
3320–3330: This zone hosts a major bullish order block, 8/21 EMAs, and the lower trendline of the rising triangle. It is further supported by the 61.8% Fibonacci retracement drawn from the 3300 low to the 3390 swing high.
3300–3310: A psychological level and previous 4-hour swing low. Acts as a secondary defense level.
Key Resistance (Sell Zones):
3380–3390: Triangle resistance, aligned with the 50 EMA and a bearish order block.
3440–3450: An upper extension zone if breakout materializes, noted in external institutional outlooks.
🔹 Volume, VWAP & Institutional Concepts
Volume has notably contracted, a classical feature of triangle formations, with most trading volume aggregating at the mid-point (~3345–3355). VWAP sits just below the current price, reflecting mean reversion tendencies. Furthermore, liquidity pockets are observed just beneath 3320, suggesting potential for liquidity grabs before a bullish reversal.
From a Smart Money lens:
A bullish order block has formed near 3320–3330.
A bearish OB and resistance cap prices around 3380.
A small Fair Value Gap (FVG) lies around 3340–3350, acting as a potential price magnet.
🔹 Indicators & Oscillators
Moving Averages: The 8/21 EMA cluster lies just below current price, offering dynamic support.
MACD: Negative but converging—suggesting bearish momentum may be waning.
ADX: Reading ~40, indicating a trending market, though momentum has slightly slowed.
RSI: Hovering near 35–40, close to oversold; signals potential bounce.
Stochastics & CCI: Both deeply negative—supporting the case for a mean-reverting move.
🎯 Strategic Buying & Selling Zones
✅ High-Probability Buy Zones
3320–3330:
Rationale: Confluence of bullish OB, rising trendline, EMAs, and Fib 61.8%.
Confidence: High (★ ★ ★)
3300–3310 (buffer zone):
Rationale: Psychological and historical swing low support.
Confidence: Moderate
❌ High-Probability Sell Zones
3380–3390:
Rationale: Triangle resistance, prior highs, and bearish OB presence.
Confidence: High
3440–3450:
Rationale: Post-breakout measured move target and potential take-profit zone.
Confidence: Moderate
🏆 The Golden Setup: High-Conviction Trade Idea
Direction: Long
Entry: 3325
Stop Loss: 3300
Take Profit: 3390
Confidence Level: ★ ★ ★ (High)
🔍 Justification
This setup takes advantage of the strongest structural support within the triangle—centered around 3325. This level is reinforced by the 61.8% Fibonacci retracement, bullish order block activity, and EMA compression, all coalescing with the triangle’s rising support line.
Indicators are turning from oversold, and the volume profile suggests that institutional players may look to engineer a liquidity sweep under 3330 before a continuation push to test the 3380 resistance. The reward-to-risk ratio is favorable, and the setup offers clear invalidation with a tight stop at 3300.
Should momentum continue post-breakout, a secondary TP could be explored at 3440. However, for the purpose of tactical execution, 3390 is a strategically sound exit point.
🧠 Sentiment Cross-Check & Market Alignment
External sentiment and professional forecasts support the underlying thesis of a bullish breakout, pending confirmation. TradingView’s top technical authors emphasize the breakout of this ascending triangle toward 3440+, while Investing.com’s shorter-term signals reflect bearish pressure that aligns with our buy-the-dip strategy.
This synthesis of internal and external analysis increases our conviction in a long-biased tactical approach from the current support zone.
✅ Summary Table
Buy Zones Sell Zones Golden Setup
3320–3330 (primary) 3380–3390 (primary) Direction: Long
3300–3310 (buffer) 3440–3450 (extension) Entry: 3325
Stop Loss: 3300
Take Profit: 3390
Confidence Level: ★ ★ ★ (High)
🔚 Final Thoughts
Gold’s current price structure presents a rare opportunity—one defined by tight consolidation, structural clarity, and institutional footprints. As the market coils within a classic triangle, the 3320–3330 zone emerges as a high-probability springboard for long positions. With precise risk management and a disciplined approach, this setup offers traders a compelling entry with defined technical boundaries.
The golden rule now: Respect structure. React to confluence. Trade with conviction.
Gold fluctuated downward. Or it will continue.Gold was blocked near 3393 in the early trading on Thursday and began to fluctuate and fall, falling to 3351 as low as possible, then stopped falling and rose, and after rebounding near 3377, it was blocked and fell back to 3370 and fluctuated up and down, and the daily line closed with a negative line.
After three consecutive positive rises from last Friday to Tuesday this week, gold ushered in a turning point on Wednesday. On Thursday, it continued to fall and broke through the 5-day and 10-day moving averages, and the short-term market weakened. From the overall structure, the rising channel since June 26 remains valid. The highs on Tuesday and Wednesday approached the upper edge of the channel and then fell. The current price turned to fall and approached the lower edge of the channel.
There are two key positions for the support below: the first support level is near 3345, which is the lower edge support of the current rising channel; the second support level is near 3325, which is the trend line support formed by the connection of the previous low points.
From the 4-hour chart, the 3351 low point and the rebound resistance level can be used as a reference for today's long-short game. The breaking of key support and resistance will determine the trend direction of the next stage.
Operation strategy:
Short near 3375, stop loss 3385, profit range 3350-3330
Long near 3330, stop loss 3320, profit range 3350-3370

Gold peaked in the short term. Welcome a new trend?The previous rising structure of gold was broken, especially yesterday's rapid decline broke through the previous support of 3385. Although it rebounded slightly, it was difficult to change the adjustment. Yesterday's high point of the US market was at 3396-98 US dollars. Today, the adjustment trend continued. The dividing point between long and short is 3395 US dollars today. Before the price reaches here, do not consider long.
Many traders are confused. Why are there longs one day and shorts the next day? In fact, this is the characteristic of the volatile market. Breaking the key position cannot last. No matter what you think about the market, you must pay attention to the current shape changes. In the volatile market, you should consider the market of the day more, not the long-term direction.
From the 1-hour chart, the gold price rebounded near 3390 and shorted, and the profit range is 3370-3350.
The backup strategy is to break through 3400 and go long, and pay attention to 3415-3425 on the upside.
In other words, look for opportunities to short on a rebound below 3400 today, and adjust your thinking after breaking through the key resistance.
Gold is weak. Will it continue to fall?Yesterday, the price of gold did not continue to rise as strong as in the previous two days. After reaching the previous top position, it began to retreat under pressure.
The market is too bullish, and under this pattern, the market is likely to have an unexpected reversal. Yesterday, it fell below the 3400 integer mark, so it is likely to maintain a volatile downward trend in the future.
The current main support level is around 3370, which is also the primary point for the bears to continue to break down in the future. Once it falls below this position, the target may be around 3345-3355. It cannot be said that it has completely turned to a bearish position at the moment. It is just a bearish oscillation pattern within a large range, and the upper pressure is maintained near 3405, which is also the support point for the first downward step of the bears on Wednesday.
Today, we still need to operate around the short position first. The price rebounds to 3405 and shorts, and the profit range is around 3390-3380, and the stop loss is 3415.
After a new low appears in the European session, wait for the US session to rebound and continue shorting.
