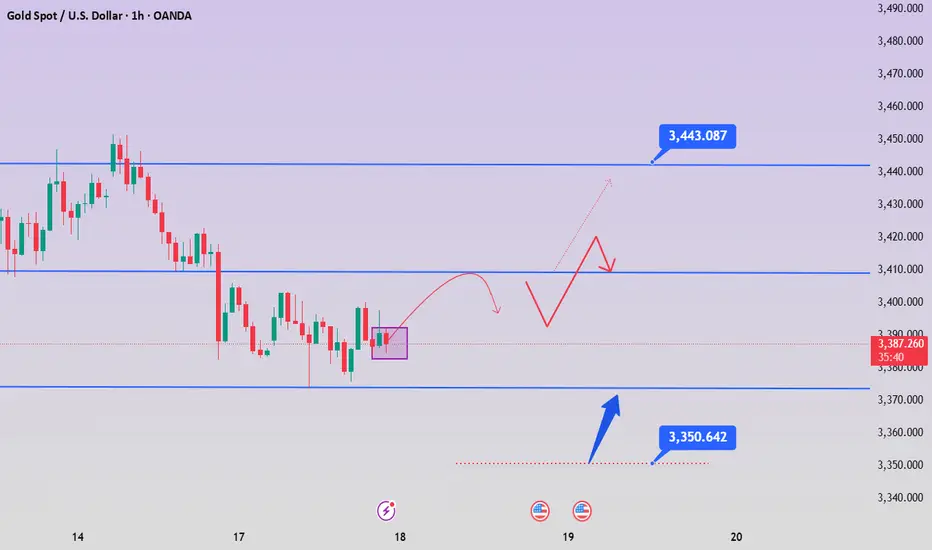
Continue the rally, get ready for gold to return to 3443
⭐️Gold News:
Gold prices (XAU/USD) fell for the second consecutive trading day on Tuesday, retreating from the gains in the early Asian trading hours, which had briefly pushed above $3,400. A slight rebound in the US dollar (USD) continued to put pressure on the precious metal, acting as a major resistance. However, the downside for gold seems limited due to escalating geopolitical tensions in the Middle East and growing market expectations that the Federal Reserve (Fed) will further cut interest rates in 2025.
Meanwhile, the ongoing air conflict between Israel and Iran has entered its fifth day, exacerbating concerns about further escalation in the region. This ongoing geopolitical uncertainty supports demand for safe-haven assets such as gold. Investors also remained cautious ahead of the Federal Open Market Committee (FOMC)'s two-day policy meeting, the outcome of which could affect the next move of non-yielding gold.
⭐️Technical analysis:
Gold price gets liquidity from the support level below: 3385, 3373 completed, short-term downward trend breaks, gold price will soon return to above 3400.
Set gold price:
🔥Sell gold area: 3443-3453 SL 3458
TP1: $3435
TP2: $3422
TP3: $3407
🔥Buy gold area: $3358-$3350 SL $3345
TP1: $3368
TP2: $3376
TP3: $3390
Xauusdtrading
Have you seized the golden opportunity again and again?Today, the strength of gold is very weak. It only rushed up at the opening, and quickly fell below the 3400 mark. Keeping above the key point of 3400, gold continues to be bullish. Now that it has fallen below 3400, the short-term has gone out of the small-level top, and the market is no longer so strong. For our short-term operations, the short-term correction of gold prices focuses on the daily cycle MA5 support, and the weekly MA5 support is long. The rebound focuses on the 3403-3408 resistance card. The rebound can be followed by the short-term! Although gold has fallen below 3400, the short-term direction has changed, but the general direction has not changed. It is still bullish. In the future, we still have the opportunity to look at the high point of 3500, but we have to wait for the bottom to stabilize. Now we can only follow the trend. We will do what the market does.
From a technical point of view, the current macd high dead cross in 4 hours has a large volume, and the smart indicator sto is oversold, which represents the 4-hour shock trend. The current bollinger band three-track shrinkage in 4 hours also represents the range compression. At present, the upper pressure of 4 hours is located at the adhesion point of the middle rail and the moving average MA10 at 3404-3409, while the support corresponds to the moving average MA30 and MA10 near the 3380-3363 line. From the current 4 hours, if the price is to fall directly, the rebound will not exceed the 3420-3422.5 line. The current macd dead cross of the gold 1-hour line is shrinking and sticking, and the smart indicator sto is running downward, indicating that the hourly line continues to fluctuate weakly. What we need to pay attention to now is the adhesion pressure of the upper moving average MA60 and MA30 corresponding to the 3412 line. Pay attention to the resistance of 3403 in the short term. Today's short-term operation of gold recommends rebound shorting as the main, and callback long as the auxiliary, and pay attention to the support of 3380-3370 in the short term.

Geopolitics and Fed policies dominate the trend of gold prices
📌 Gold news
On Monday, boosted by the risk aversion of the Iran-Israel war, the gold price hit a high of 3452, but the continuity was not strong, and a series of other adjustments appeared; let's briefly sort it out:
1: Adjustment: Adjustment is normal. If the market rises, if the risk aversion does not continue to exert force, then the gold price can only return to technical adjustments. Therefore, Monday's adjustment trend and the decline trend are normal!
2: Risk aversion trend: The risk aversion trend will not be reversed for the time being! Once the war starts, it will not end easily; unless the interests of both sides are not damaged, the two sides agree to a ceasefire, but at present, the hope and probability are relatively small, so the risk aversion trend is the mainstream of the current global market;
3: The direction of the Iran-Israel war is nothing more than a few possibilities:
A: The war expands, the surrounding countries stand in line, and the US and Western imperialism join the battlefield; the war expands rapidly! At the same time, Iran is forced to block the Strait of Hormuz! This is a manifestation of escalating war;
B: Both sides, as well as the forces behind them, have calculated their interests, reached an agreement, and agreed to end the war conflict; this mainly depends on Iran's attitude; is it "powerful and unyielding", continuing to oppose the United States and imperialism; or is it pro-American, completely changing its identity, or changing its identity to submit to Israel and the United States;
To sum up: risk aversion eased slightly on Monday, but the overall global market is still risk-averse; technical adjustments are normal trends; but don't completely ignore the importance of risk aversion and risk aversion control because of technical adjustments; in addition, the subsequent results of the Middle East war are nothing more than the above two; what determines all this is the attitude of both sides;
📊Comment Analysis
Although the gold price fell below 3400 and the short-term trend changed, the general direction still remains bullish. In the future, it is still expected to hit the high point of 3500, but it is necessary to wait patiently for the bottom to stabilize before choosing the opportunity to buy the bottom. The current market is changing rapidly, and investors should adhere to the principle of following the trend and flexibly adjust their trading strategies.
💰Strategy Package
Short-term gold 3383-3393 long, stop loss 3372, target 3420-3440;
Short-term gold 3420-3430 short, stop loss 3435, target 3390-3370;
⭐️ Note: Labaron hopes that traders can properly manage their funds

Continue to be bullish after successful adjustment of low longToday, gold opened high at 3448, and fell under pressure after touching 3452. It fell after repeatedly confirming resistance at high levels. We arranged short orders in the 3445-3450 area, successfully touched the target of 3330, and realized profit-taking. Then the market fell back to around 3409 and stabilized and rebounded. We arranged long orders and stopped profit at around 3420. Then we fell back and arranged long orders of 3385 and 3395 to take profits at 3405.
Overall, gold fell slowly after opening high, and maintained sideways consolidation in the European session. The US session continued to fall due to the easing of the geopolitical situation. At present, the focus of the evening is on the support of 3390. If it does not break after the retracement, it can still go long. Pay attention to the key pressure levels of 3410 and 3422 above. The current market is still in the adjustment stage of the upward trend. After the adjustment, it is expected to continue the upward rhythm.
Operation suggestion: Go long on gold when it falls back to around 3390-3392, with the target at 3410 and 3435.
If you still lack direction in gold trading, you might as well try to follow my pace. The strategy is open and transparent, and the execution logic is clear and definite, which may bring new breakthroughs to your trading. The real value does not rely on verbal promises, but is verified by the market and time.

Fed Rate Decision May Trigger a Decline in Gold PricesDespite heightened tensions in the Middle East providing safe-haven support, gold failed to break through the 3450–3455 resistance zone today and instead pulled back to the 3400–3386 support area.
This decline was mainly driven by two factors:
Iran expressed willingness to resume nuclear talks, easing geopolitical tensions and weakening safe-haven demand.
Growing expectations that the Fed will keep rates unchanged this week strengthened the DXY, reducing gold's appeal.
That said, inflation concerns persist, offering medium-term support to gold. On the technical front, the 3378–3340 consolidation zone may serve as secondary support, while stronger trend support lies in the 3310–3289 range—a level that may only be tested under extreme bearish conditions.
For now, the primary support to watch is 3386–3373, with short-term rebound resistance around 3400–3420.
Trading Suggestion:
Ahead of the Fed’s rate decision tomorrow, consider buying on dips, as today’s decline may lead to a technical rebound. Then reassess the market’s response to key support and resistance levels to determine further action.
Iran releases easing signals, gold is still bullish
📣Golden News
1. Iran sends a signal of easing. U.S. media reported that under the pressure of Israeli air strikes, Iran has used Arab intermediaries to send a peace signal to the United States and Israel - asking the United States not to carry out air strikes as a prerequisite for restarting nuclear negotiations, and emphasizing to Israel that controlling violence is in the common interest.
2. Israel's firm stance. Israeli warplanes fly freely over the Iranian capital, and Iran's counterattack is ineffective. Israel is still focused on dismantling Iran's nuclear facilities and weakening its theocratic regime, and there is no motivation to cease fire in the short term.
3. Gold's reaction and strategy. Iran's peace proposal caused the price of gold to plummet to as low as $3,382. However, since the situation in the Middle East has not eased significantly, it is recommended to buy on dips and pay attention to the support level of $3,400. ⭐️Set gold price:
🔥Sell gold area: 3465-3475 SL 3485
TP1: 3450 USD
TP2: 3440 USD
TP3: 3430 USD
🔥Buy gold area: 3390-3388 USD SL 3383 USD
TP1: 3400 USD
TP2: 3410 USD
TP3: 3422 USD

Analysis of gold trend on June 16!
📣Gold information:
Gold prices (XAU/USD) climbed to $3,445 in early Asian trading on Monday, the highest level in more than a month, as rising tensions in the Middle East and expectations of a rate cut by the Federal Reserve boosted demand for safe-haven assets.
Investors remain focused on geopolitical risks despite stronger-than-expected U.S. economic data on Friday. The University of Michigan's consumer confidence index jumped to 60.5 in June, well above market expectations of 53.5 and 52.2 in May. However, the market largely shrugged off the data. Instead, attention turned to the escalating conflict in the Middle East, with Israel's recent attack on Iran fueling concerns about instability in the wider region. In response, Iranian authorities warned that they would "respond firmly to any adventurism," which boosted gold's appeal amid global uncertainty.
⭐️Technical review and analysis: For the current short-term operation of gold, it is recommended to rebound high and go long, with the upward resistance level of 3450-3500 and the downward support level of 3385-3335.
⭐️Set gold price:
🔥Sell gold area: 3465-3475 SL 3485
TP1: $3450
TP2: $3430
🔥Buy gold area: $3390-$3388 SL $3383
TP1: $3400
TP2: $3422

Gold Regains Bullish MomentumGold Regains Bullish Momentum
Gold price started a fresh surge above the $3,375 resistance level.
Important Takeaways for Gold Price Analysis Today
- Gold price started a fresh surge and traded above $3,420 against the US Dollar.
- A key bullish trend line is forming with support at $3,415 on the hourly chart of gold at FXOpen.
Gold Price Technical Analysis
On the hourly chart of Gold at FXOpen, the price formed a base near the $3,300 zone. The price started a steady increase above the $3,350 and $3,375 resistance levels.
There was a decent move above the 50-hour simple moving average and $3,400. The bulls pushed the price above the $3,420 resistance zone. A high was formed near $3,450 and the price is now consolidating gains.
On the downside, immediate support is near the $3,415 level and the 23.6% Fib retracement level of the upward move from the $3,301 swing low to the $3,451 high.
Besides, there is a key bullish trend line forming with support at $3,415. The next major support sits at $3,375 and the 50% Fib retracement level of the upward move from the $3,301 swing low to the $3,451 high.
A downside break below the $3,375 support might send the price toward the $3,335 support. Any more losses might send the price toward the $3,300 support zone.
Immediate resistance is near the $3,450 level. The next major resistance is near the $3,460 level. An upside break above the $3,460 resistance could send Gold price toward $3,480. Any more gains may perhaps set the pace for an increase toward the $3,500 level.
This article represents the opinion of the Companies operating under the FXOpen brand only. It is not to be construed as an offer, solicitation, or recommendation with respect to products and services provided by the Companies operating under the FXOpen brand, nor is it to be considered financial advice.

XAU/USD Chart Analysis Following Israel-Iran StrikesXAU/USD Chart Analysis Following Israel-Iran Strikes
In 2025, the price of gold continues to form a long-term upward trend, highlighted by the black line. The red line previously acted as resistance, resulting in the formation of a contracting triangle on the XAU/USD chart – a typical sign of market equilibrium.
However, this red line was breached (as indicated by the arrow) amid news of the exchange of strikes between Israel and Iran. In response, gold price movements have more clearly outlined the rising blue channel, which began to take shape in the second half of May.
Over the weekend, the strikes continued, and on Monday morning, trading opened with a modest bullish gap. This indicates that geopolitical risk concerns are helping to keep gold prices anchored above the red line.
What could happen to the price of gold next?
Much will depend on how the situation in the Middle East develops. Should the exchange of strikes between Iran and Israel subside and official statements offer hope for de-escalation, a pullback from the upper boundary of the blue channel is likely.
If such a scenario plays out, technical analysts may focus on the support zone around $3,390–3,400 on the XAU/USD chart, formed by:
→ the psychological level of $3,400;
→ the red line, which previously acted as resistance;
→ the median of the blue channel.
This article represents the opinion of the Companies operating under the FXOpen brand only. It is not to be construed as an offer, solicitation, or recommendation with respect to products and services provided by the Companies operating under the FXOpen brand, nor is it to be considered financial advice.

Safe-Haven Demand Expected to Push Gold Prices Toward 3500Last week, intensifying conflict between Israel and Iran triggered a strong wave of risk-off sentiment in the markets.
As a result, we saw sharp rallies across major safe-haven assets and crude oil.
Over the weekend, tensions continued to escalate and even showed signs of further expansion.
Under such circumstances, it's clear that heightened geopolitical risk will continue to support gold prices.
However, 📍$3500 remains a major resistance zone at the moment.
If gold spikes to this level intraday, it’s very likely we’ll see a short-term pullback —
Whether due to profit-taking, cautious positioning by sideline capital, or selling pressure from trapped shorts above 3490,
⚠️ this kind of correction is a natural market reaction — driven by human nature.
Even with strong risk-off demand in place, after a $200 rally,
the market is still subject to volatility from profit-taking behaviors.
🔑 Trading Strategy for This Week
As long as tensions in the Middle East persist,
🎯 the primary bias remains bullish.
However, the entry point is crucial.
💡 Important notes:
Avoid chasing price after sudden spikes caused by breaking news.
Those spikes are not ideal buy zones — instead, look for short-term selling opportunities at those highs.
Once the price pulls back, assess the retracement level and key supports before looking to buy the dip.
We are now within a historically high price range,
which means any rally could trigger profit-taking from earlier longs.
While the overall trend may still head higher,
⚠️ you need to carefully evaluate the size of potential pullbacks and whether your account can withstand the associated risks.
📊 Technical Levels to Watch:
Resistance: 3450-3455 (minor), 3468-3474 (previous high), and 3487-3499 (major historical high)
Support: 3420–3410 zone, and the deeper 3400–3386 range
Stay alert, trade wisely, and remember — in volatile geopolitical environments,
timing and discipline are more important than ever.

6/13 Gold Analysis and Trading SignalsGood morning, everyone!
Gold rallied to around $3399 during yesterday’s session, accurately reaching our preset sell zone at 3385–3403. Since then, the market has started pulling back, and today’s opening shows signs of accelerated downside movement. However, there are several strong support zones below, with immediate focus on 3378–3368, and further support around 3352–3343.
📉 Technical Outlook:
The current price action suggests the potential formation of a Head and Shoulders pattern. If confirmed, this could trigger a deeper correction towards 3340–3330. A break of these levels would significantly weaken the current bullish structure and open further downside risk.
🌍 Fundamental Drivers:
Today’s inflation-related data releases may add significant volatility;
Additionally, stay alert to any developments in the Middle East geopolitical situation, which could quickly shift market sentiment toward risk-off if escalations occur.
📌 Today’s Trading Recommendations:
✅ Sell Zone: 3410–3420
✅ Buy Zone: 3338–3326
🔄 Intraday Key Reaction Levels:
3403 / 3378 / 3362 / 3355 / 3343
🔒 Recommendation: Market is at a technically sensitive zone. Consider entering positions in batches and maintain strict risk control.

Watch Out for Weekly-Level ResistanceAs news of Israel's strike on Iran’s nuclear facility continues to spread, a surge in risk-off sentiment has driven noticeable gains across safe-haven assets. The escalation of tensions in the Middle East has clearly become a key trigger for current market sentiment. Should the conflict intensify further, oil and other safe-haven assets may see continued upside; conversely, if tensions ease, the retreat of risk aversion could lead to price corrections.
From a technical perspective, gold is currently facing downward pressure from the weekly trendline. If geopolitical tensions persist, gold may potentially rally toward the 3500–3550 range. However, without stronger fundamental support, a significant correction could follow once that level is reached.
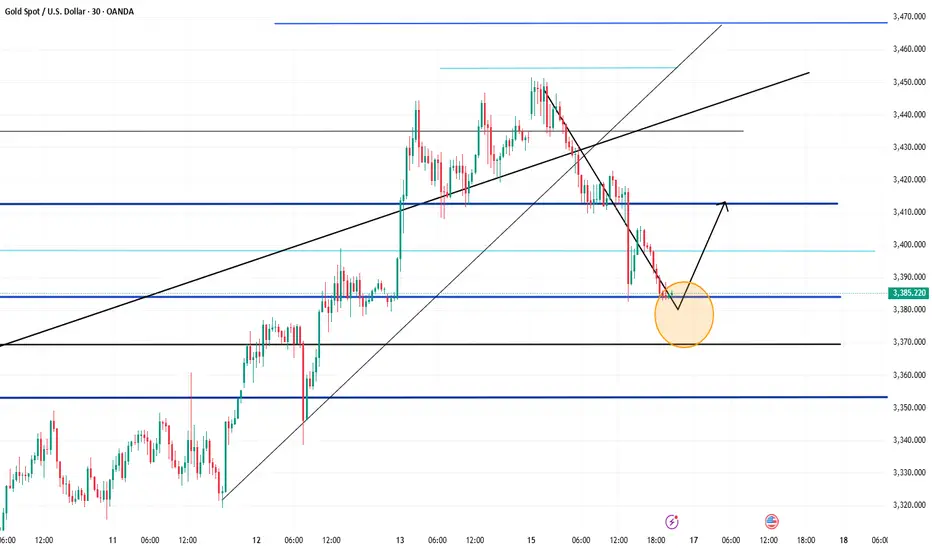
On the intraday chart, the price has now broken below the middle Bollinger Band on the 30-minute timeframe and is near lower band support around 3413. MACD and moving average alignment suggest there may still be room to test the 3396–3388 trend support zone. The 1-hour chart remains in a consolidation phase, and while a short-term rebound is possible, selling at higher levels appears to be the safer strategy for today.
As it is Friday and given the geopolitical uncertainties, the potential for weekend risk is significantly higher. It is recommended to reduce exposure before the market closes. If you choose to hold positions over the weekend, be sure to set appropriate stop-losses to mitigate unexpected developments.

Geopolitical tensions, gold prices may reach 3480 points⭐️Personal comments:
Due to the escalation of geopolitical tensions in the Middle East, market risk sentiment has slightly rebounded, and investors are more inclined to buy traditional safe-haven assets-gold
Moving towards 3480
⭐️Set gold price:
🔥Sell gold area: 3478-3480 SL 3485
TP1: $3462
TP2: $3450
TP3: $3435
🔥Buy gold area: $3375-$3377 SL $3370
TP1: $3389
TP2: $3400
TP3: $3412

Israel attacks Iran, gold price correction can be long gold
📣Gold news
Today, Israel launched an attack on Iran, and the gold price reached a high of $3,433/ounce, the highest level since May 6, and the weekly increase exceeded 3.6%, the highest level since the week of May 19.
Spot gold continued to rise during the US trading session on Thursday, reaching a weekly high of $3,398.55/ounce. However, in the afternoon of the same day, the Chinese Ministry of Commerce stated that China and the United States reached a principled agreement on implementing the consensus of the heads of state call and consolidating the results of the Geneva talks, and made new progress in resolving each other's economic and trade concerns. Affected by the easing of the Sino-US trade situation, the safe-haven demand for gold dropped sharply, and the price fell rapidly by $30 from the high, reaching a low of $3,338/ounce. The market risk appetite has rebounded significantly, and the risk aversion sentiment has cooled significantly. Combined with the fact that the monthly and annual rates of the US CPI released in the evening were both lower than expected, indicating that inflationary pressure has not intensified. After the data was released, the market's expectations for the Fed to cut interest rates by 50 basis points before the end of the year have further increased.
📊Technical analysis:
Technically, the upper track of the daily line is still in a flat state. The current market has reached a high of around 3444. After the rise on Thursday, it is expected that there will be little room above. Since the market is in a volatile rise, it is not suitable to directly chase the rise. The 4-hour Bollinger band continues to diverge upward, and the moving average is arranged in a bullish pattern, indicating that the current market is in a strong position. If it breaks high on Thursday, there will be a chance of rising on Friday. In terms of operation, keep the idea of calling back and going long. If it falls below 3367 again, there will be repeated fluctuations.
Today's operation strategy💰
If the gold price falls back to around 3375, go long. If it is around 3370 and 3365, add more. Stop loss at 3360. Target 3420-3430
Sell short near 3430. Add shorts in batches near 3430 and 3435. Stop loss at 3440. Target 3380-3374
(If you have just entered the market, the gold market is confusing. The operation direction is always reversed. The entry price is not sure. The position is trapped. You can contact Labaron to get the gold price trend analysis And online guidance for unwinding! )
There is no unsuccessful investment, only unsuccessful operation. We have been deeply involved in the industry for more than ten years, with rich practical operation experience and unique trading concepts. We have a global and stable trading system here. We have studied gold, crude oil and other investment fields for many years, with a solid theoretical foundation and practical experience. We are good at combining technical and news operations, focusing on fund management and risk control, and have a stable and decisive operation style. We are recognized by the majority of investment friends for our easy-going and responsible personality and sharp and decisive operations. The analysis article only describes the possible future of the market and expresses opinions. It is not used as a basis for investment decisions. Investment is risky. Trading may not pay attention to reasonable position allocation, fund management and risk control. Do not trade without risk control. Don't let the transaction get out of control.

Gold rose as expected, how to operate after the bulls hit 3400
📌 Gold News
Spot gold prices rose sharply. Analysts pointed out that the US CPI was lower than expected across the board, which hit the US dollar and US bond yields. In addition, tensions in the Middle East escalated, which triggered safe-haven buying of gold
📊Comment Analysis
Middle East issues, and information about high tariffs on countries without trade agreements. Gold prices have rebounded, but there is no long-term stability.
💰Strategy Package
🔥Sell Gold Zone: 3428-3430 SL 3435
TP1: $3410
TP2: $3395
TP3: $3387
🔥Buy Gold Zone: $3345-$3343 SL $3338
TP1: $3365
TP2: $3377
TP3: $3390
⭐️ Note: Labaron hopes that traders can properly manage their funds
- Choose the number of lots that matches your funds

Beware of Bear Traps — Avoid Chasing Prices Blindly!Today, gold rallied up to 3380, then retraced to retest the 1H MA60 (around 3340),
before making another strong upward breakout, surpassing the earlier Asian session high.
📌 This upward move was driven by a combination of key factors:
🔸 Trump’s announcement of new tariffs to be imposed within two weeks
🔸 Rising geopolitical tensions in the Middle East, fueling safe-haven demand
🔸 A weaker-than-expected CPI yesterday
🔸 And an upcoming PPI release later today
📉 Current Price Outlook:
🔺 Strong resistance at 3392, closely watched
🔺 Next resistance zone: 3403–3414
🔻 Key support zones: 3360–3350
⚠️ Also note: the 3289 price gap remains unfilled,
which means downside risks haven’t been fully eliminated — avoid chasing rallies blindly!
✅ Trading Strategy:
Stick with the approach:
📌 Buy near key support, sell near known resistance
📌 Stay alert for news-driven bull traps, and manage risk wisely

XAUUSD:Go long
Gold bottled out and rebounded, hitting the lowest 3319 line, which just gave us the opportunity to leave the 3320 stop profit. Then, under the stimulation of the news surface, it did not break through the 3375 line. Then, combined with the previous ideas, the next need to do long strategy. Keep an eye on the breakout at 3375 during the day.
Trading Strategy:
BUY@3353-58
TP:3375-84
↓↓↓ More detailed strategies and trading will be notified here ↗↗↗
↓↓↓ Keep updated, come to "get" ↗↗↗

Iran hardens steel, gold rises!
📣Gold news
On Thursday (June 12, 00:00 in the Asian morning, spot gold continued to rise, reaching a high of $3,377 so far, a new high this week. The lower-than-expected US CPI data in May increased the possibility of the Federal Reserve's interest rate cut in September, and the trend of the US dollar and the decline in US bond yields provided a favorable environment for gold prices. At the same time, tensions in the Middle East escalated on Wednesday, and Iran said it would attack US military bases in the Middle East if negotiations broke down. The sharp rise in geopolitical tensions in the Middle East has significantly increased the safe-haven demand for gold. Although the conclusion of the US-China trade agreement has eased some market pressure, the potential impact of tariff policies on inflation still needs to be vigilant. Looking ahead, investors need to pay close attention to Thursday's PPI data and the Fed's policy trends, while keeping an eye on the situation in the Middle East. Driven by risk aversion and expectations of loose monetary policy, the gold market still has room for upside in the short term.
📣Technical side:
Yesterday's CPI data was bullish. After a brief surge, it fell back to below 3330, and then fluctuated. The rise was not strong. Late at night, Trump again called on the Federal Reserve to cut interest rates by 100 basis points. Confidence in the Iran nuclear negotiations decreased. In the next one to two weeks, he will send a letter to trading partners to set unilateral tariffs. Uncertain risks increased. Gold rose in contact with the CPI data. In the short term, the price broke through the 3348-3353 suppression. Consider going low around this position during the day, looking at the 3383-89 suppression, stop loss 3337, pay attention to risks.
💰Strategy Package
Today's trading strategy: long around 3349. Stop loss 3337, take profit 3383
Short around 3370, stop loss 3374, take profit 3350
Trend value trading is the only way for all investors to make profits. There is no shortcut, and don't be lucky. Any investor needs to go through the process of loss, capital preservation, and profit from the beginning of entering the market. The market is definitely not a long-term paradise for speculators. A successful speculation does not mean that it can be successful from beginning to end. Only stable and continuous profits can make a person successful. There must be rules here. If you don't break the rules, you won't be eliminated.

The gold trend is perfectly in line with expectations.The recent trend of gold is consistent with my expectations. Overall, the rebound is mainly based on fluctuating downward, and the rhythm of the oscillation between long and short positions is perfectly grasped. The upper resistance is still strong, and gold can still be shorted if the rebound is not broken.
From the current analysis of the gold trend, the lower support focuses on the area around 3315-3305. If it falls back to this position range, continue to look at the continuation of the rebound upward; the upper resistance focuses on the area around 3350-3362. The overall rhythm of the high-altitude and low-multiple range is still maintained, and the strategy is mainly to participate in the range back and forth.
1. Go long when gold falls back to 3315-3305, and the target is 3330-3340;
2. Go short when gold rebounds to 3350-3360, and the target is 3340-3330.

Gold fluctuates repeatedly, and opportunities emerge!Gold was under pressure for the second time during the day, and the pressure at the 3349 line fell back. It continued to be treated with a fluctuating mindset. The 4H cycle observation showed that the Bollinger Bands were closing, and the K-line repeatedly interspersed around the middle track. The short-term structure tended to fluctuate upward. Pay attention to the 3348-3350 and 3362 pressure zones above, and the support below is located in the 3315 and 3302 areas. In terms of operation, the main long and auxiliary short ideas are maintained, and the guidance of CPI data is paid special attention.
Operational suggestions: Gold retreats to the 3315-3305 area and tries to arrange long orders, with the target looking at 3338 and 3349. A strong breakthrough can look up to 3360. If the 3350-3360 pressure zone above is not broken, short orders can be tried in the short term.
All recent trading strategies and ideas have been realized, and the point predictions are accurate. If your current gold operation is not ideal, we hope to help you avoid detours in your investment. Welcome to communicate with us!

Gold Weekly Chart May Form a Mid-Term Bearish Pattern (3142)Gold faced resistance near 3338 and has pulled back,
but the 2-hour chart still suggests that the rebound isn’t over yet, with short-term targets at 3340–3350.
—
📌 For Long Position Holders:
If you're stuck in long positions, consider adding near 3326–3316 support
to average down the cost and prepare for an exit on the next rebound.
⚠️ However, be mindful of your account risk —
If your position is deeply in the red or the account is under pressure, closing out early might be the smarter move.
—
📅 Key Focus This Week: Weekly Chart Signals Critical
🔸 Price is currently testing weekly MA10 — a break below it would target MA20 around 3142
🔸 On the daily chart, MA60 is at 3234, and if support near 3388 breaks,
combined with weak rebound volume, a bearish trend could be confirmed.
In that case, even the 3273 support may fail under bearish momentum.
—
📣 Bottom Line: The bullish setup isn’t invalidated yet,
but caution is crucial when trading long —
📉 If momentum fades, adjust your strategy quickly to protect capital.

Analysis of gold prices on June 11
📌Gold news
🎈Economic data and policy expectations
U.S. employment data; initial jobless claims increased for two consecutive weeks, and the market focus shifted to the non-farm payroll report released this week. The data performance will affect the Fed's policy path.
Trump pressures interest rate cuts: Trump recently called on the Fed to cut interest rates by "one percentage point" again, and hinted that he would consider replacing the Fed chairman, exacerbating market expectations for loose monetary policy.
🎈Long-term support factors
Despite short-term fluctuations, global economic and geopolitical uncertainties (such as repeated trade frictions and debt risks) still provide long-term safe-haven demand for gold, especially in the context of the divergence of monetary policies between European and American central banks, the allocation value of gold is highlighted.
📊Technical analysis
Before the European session, the gold price showed a continuous positive trend. I gave a hint in my analysis that I was not in a hurry to guess the top, and followed the trend to rise to around 3340 and wait for the turning point to appear. The opening trend of the European session tended to fluctuate until it rose to around 3348 in the evening and then turned from rising to falling, but the decline was not strong. It rose again at the position of the European session. Now the gold price is trading around 3350. From the market point of view, this wave of rise was supported by the trend line at 3300. Whether it was geopolitical conflicts or various news about Sino-US trade negotiations that stimulated buying to drive gold prices up, the second rise in the US session has exceeded 3340.
The next key suppression level is around 3360, which is 618 from 3403 to 3300, which can be treated as a turning point. The initial support below focuses on the high point of yesterday's Asian session at 3338.
💰Strategy Package
Waiting for gold: short at 3355-3360, stop loss at 3365, target at 3340-3328!
⭐️ Note: Labaron hopes that traders can properly manage their funds
- Choose the number of lots that matches your funds

Gold V-shaped reversal still has room to rise In the morning, the market was under pressure at 3328, and two consecutive big negative lines fell to the low of 3302, breaking through the lower track of the descending flag consolidation channel, forming an effective break. 3317 was originally the confirmation point of the channel counter-pressure, and it was also the 618 split resistance at the time. Then the middle track was lost, and the trend was bearish, so it tried to rebound but continued to fall under pressure.
But the market immediately made a V-shaped reversal, breaking through the morning high of 3328, and had attacked to 3342 before the US market. The European session was volatile and strong, and with the help of a pullback before and after the U.S. session to lure short sellers, there is still hope for a second rise
The focus of the support for the retracement is on two positions: one is the 3322 line, corresponding to the middle track and 50% split support; the other is 3318, corresponding to the 618 split support. If it stabilizes after touching it, it will most likely point to the 3348 counter-pressure position.
If the pressure of 3348 cannot be broken, there is still a possibility of repeated fluctuations in the short term. It is necessary to pay attention to whether the secondary low point appears when it pulls back to further consolidate the support structure. If the market directly breaks through and stands above 3348, 3293 may have been confirmed as a short-term low.
The recent trading strategy ideas are all realized, and all the points are predicted accurately. If your current gold operation is not ideal, I hope I can help you avoid detours in your investment. Welcome to communicate with us!
