Gold fluctuates, with downward support at 3325
📌 Driving events
The number of ADP jobs in the United States in May was 37,000, expected to be 110,000, and the previous value was 62,000.
📊Comment analysis
Views on the trend of gold in the US market!
After a day of swinging, gold is still fluctuating between 3372 and 3340. After opening high and closing low on Monday, gold has been fluctuating for two days. The ADP data will be released tonight. Whether it can break the trend of the volatile market tonight depends on the release of the ADP data. If it is still the case, we can only wait for the big non-agricultural data on Friday. In the face of this volatile trend, Labaron still recommends maintaining the previous operation strategy.
The support below is 3330-25. If it breaks down, we will talk about it. If it still remains above this level, we will still operate with the oscillating trend. After all, in the face of the current trend of neither long nor short continuity, a single direction will only make you lose all your profits. For the current decline, we should first look at the support of 3330-25!
⭐️ Note: Labaron hopes that traders can properly manage their funds
- Choose the number of lots that matches your funds
Xauusdtrading

Gold Faces Strong Headwinds – Beware of Bull Traps!After rebounding to 3368 yesterday, gold dropped below 3340, and recovered slightly above 3350 late in the session.
Today, it briefly touched the 3372 resistance, only to pull back again — showing just how difficult it is for bulls to push higher.
🔍 Technical Overview:
30M chart has broken below key moving averages
1H chart is facing heavy overhead pressure
⚠️ If prices rise on low volume, it’s likely a bull trap.
Only a volume-backed breakout can confirm a real bullish trend.
⚠️ Important Note:
There’s still an unfilled gap below 3300
If bears take control, filling that gap is highly likely
Today’s ADP jobs data will be critical:
If bearish for gold → sub-3300 is likely
If bullish for gold → 3400 becomes a top-tier short zone

Gold price returns to 3400?
📣 Gold Information
Gold prices gave up some of Monday's gains on Tuesday, falling more than 0.80% as strong U.S. labor market data reinforced expectations of a strong economy and put pressure on the non-yielding metal. As of writing, XAU/USD was trading around $3,348, hitting an intraday high of $3,392.
Investor sentiment picked up after the latest U.S. Job Openings and Labor Turnover Survey (JOLTS) showed a sharp increase in job openings in April, indicating a continued tight labor market. The optimistic data came this week, which will see a series of key employment reports released, including the ADP employment change data for May released on Wednesday and the much-anticipated non-farm payrolls data on Friday, both of which could affect expectations of Fed policy.
📊Comment Analysis
Gold prices maintain bullish momentum, tariff momentum coupled with current unfavorable economic data
💰Strategy Package
🔥Sell Gold Area: 3411-3413 SL 3418
TP1: $3400
TP2: $3390
TP3: $3380🔥
Buy Gold Area: $3332-$3330 SL $3325
TP1: $3345
TP2: $3358
TP3: $3370
⭐️ Note: Labaron hopes that traders can properly manage their funds
- Choose a lot size that matches your funds
- Profit is 4-7% of the capital account
- Stop loss is 1-3% of the capital account

Asian session main long and auxiliary short operation
📣Gold information
There are two main reasons for the rise in international gold prices: First, global trade frictions have intensified. Trump said that he would raise tariffs on steel and aluminum. The EU strongly opposed it and prepared to implement countermeasures. Brazil is also ready to counter, and the market is worried that the United States will resume the "big stick" of tariff policy; second, in terms of geopolitical conflicts, the market is worried that the conflict between Russia and Ukraine will escalate again. Overall, the medium- and long-term rise in gold has not changed, and there is still uncertainty as to whether it can successfully break through the resistance level in the short term.
📊Comment analysis
Today, we need to pay attention to the support effect of the moving average. The current 5-day moving average is near 3340, and the 10-day moving average is near 3325. These two positions constitute important support areas for the short-term correction of gold prices. In terms of upper resistance, pay attention to yesterday's high of 3392. If the gold price can break through this resistance level upward, it means that the upward momentum is strong, and it is expected to continue the strong trend and further open up the upward space.
In terms of points, pay attention to the support near yesterday's low of 3333 below, and the resistance near 3360 and 3370 above.
💰Strategy Package
🔥Sell Gold Zone: 3365-3370 SL 3375
TP1: $3355
TP2: $3340
TP3: $3325
🔥Buy Gold Zone: $3325-$3330 SL $3320
TP1: $3345
TP2: $3355
TP3: $3365
⭐️ Note: Labaron hopes that traders can properly manage their funds
- Choose the number of lots that matches your funds

The pullback did not change the bullish trendGold maintained a weak structure of shock in the Asian and European sessions, and the price slowly adjusted back, forming a secondary bottoming pattern during the day. The current trend is mainly structural consolidation. From a technical perspective, 3328 and 3335 below constitute key short-term support. If it does not break expectations, it will effectively stop the decline and stabilize, and provide a basis for a rebound.
At present, the profit space for chasing shorts is limited. The only stable idea is to wait for the gold price to fall back and stabilize before participating in the long position layout. In terms of operation, it is recommended to arrange long positions near the support level, focusing on the strength of gold's retracement in the 3325-3330 range, and confirming the stabilization of the decline.
Once it stabilizes and rebounds, the short-term long target can be seen at 3350 and 3378, and the extended target focuses on the previous high of 3392. If it breaks through strongly and stands firm at this position, it will further open up to 3400-3410 space.
Operation suggestion: If gold falls back to the 3325-3330 range, go long with a light position. If it falls to 3335 and stabilizes, you can enter long orders in advance, with targets at 3350 and 3378.

Gold is taking a break, the next wave will be even stronger.Gold opened at 3382 today and rebounded to 3392 for a technical decline adjustment. So far, gold has hit a low of 3351. Currently, gold continues to fluctuate around 3360. We will pay attention to the support situation at 3345-50 below. If it does not break through, we will look for opportunities to go long.
Judging from the current trend of gold prices, the overall bullish trend remains, and there is still the possibility of further upward movement in the short term. The support below focuses on the 3345-3350 area, which is an important defensive position for short-term bulls. If it falls back to this area and stabilizes during the day, you can continue to rely on this position to arrange long orders, and the bullish thinking remains unchanged. Pay attention to the 3395-3400 first-line pressure above. If this range is effectively broken, the gold price is expected to hit the previous high and further open up the upward space. From the daily level, the market is still in the "low-long" rhythm of the trend, and it is expected to maintain a volatile upward trend in the short term. The recent market fluctuations are large. In terms of operation, it is necessary to strictly control the position and pay attention to risk prevention.
Gold operation strategy recommendation: Go long when gold falls back to 3345-3355, target: 3380-3390.

GOLD (XAUUSD): Bullish Continuation Confirmed
As we discussed yesterday, Gold managed to break and close above
a resistance line of a bullish flag pattern on a daily.
It opens a potential for more growth.
Our next resistance is 3429.
For buying, consider the expanding demand zone based
on a broken horizontal resistance and a trend line.
❤️Please, support my work with like, thank you!❤️
I am part of Trade Nation's Influencer program and receive a monthly fee for using their TradingView charts in my analysis.

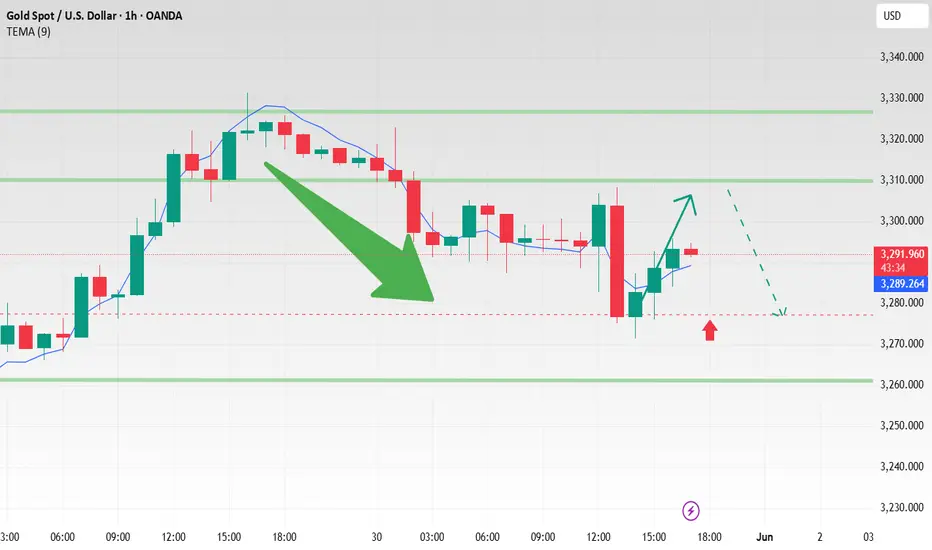
Gold Reclaims 3300, Faces Heavy Resistance AheadGold surged after Monday’s market open, reclaiming the 3300 level, and has already made an initial attempt at the 3306–3312 resistance area, where the 2H MA60 lies. Short-term indicators have started to turn bullish, but several resistance levels lie ahead:
3306–3312: First major resistance
3326–3332: Next target resistance area
Around 3357: Previous gap zone, strong pressure
The upside is full of obstacles, and bulls will need strong momentum to push through.
Also, keep in mind:
Rapid upward moves are often followed by pullbacks. If the price retraces, pay attention to:
Support at 3288–3276
If this zone holds, further upside is likely
Watch for support/resistance role reversals:
A resistance level becomes support once broken
A support level becomes resistance once it breaks
Valid breakouts are confirmed when price stays above/below without immediate reversal
This is one of the most reliable and practical trading principles.
📉 Medium-Term Trend Still Bearish
The broader trend is still in a downward correction. Stay cautious and disciplined with short-term bullish moves.
📅 This week is loaded with key macroeconomic events, including:
PMI Manufacturing
ADP Employment
Non-Farm Payrolls (NFP)
Unemployment Rate
Fed-related speeches and economic commentary
Expect high volatility — great for profits if executed well, but dangerous if misjudged. Opportunities come with risks, so manage them wisely.

Gold: Two Clear Trading OpportunitiesGold surged to around 3390 after today’s open, but has since started to pull back. The current price is nearing the 30M chart MA60 support zone (around 3352), where a minor rebound may occur.
🔍 Short-Term Focus:
Resistance to watch: MA10 area at 3369–3378
Trading bias: Primarily short from higher levels
🌐 Main Considerations:
There's a large gap left open between 3289–3300, which poses a hidden downside risk.
Resistance remains dense above 3400, and the rally left behind potential to form a double top (M shape) or head-and-shoulders pattern.
Be cautious of bull traps and manage your positions wisely.
📌 Clear Trade Opportunities:
✅ Short above 3400
✅ Look for long entries below 3320
The current structure offers identifiable opportunities. Stay disciplined, manage your risk, and trade with confidence.

Short position opportunity at 3366 suppression pointAt present, the focus of gold is on the previous high point of 3360-3366. If the rebound fails to effectively break through this range, you can consider entering a short position. Although gold is in a high-level oscillation stage, you should not blindly chase more. If the upper suppression continues to be effective, there is a risk of a technical correction. If you encounter confusion in operation, please feel free to communicate at any time; if the current gold operation is not ideal, I hope to help you avoid risks and reduce investment detours. I look forward to your contact.
From the perspective of the 4-hour cycle, the upper resistance focuses on the 3360-3366 line, and the short-term support below focuses on the 3320-3325 area. It is recommended to keep operating in line with the trend and follow the main trend unchanged.
Operation strategy: When gold rebounds to the 3360-3366 line and fails to break through, arrange short positions, and target the 3320-3325 range.

6/2 Gold Analysis and Trading SignalsGood evening, traders!
Gold surged more than $70 today, reaching an intraday high of 3363.
If you held short positions from last Friday’s close based on my plan, I hope your SL protected you from major losses.
📉 Technical Insight:
The rapid rally has triggered overbought signals and correction pressure
Watch for pullback support levels at:
3342
3328–3321 zone
If these hold, price might retest 3400 tomorrow
🎯 Trading Plan:
📉 Sell around 3360–3372 (with tight stop)
📈 Buy near 3328–3318 (if price stabilizes)
🔁 Scalp zones:
3332 / 3338 / 3343 / 3352 / 3366

Affected by tariffs, gold prices rebounded to above 3,300
Gold finally broke the calm of the past and resumed its upward trend. What happened? This is also thanks to President Trump, who imposed tariffs again over the weekend, and there was also news of air strikes. The combination of the two directly broke the calm of gold prices in the past.
So where can this wave of gold go? Technically, gold 1-hour cycle, maintained fluctuations around 3,348, and the support line is expected to be around 3,330.
Our strategy today is also very simple. As long as the gold price retests around 3,360-3,350, I will go short. Which specific position can stop profit? I will tell my VIP.

GOLD (XAUUSD): Sense of Fear?!
As the Russia-Ukraine peace talks are going today,
Gold shows clear signs of worry.
The market turned bullish after the opening and is currenty
breaking a resistance line of a bullish flag pattern on a daily
that we discussed earlier.
To confirm the violation, we will need a daily candle close above that.
As the results of the talks are still unknown, more moves may occur today.
So the today's close will be very important.
Let's patiently wait.
❤️Please, support my work with like, thank you!❤️

Gold (XAU/USD) – Inverse Head & Shoulders Breakout Setup🧠 Chart Pattern Identified: Inverse Head & Shoulders
🟡 Left Shoulder ➡️ Formed at a local dip.
⚫ Head ⬇️ Deepest low around 3,274.103.
🟡 Right Shoulder ➡️ Bouncing near the same zone.
🔁 This is a classic bullish reversal pattern — a break above the neckline could signal a strong upside move.
📊 Key Levels & Zones
🔵 Support Zone:
🟦 Area: 3,274 – 3,294
✅ Strong bounce seen here (highlighted by the head and shoulders base)
🔵 Resistance Zone:
📏 Just below 3,305 (marked as neckline)
✋ Price must break this to confirm the reversal
🔵 Target Point:
🎯 3360 📈
📏 Based on the height from head to neckline
🔵 Stop Loss Zone:
❌ 3,274.526
🔻 Below the head for safe risk control
⚙️ Trading Setup Summary
🔹 📍 Entry Point:
📌 Around 3,294.449
🚪 Enter on breakout above neckline
🔹 🎯 Target Point:
🏁 3360
🔹 🛑 Stop Loss:
🚫 3,274.526
🔹 Risk-Reward Setup:
🔍 Targeting a move of ~65 points
⚖️ Risk of ~20 points → solid R/R ratio
📈 Indicator:
🧮 EMA 70 ➡️ 3,305.005
⏳ Price currently testing it — a break above EMA would boost bullish confirmation.
📅 Economic Events:
📆 Multiple event icons suggest upcoming news — expect volatility!
⚠️ Be cautious during these times.
✅ Final Thoughts:
📊 Pattern suggests a bullish breakout is near 🚀
🔒 Use stop-loss and enter after breakout to manage risk effectively
🎯 Keep an eye on volume during breakout — it confirms strength

The volatility is an illusion, and gold is brewing major changesGold fluctuated downward in the Asian session on Friday, while it remained in the range of 3287-3303 in the European session. Although it tried to break through the short-term pressure level of 3300-3306 many times, it has never been able to stand firmly. I arranged to go long at 3288-3289 in advance, notified to enter the market at the point, and finally reached the target of 3303 perfectly, earning 15 points of profit! Quick, accurate and ruthless, with the right idea, profit-taking is as easy as drinking water! Therefore, it is recommended that we continue to pay attention to the short-term support of 3290-3285 below. If the price fails to break through the support range like in the early trading, you can consider trying to enter the long position.
Given that today is Friday, the market volatility may be "demon-like", so you need to be extra cautious in operation and pay close attention to the changes in the market. At the same time, you must keep in mind the principle of "taking profits for safety"-lock in profits in time when you can see them, and don't easily bet on trends that you don't understand. If your current gold operation effect is not ideal, I hope my analysis can help you avoid some detours. Welcome to communicate at any time!
Today, the monthly, weekly and daily lines closed simultaneously. At the same time, the PCE data will be released during the US trading session, and the market volatility may intensify.
From a technical point of view, 3285 is also the key to long and short today. If gold does not break 3285 today, the strength of gold bulls is expected to continue, and there is still room for gold to move upward. If gold continues to fall and falls below 3285, then gold may begin to fluctuate in a large range. The upper resistance is in the 3320-3330 area, and the focus is on the 3335-3340 line of suppression. Pay attention to the 3290-3285 line of support below, and the key position below is in the 3280 area. If it breaks below the 3280 area during the day, the market is expected to fall again to the 3265-3250-3240 area.

GOLD (XAUUSD): Support : Resistance Analysis For Next Week
Here is my latest structure analysis and
important supports & resistances for Gold for next week.
Horizontal Structures
Support 1: 3238 - 3286 area
Support 2: 3122 - 3179 area
Support 3: 2957 - 2982 area
Resistance 1: 3353 - 3366 area
Resistance 2: 3427 - 3425 area
Resistance 3: 3483 - 3501 area
Vertical Structures
Vertical Support 1: falling trend line
Vertical Resistance 1: falling trend line
Consider these structures for pullback/breakout trading.
❤️Please, support my work with like, thank you!❤️
I am part of Trade Nation's Influencer program and receive a monthly fee for using their TradingView charts in my analysis.

Gold retested as expected, what to do next?
Gold rebounded from 3308 in the US market and fell to 3272. The recent market is good-looking but difficult to do. The long and short positions are repeatedly washed. The monthly line basically closed at the cross star. Under the fierce game between long and short positions, the performance was balanced.
The short-term hourly line is only a single negative line that fell rapidly, and it does not have downward continuity. The high point of the US market rebound is around 3302. If you want to participate, you can go short when it reaches around 3302. As of press time, gold is accumulating strength around 3293. If you step back below, you can rely on the low point for defense.
⭐️ Note: Labaron hopes that traders can properly manage their funds
- Choose the number of lots that matches your funds
- Profit is 4-7% of the fund account
- Stop loss is 1-3% of the fund account
Gold rebounds in the US market and continues to be short!
📊Comment analysis
Gold rose yesterday under the stimulus of risk aversion, so gold did not continue to rise today, which means that the risk aversion sentiment of gold has been digested, and the 1-hour moving average of gold has also begun to turn downward and has not crossed upward, so the momentum of gold shorts has begun to increase, and gold rebounds and continues to be short. After gold surged, it has been under pressure at the 3310 line and cannot break through. Therefore, gold rebounds in the US market and continues to be short at highs under pressure at 3310.
💰Strategy Package
US trading operation ideas:
Gold 3304-3310 short, stop loss 3315, target 3280-3270-3260;
⭐️ Note: Labaron hopes that traders can properly manage their funds
- Choose the number of lots that matches your funds
- Profit is 4-7% of the capital account
- Stop loss is 1-3% of the capital account

It seems calm, but there are actually undercurrents!Today, the monthly, weekly and daily lines closed simultaneously. At the same time, the PCE data will be released during the US trading session, and the market volatility may intensify.
From a technical point of view, 3285 is also the key to long and short today. If gold does not break 3285 today, the strength of gold bulls is expected to continue, and there is still room for gold to move upward. If gold continues to fall and falls below 3285, then gold may begin to fluctuate in a large range. The upper resistance is in the 3320-3330 area, and the focus is on the 3335-3340 line of suppression. Pay attention to the 3290-3285 line of support below, and the key position below is in the 3280 area. If it breaks below the 3280 area during the day, the market is expected to fall again to the 3265-3250-3240 area.

Gold Poised for a Breakout After Sideways ConsolidationGold has retraced to the 3300 level and remained range-bound for an extended period. This prolonged consolidation suggests that a sharp breakout may be imminent, with the next move — whether up or down — likely to be swift and volatile.
Looking at the 2-hour chart, the current price structure is complex. It could be interpreted as a potential double top, but it also resembles the early formation of an inverse head and shoulders, which makes trading decisions more challenging.
From a technical standpoint:
Moving averages are aligned in a bearish setup, and the area above remains densely packed with resistance.
MACD on the 2H chart shows a bearish crossover, signaling a potential continuation of the downtrend.
However, on the 30-minute chart, MACD shows some short-term bullish momentum, with the next resistance near 3306.
For bulls, if the price attempts to rise toward the 3306–3312 zone but then quickly pulls back, this would indicate weak buying pressure, and caution is advised.
In summary, short-term signals are bullish, but the medium-term trend remains bearish. With the market in a sideways range, it's best to remain patient and watch for breakout signals. The two trading opportunities shared yesterday remain valid and worth monitoring closely.

XAU/USD Chart Analysis: Gold Price Stabilises Around $3,300XAU/USD Chart Analysis: Gold Price Stabilises Around $3,300
Throughout May, a turbulent news backdrop — involving both international trade tariffs and armed conflicts — led to the formation of a peak around $3,430 and a low near $3,130 on the XAU/USD chart. As of today, the price per ounce stands around $3,300 — roughly the same level as at the beginning of the month.
This suggests that supply and demand forces are largely balanced, keeping the price contained between these extremes. The XAU/USD chart provides further confirmation, emphasising the significance of the $3,300 level.
Technical Analysis of the XAU/USD Chart
From a bearish perspective: The A→B→C→D→E sequence forms lower highs and lower lows — a clear sign of a downtrend. This trajectory is marked in red, with the upper line acting as resistance.
From a bullish perspective: Since the beginning of 2025, the gold price has been moving in an uptrend,indicated by a blue channel, with its lower boundary serving as key support (highlighted with arrows).
Notably, these support and resistance lines are converging, forming a narrowing triangle — an indication that supply and demand are balancing, finding consensus around the $3,300 level, where the axis of the triangle lies.
Given this, it is reasonable to assume that in June, the gold price on the XAU/USD chart may continue to fluctuate within this triangle — unless an extraordinary event causes a significant shift in the current balance.
This article represents the opinion of the Companies operating under the FXOpen brand only. It is not to be construed as an offer, solicitation, or recommendation with respect to products and services provided by the Companies operating under the FXOpen brand, nor is it to be considered financial advice.

Gold awaits tariff volatility!
📌 Driving Events
Gold rebounded from a weekly low near $3,245 and broke through the $3,300 mark on Thursday, boosted by optimism following a weaker-than-expected U.S. jobs report and a U.S. court ruling halting President Trump's proposed tariffs.
Gold fell on Friday as the dollar rose slightly, while investors await a U.S. inflation report that could provide further insights into the Fed's policy trajectory.
📊 Commentary Analysis
The market continued to fall for an hour, fluctuating back and forth, lacking continuity - it rose yesterday and fell today. Gold rebounded above $3,320 in early trading before retreating. On the weekly and daily charts, the trend is still dominated by range fluctuations rather than unilateral gains or losses.
I think shorting gold should be considered today, with support below at $3,280-3,270-3,260. However, prices may struggle to make new lows. As today is the monthly close, large fluctuations suggest that we should avoid chasing ups and downs.
💰Strategy plan
XAUUSD
Sell: 3330-3320-3310
tp: 3300-3290-3280

XAUUSD: The LH trendline is the difference maker.Gold is neutral on its 1D technical outlook (RSI = 54.327, MACD = 32.010, ADX = 35.582), staying under the high impact LH trendline that has been keeping the medium term trend bearish since the April 22nd High. As long as the price is under it, we are short, aiming for the S1 level (TP = 3,246) and not below it as the 1D MA50 offers long term support. If the price closes a 1D candle over the LH trendline, we will turn long and aim for a +7.39% rise from the bottom (TP = 3,485), which has already taken place twice in the past 30 days.
## If you like our free content follow our profile to get more daily ideas. ##
## Comments and likes are greatly appreciated. ##
