Don’t Blink — Gold Charging Toward 3400!Overnight, we entered a long trade at 3365 and successfully closed the trade by hitting TP: 3395, locking in nearly 300pips of profit. This was a very successful and accurate trading strategy.
Just now, gold became very crazy after rising, and plunged directly from around 3397 to around 3372. It was a very scary and crazy diving action. In fact, I am not worried about it. On the contrary, I am very happy that it provides me with another opportunity to enter the market and go long on gold. I've already entered a long position in gold again, as planned, in the 3375-3365 area.
Regarding the recent plunge in gold, I think it was intended to scare off the long positions that were somewhat loose in their intentions. Although gold has fallen sharply, it is still in a recent volatile upward structure. The volatile upward structure has not been destroyed in the short term, so I believe that gold will not have much room for retracement for the time being under the support of the bullish structure. On the contrary, I believe that after gold touches around 3397, even if it is weak, it will try to hit the 3400 mark, and it is even expected to continue the bullish trend to the 3420-3430 area.
There may be many friends in the market waiting for the opportunity to enter the long market at 3350 or even 3340, but what I want to say is that under the support of the gold bull structure, the downward space has been greatly limited. In the short term, gold may not go to such a low position at all, so relatively speaking, I prefer to go long on gold in the 3375-3365 area, and I have indeed done so!
Xauusdtrend

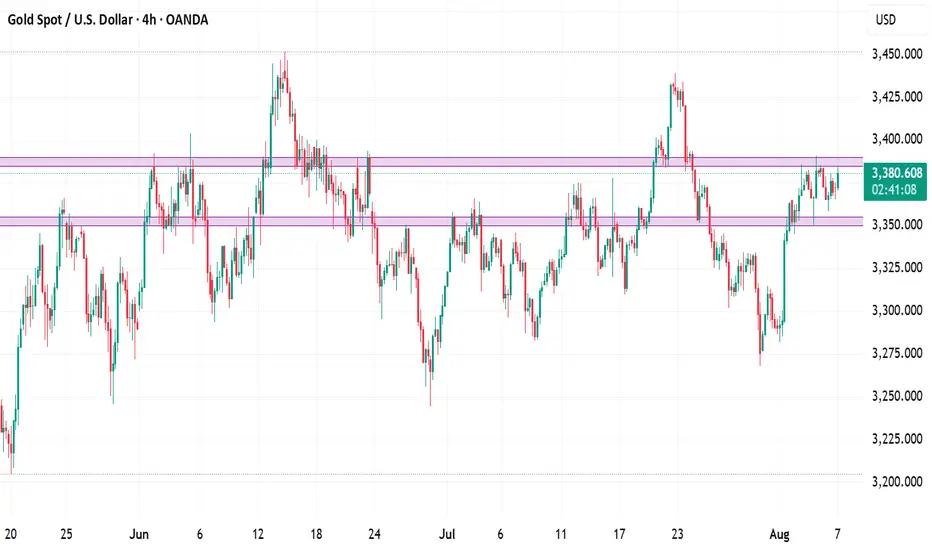
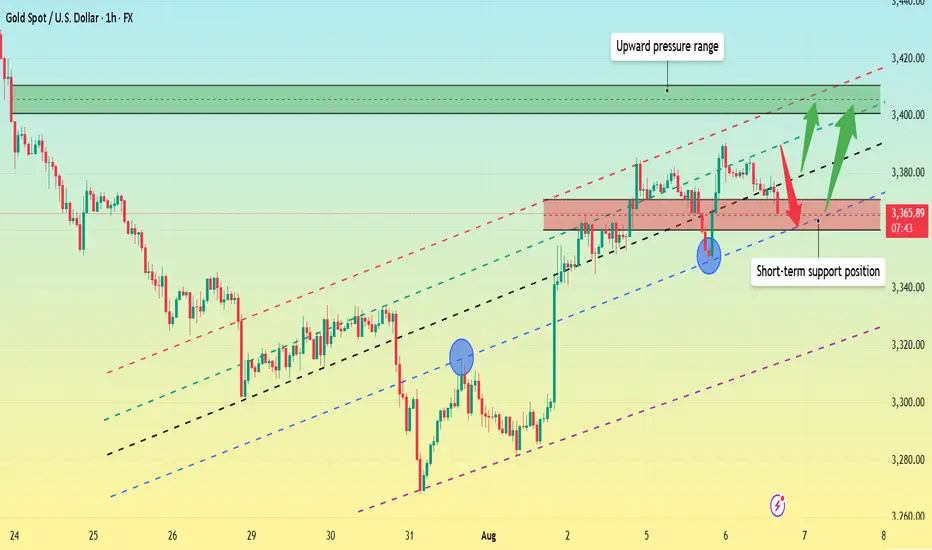
Gold is under pressure. Can the upward trend continue?On Thursday, gold rose rapidly in the European session, reaching around 3397, but failed to successfully break through the 3400 integer mark; it currently fell back slightly and fluctuated around 3375. Judging from the 4-hour chart, the price is currently running close to the middle track of the Bollinger band; since the market opened this week, the gold price has continued to run above the middle track of the Bollinger band. Despite the slight decline, it has remained within the upward trend channel and has continuously set new highs.
The current upward pressure position remains at 3390-3400, and the key support level is around 3370, which is also the crossover position of the current MA5, 10, and 20 moving averages. The RSI indicator remains above its midline, indicating that bullish momentum remains.
Quaid believes that as long as the price remains above 3370 in the US session, any pullback will be a sign of accumulating upward momentum. Gold still has the trend of hitting the 3400 integer mark.
Trading strategy:
Go long near 3370, stop loss at 3360, profit range 3380-3390-3400.
Short near 3400, stop loss at 3410, profit range 3375-3365-3355.

Gold Consolidates at High Levels. Waiting for a New Trend?Gold barely held the 3360 level on Wednesday and will remain in the 3360-3380 consolidation range outlined by Quaid.
Quaid considers Thursday to be a more important day. From a timing perspective, today may impact whether gold can continue its upward trend. However, it is possible that the market could continue its consolidation today. One thing is that the daily line must close above 3360, then the subsequent rise in gold will continue.
On the contrary, if it closes below 3360, then the rise will definitely not be able to continue in the short term. In the short term, gold may remain above 3370 today.
We can see that 3375-3370 is an important support, but the daily line has not yet stabilized above 3380, so the upward space has not yet been opened. If the daily chart can stabilize above 3380, then a test of 3400-3410 is in the cards.
Trading strategy:
Buy between 3365-3370, stop loss at 3355, profit range 3380-3390-3400.
Institutional Gold Strategy Note – August 7, 2025🔍 Executive Summary
Gold (XAU/USD) continues to hold firm above the $3,370 handle, supported by a bullish macro narrative and confirmed technical structure on the 4-hour chart. Amid dovish expectations from the Fed and soft labor market data out of the U.S., bullion maintains its premium as a hedge, attracting institutional flow in line with the rate-cut narrative for Q3–Q4.
Today’s market profile suggests a high-probability long setup, anchored in a fresh demand structure just below current price, supported by unmitigated institutional order flow, premium discount levels, and clear liquidity sweeps.
🎯 Directional Bias: Bullish–Transitional
While price is consolidating around $3,378, the underlying structure favors a bullish continuation. A Change of Character (CHoCH) has been confirmed on the 4H chart, suggesting a shift from corrective to impulsive intent. Liquidity remains stacked below recent equal lows, and the premium-to-discount array strongly favors buy-side execution.
🟩 Primary Buy Zone (GOLDEN ZONE)
Entry: $3,350–$3,355 | Stop-Loss: < $3,340 | Targets: $3,400 / $3,430
This zone represents the highest institutional quality setup of the day. It aligns with:
A fresh unmitigated Rally-Base-Rally Demand Zone
A refined Bullish Order Block within optimal trade entry (OTE) discount range
A Fair Value Gap (FVG) aligned with internal BOS leg
Equal Lows (EQL) sweep below $3,355, targeting liquidity
Overlap with volume imbalance, suggesting a clean institutional leg
Clear CHoCH confirming bullish structure
Kill Zone Alignment: Asia–London overlap, pre-London accumulation
This zone is statistically favored for execution by both Smart Money and legacy institutions, given its confluence density and asymmetrical risk profile.
🟥 Primary Sell Zone
Entry: $3,385–$3,390 | Stop-Loss: > $3,400 | Targets: $3,350 / $3,320
A valid counter-trend liquidity sweep opportunity, located above short-term equal highs near the psychological $3,400 level. Key confluences include:
Drop-Base-Drop Supply Zone
Overlapping FVG + OB in premium zone
Alignment with OTE premium retracement
Liquidity cluster near recent EQH
Structural resistance + round-number magnetism
Execution window during London–NY overlap
This zone is valid only for short-duration scalps or short-term reversal positioning.
🟢 Fallback Buy Zone (If Primary is invalidated)
Entry: $3,320–$3,325 | SL: < $3,310 | TPs: $3,400 / $3,430
A deeper mitigation zone with reduced confluence but adequate historical support. This zone captures:
A mitigated OB inside Demand
0.618 Fib retracement from internal BOS
Liquidity sweep potential of a broader EQL stack
Minor structure support
Use only if the market sweeps the primary zone and rebalances deeper.
🔻 Fallback Sell Zone (If Primary Sell fails)
Entry: $3,410–$3,415 | SL: > $3,420 | TP: $3,350
Set well above prior resistance, this extended zone aligns with:
Extended Supply + Unmitigated OB
FVG inside premium OTE zone
Recent accumulation liquidity trap (potential fakeout zone)
Session mispricing during NY–Asia rollover
Use only if price impulsively breaches the $3,400 psychological barrier and stalls near the top of an exhaustion leg.
🌐 Institutional Cross-Validation
Citi Group has upgraded its 3-month Gold forecast to $3,500, citing weakening U.S. macro data and elevated inflation expectations as bullish catalysts.
Reuters and FXStreet confirm Gold's hold near 1-week highs with sentiment strongly skewed toward continued demand amid Fed rate-cut odds exceeding 90%.
TradingView pro charts show confluence with OB/FVG zones at both $3,355 and $3,390, validating both primary zones technically.
📌 Final Notes
Action Bias:
Aggressively long from $3,350–$3,355 with tight structure-defined invalidation.
Hold shorts only from $3,385–$3,390 under strict reversal logic.
Risk Reminder:
All zones are built from 4H structural flow only. Intraday volatility outside kill zones may distort price behavior — wait for displacements and internal breaks before entering. Manage partials at 1.272 extension and hold runners toward 1.618 only if structure confirms.
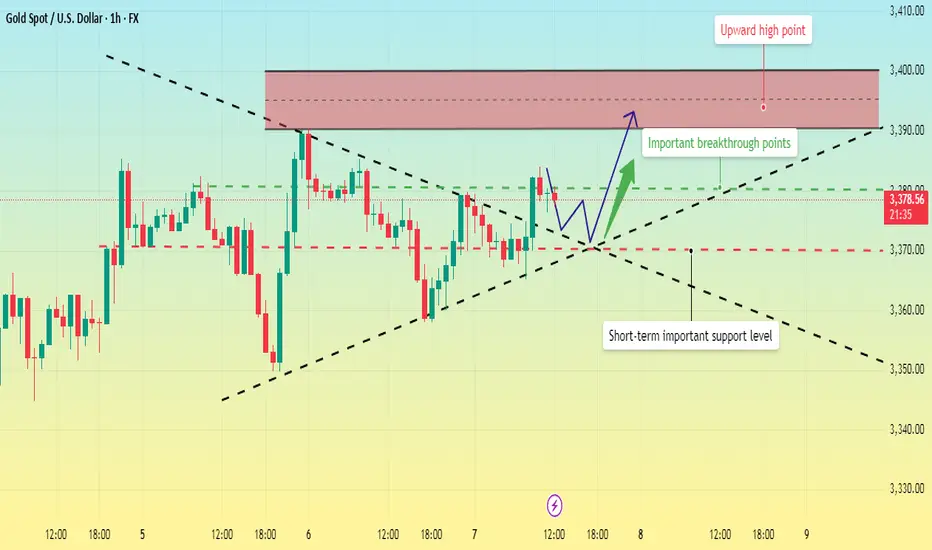
Bullish Outlook Intact: Gold Targeting 3400-3410Gold encountered resistance and retreated several times on its way to 3400, but it remained above 3370 during the pullback, perfectly maintaining the integrity of its volatile upward trend. Therefore, even though gold's upward momentum has weakened, I still believe that due to structural support, gold still has the potential to reach the 3400-3410 area, and may even continue its bullish trend to the 3420-3430 area.
As gold prices rise, market sentiment tends to be more optimistic, and the price behavior reflected by the candlestick chart becomes clearer. The lows of gold continue to rise, and the highs always insist on setting new highs in the process of rising. The oscillating upward structure is particularly obvious. While greatly limiting the retracement space, it also greatly consolidates the support structure below and is conducive to further rises in gold. At present, gold has been confirmed to have stabilized above 3370, so gold may not give another chance to fall back to the 3360-3350 area.
Then in the next short-term trading, the gold pullback is a buying opportunity. We focus on the opportunity to participate in long gold after gold retreats to 3380-3370. The target will first look at the 3400-3410 area, and the higher target area is in the 3420-3430 area.

Gold Holds Firm. Continues to Set New Highs?After four consecutive days of gains, gold continued its volatile upward trend on Thursday, reaching a new high for August. This performance suggests a relatively strong, volatile upward trend in the short term. The moving average system is currently extending upward, providing some support for the rise.
In the short term, focus on the support strength near 3380 on the MA5 moving average, which is a key indicator of the short-term trend. If this support level is broken, continue to monitor support near 3370 and 3365. 3370 marked the low point of Thursday's rapid decline in the European session, while 3365 marked the lowest point reached on Thursday.
It is worth noting that gold has maintained an overall volatile upward trend this week, with prices continuously reaching new highs. Therefore, as long as the price remains above yesterday's low, Quaid believes the market will continue to fluctuate upward. On the upside, we need to pay attention to the resistance near 3400-3410. The price has tried to break through many times, but has failed to stabilize above the integer mark of 3400. If it fails to break through strongly, the price will most likely make a correction and try to break through again after accumulating upward momentum.
Trading Strategy:
Short around 3405, stop loss at 3415, profit range 3380-3365
Long around 3365, stop loss at 3355, profit range 3380-3400

Prices are suppressed. Will they rise amidst volatility?Information Summary:
Trump's upcoming appointment of Federal Reserve officials has the market on the sidelines, leading to a pullback in gold prices, but bullish sentiment remains.
Quaid believes that most investors are closely watching the White House's upcoming Federal Reserve appointments and any trade-related news, which could have a significant impact on market sentiment.
Furthermore, market expectations for a September rate cut are high. After last week's weak jobs report, investors are pricing in an 87% chance of a September rate cut, according to the CME FedWatch tool. Following the release of the report, Trump fired the director of the Bureau of Labor Statistics, further exacerbating policy uncertainty.
As a traditional safe-haven asset, gold generally performs better in environments with increased political and economic uncertainty and low interest rates.
Market Analysis:
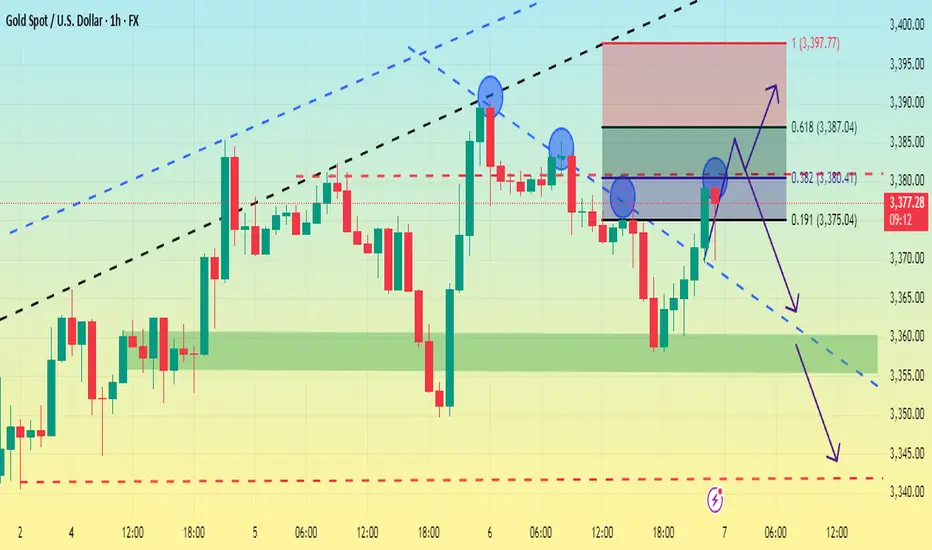
Gold prices retreated slightly on Wednesday, but Quaid believes there is still room for further gains, with a short-term target of 3,400. Supporting factors include: continued tariff friction; slowing economic growth and inflation concerns; and a weak US dollar.
Looking at the hourly chart, the Fibonacci 0.382 position is right around 3380. Moreover, the top of the trend line of gold's bottoming rebound is also at this position, so if the pressure of 3380 cannot be broken through, we need to be alert to the possibility of a pullback.
Next, keep an eye on 3360. If gold can't break through 3380, it may consolidate between 3360 and 3380.
If bears continue to push down the price below 3360, a test of 3340 is possible.
Gold retreats. Is it gathering upward momentum?
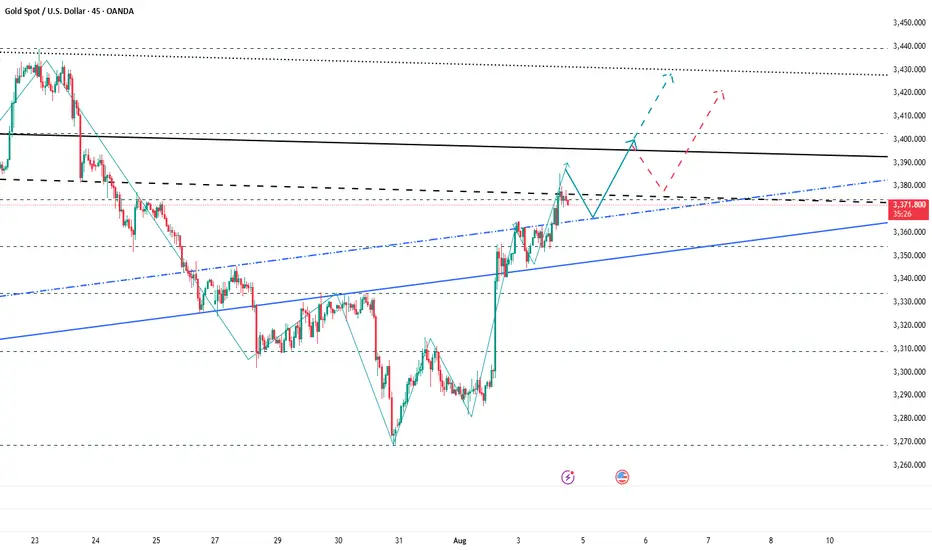
The 4-hour chart shows a clear market trend. On Tuesday, gold reached a high near 3390, and it's now firmly above the 4-hour trendline. The retracement reached a low near 3350, essentially completing the correction. Therefore, today's upward trend is likely to continue, aiming for new highs. The current resistance level is around 3400-3410.
From the 1-hour chart, key support lies between 3370-3360. Quaid believes that today's price must not fall below 3360. If it falls back below 3360, it's likely to retest the low of 3350.
However, as long as it remains above support, gold will remain in an upward trend. Upward resistance lies around 3400-3410.
Trading strategy:
Go long near 3360, stop loss at 3345, profit range 3380-3400.
Short near 3390, stop loss at 3410, profit range 3380-3370-3360.
Gold is strong. Is a round number nearing its high?Information Summary:
On Tuesday, Trump made a splash. He announced four nominees for the next Federal Reserve Chair, removing Treasury Secretary Bensont from the list. He also announced tariffs on semiconductors and pharmaceuticals next week, warned of increasing tariffs on Indian goods "within the next 24 hours," and threatened to impose a 35% tariff on the EU if it failed to fulfill its obligations.
As a result, gold rose nearly $30 from its intraday low of $3,350, briefly breaking above $3,380.
Market Analysis:
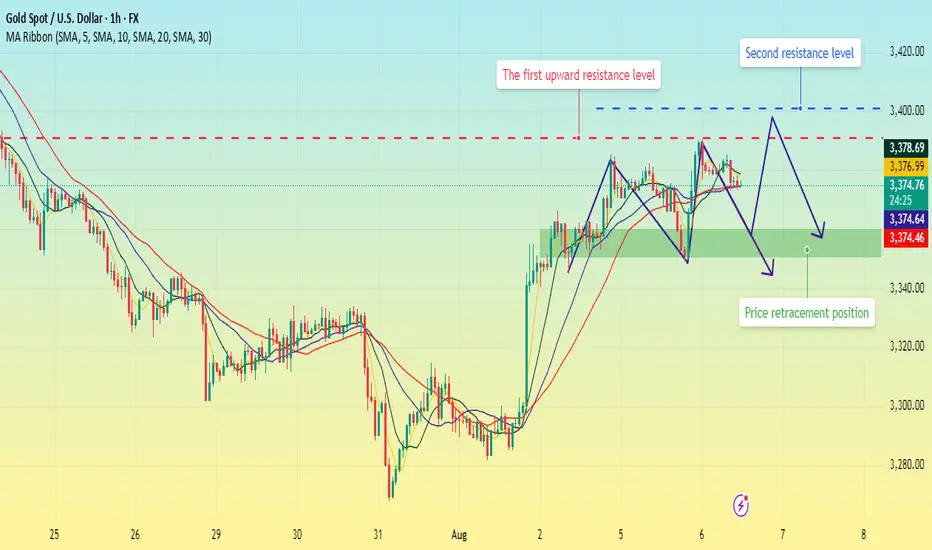
Gold has been trending upwards since the start of the week, with four consecutive daily gains, indicating a gradual buildup of bullish momentum. Judging from the 1-hour moving average indicator, the MA5 and 10 moving averages are currently turning downward, while the 20 and 30 moving averages are moving flat, which indicates that the overall short-term market trend is waiting for a price correction. Quaid believes investors should wait for the price correction to complete before entering a long position.
The key short-term trend is Tuesday's low of 3350. If gold prices hold above this level, we should maintain a positive outlook in the short term. The first resistance level above is near Tuesday’s high of 3390; the second focus is on the 3400 integer mark.
Trading strategy:
Short around 3395, stop loss at 3405, profit range 3370-3350
Long around 3350-3360, stop loss at 3340, profit range 3370-3390.
Gold continues its upward trend. A strong week ahead?Gold's technical outlook on the daily chart maintains a bullish structure, with prices trading within the upper middle Bollinger Bands. The 7-day and 10-day moving averages have formed a golden cross, and the RSI indicator is trading above its mid-axis.
The short-term 1-hour chart shows prices trading within the upper middle Bollinger Bands, with the moving averages forming a golden cross and the RSI indicator pointing upwards. Quaid believes that the trading strategy for Wednesday remains unchanged, with the main focus on low-level long positions during pullbacks, supplemented by high-level short positions.
Gold initially fell before rising on Tuesday, breaking through the intraday high and touching the 3390 level. It closed with a doji with upper and lower shadows. The current bullish trend remains intact, with the moving averages in a bullish formation. However, the 4-hour chart is approaching the acceleration line, creating downward pressure. This suggests a short-term bullish risk zone, and it is advisable to avoid buying at high levels. The hourly chart showed a sideways trend, closing below the upper line. While it hasn't broken below the moving average, the indicator has turned. Therefore, based on the overall market trend today, Quaid believes there's a high probability of further upward movement after a correction.
Trading Strategy:
Long at 3355-3360, stop loss at 3345, profit range 3380-3400;
Short at 3390-3395, stop loss at 3405, profit range 3360-3350;
Key Points:
First Support Level: 3370, Second Support Level: 3360, Third Support Level: 3350
First Resistance Level: 3390, Second Resistance Level: 3400, Third Resistance Level: 3410

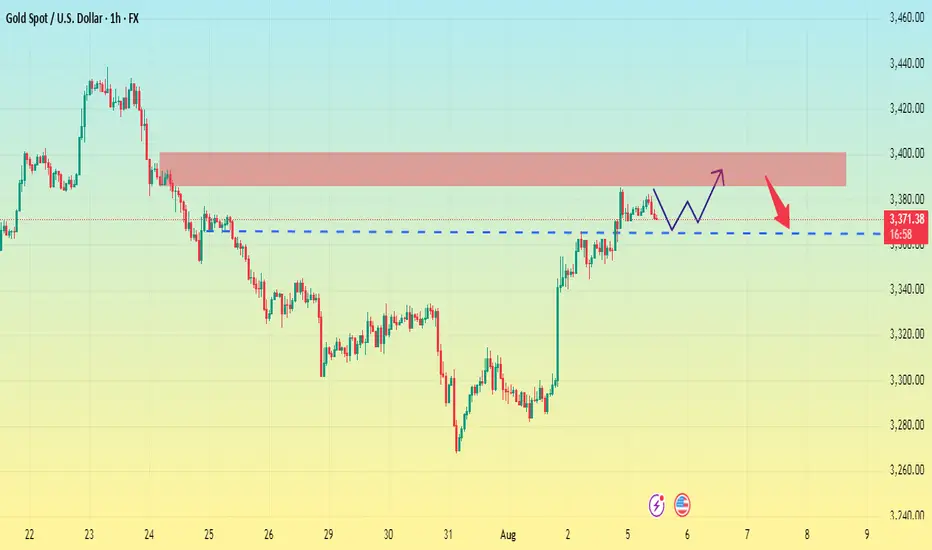
Gold has bottomed out and rebounded. Where will the high point bGold has currently hit a low near 3350, rebounding from the bottom and now rising to around 3390.
Looking at the 1-hour chart:
The most critical upward level is currently around 3390. If the price breaks through this level and stabilizes above it, the late July high of 3430 could be revisited. Conversely, if it remains below 3390, the overall range will remain between 3350 and 3390.
Secondly, looking at the 4-hour chart, we can see that the trend line resistance level is also currently around 3390. If the price stabilizes above 3390, the upper 4-hour chart could directly reach the 3400-3410 range. If the price holds above 3410 again, the next target would be around 3450.

Next Stop 3420? Gold Bulls Push the LimitBecause the U.S. non-farm payroll report performed worse than expected, gold rebounded strongly last Friday and recovered half of its losses in one fell swoop. The bulls returned strongly. Today, after consolidating at a high level, gold continued to choose to break upward, reaching a high of around 3385.
There is no doubt that bullish forces still hold the upper hand. From a fundamental perspective, the Federal Reserve is currently facing greater pressure to cut interest rates; and it can also be clearly seen from the candlestick chart that a significant "W"-shaped double bottom structure has been constructed near 3268 and 3280, which has limited the gold's retracement space while also playing a key structural support role in the rise of gold. With the combined effects of news and technical factors, gold still has the potential to continue its upward trend. And I think there is still a great possibility that gold will test the 3400 mark again. Once gold stabilizes at 3400, it will definitely hit the 3420-3430 area.
As the center of gravity of gold gradually shifts upward, the lower support area also moves up. The current short-term support is obviously in the 3365-3355 area, while the relatively strong support is in the 3345-3335 area. According to the current pattern structure, the bulls may not allow gold to retreat to the 3345-3335 area. So in terms of short-term trading, we first consider the opportunity to enter long positions in the 3365-3355 area!
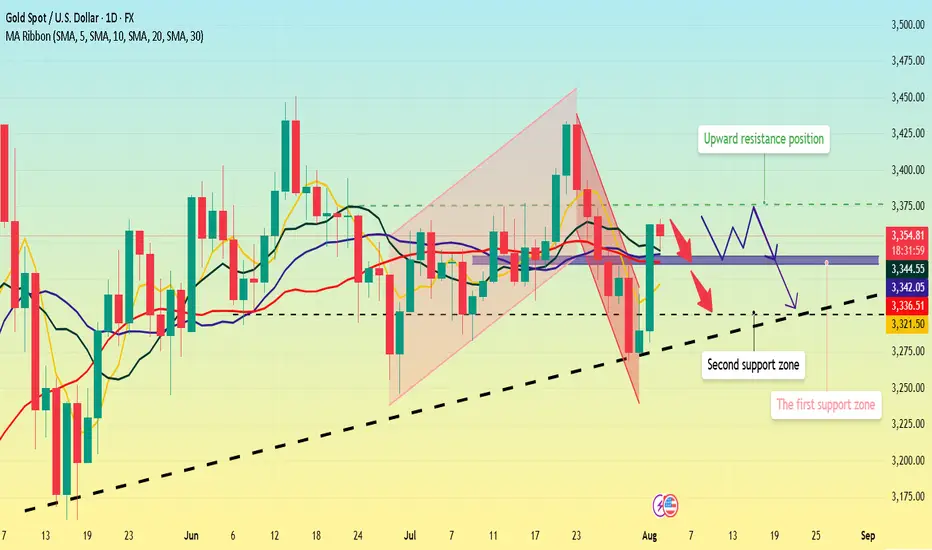
Gold prices have retreated slightly. Is there an opportunity to From the daily chart:
Gold prices haven't held above 3380, so the primary resistance level remains around 3385.
Currently, the daily moving average support is far from the high, with support below 3340-3360. While the daily trend remains bullish, the risk of a pullback and subsequent upward movement cannot be ruled out.
From the 1-hour chart, Quaid believes the price cannot fall below 3365. 3365 marked the opening high on Monday. Common sense suggests that if gold remains above 3365, it may remain at a high level for a short-term consolidation.
Thus, today's focus is on the key level of 3365. If the price doesn't fall below this level, consider going long at this level, waiting for a profit after another rally to the resistance range, and then shorting within the key resistance range.
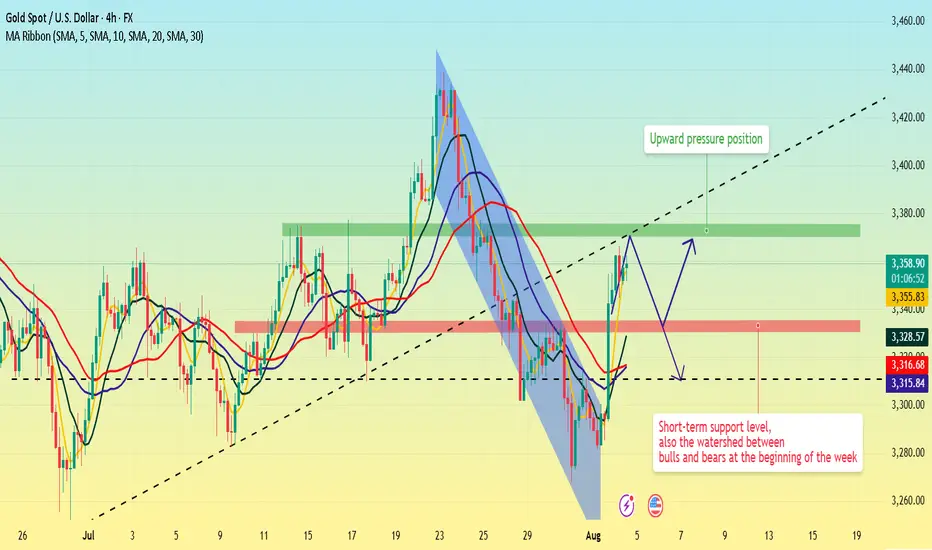
Gold is fluctuating at a high level. Latest analysis.On Monday, gold surged to around 3370 in the morning before retreating slightly. It fell back to support near $3345 in the European session. The dividing line between bulls and bears lies below 3340, which also marks the support level and the top-bottom reversal before the close of last Friday's non-farm payroll report.
Quaid planned to go long near 3340 on Monday, but the price rebounded to 3345, halting its decline and then fluctuating sideways, preventing an entry opportunity. However, a short opportunity near 3385 was successfully implemented with a slight pullback. Although it did not reach the expected target, a small profit was achieved after the pullback to 3370.
Monday showed an overall upward trend, with the closing price fluctuating at a high level, reaching a high around 3385 before retracing to confirm 3370. The overall market trend remains upward, with a temporary potential for a move to around $3400. Quaid recommends a buy-on-low strategy today. Currently, the 1-hour moving average is trending flat, and the trend of prices continuing to fluctuate at high levels cannot be ruled out.
Support for Tuesday's pullback lies near 3370. The key to a renewed rally lies at 3360, also the level of resistance before Monday's US market opening. As long as this level remains intact, the overall strategy remains unchanged. Alternatively, watch for a re-break of 3385, with upside targets at 3385-3390-3400.
Strategy:
Long at 3360-3365, stop-loss at 3355, profit range at 3380-3400;
Short at 3395-3400, stop-loss at 3410, profit range at 3370-3350;
Key Points:
First Support Level: 3370, Second Support Level: 3360, Third Support Level: 3350
First Resistance Level: 3385, Second Resistance Level: 3395, Third Resistance Level: 3405.

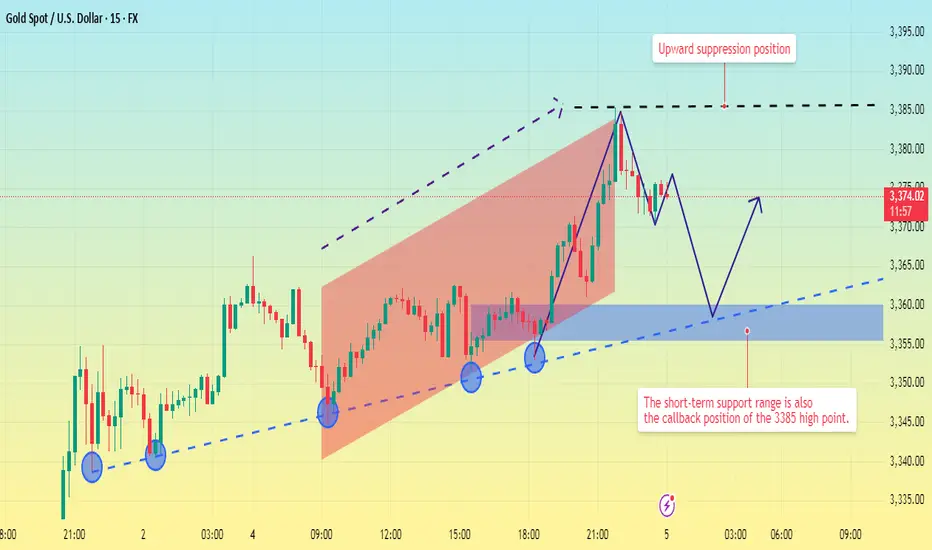
Upward movement suppressed. Price pullback?Gold prices have now perfectly reached the short-selling target range predicted by Quaid.
The current 4-hour chart clearly shows that gold's current resistance level remains around 3385.
Looking at the shorter 15-minute chart, gold has been slowly rising within an upward channel today. The resistance level of 3385 has not been effectively broken, and there is a high probability of a further pullback to test the 15-minute trendline.
Currently, 15-minute trendline support remains around 3355-3360. Focus on this support range in the short term, as it also represents a profit-taking opportunity after shorting at the 3385 high. This level can also be considered a watershed between bulls and bears. If the price pulls back to this level and does not continue to decline, there is a high probability of another upward move at this level.
However, if it falls below the 3350 trendline, the market will enter a downward trend.
Good luck to everyone in the new week.
Gold prices fluctuate. Bullish theme?From a technical perspective, gold prices have retraced above key moving averages, and the RSI has turned bullish. Short-term resistance for gold is near 3370. Can gold continue its sharp rise this week? Will there be a new rise? This depends on the performance of risk aversion in the market this week.
Quaid believes that 3330 is the watershed between bulls and bears at the beginning of the week. As long as the market is bullish, this level must not be broken. If it is broken, the gold trend will directly turn weak. Whether this week's daily moving average can continue to rise is key to triggering a bullish trend in gold.
From the 4-hour chart, pay attention to the range pressure position of 3370-3375 on the upper side, and the support on the lower side is around 3330-3335. If the price falls back at the beginning of the week, it can be bullish based on this position. The short-term bullish strong dividing line should pay attention to this range.
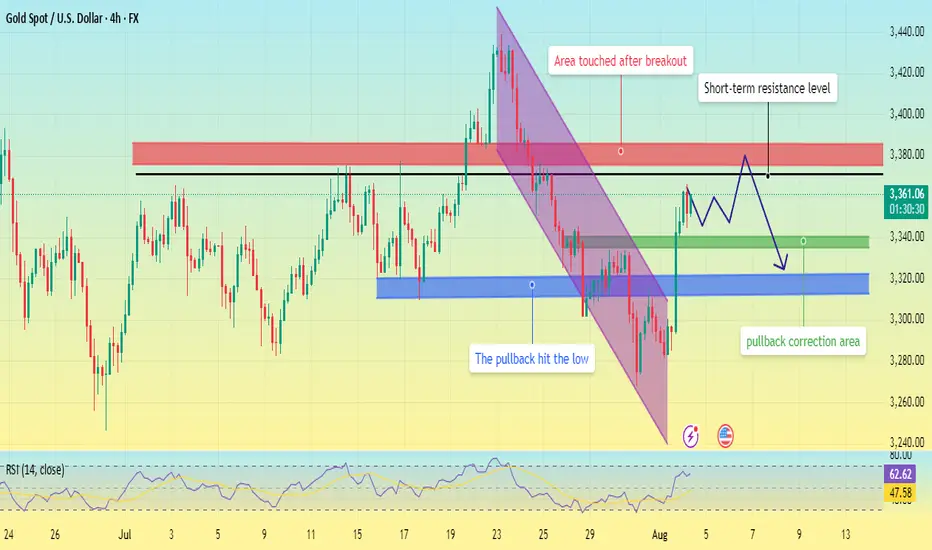
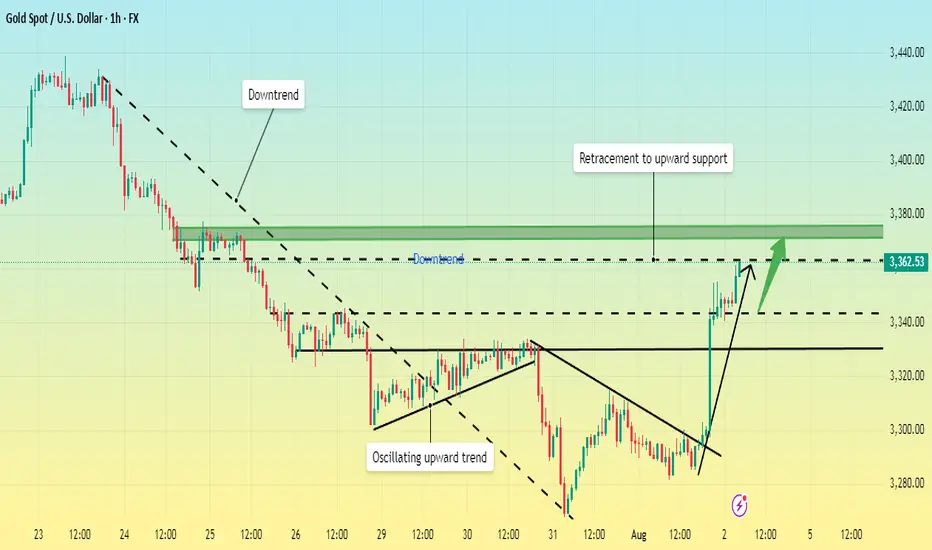
XAUUSD shows short-term bearish divergence.XAUUSD shows short-term bearish divergence.
On August 1 gold increased dramatically after the NFP report data came out. No wonder, recession risks generally drive XAUUSD higher due to increased safe-haven demand, a weaker dollar, and expectations of lower interest rates. Gold’s negative correlation with equities and its role as an inflation hedge make it a preferred asset during economic uncertainty.
However, on short-term timeframe, the bullion shows bearish divergence, the asset is to overbought and needs some downward correction in order to cool down a bit. Additionally, the price is retesting former trendline from below. The decline towards 3,300.00 is expected.

Will the bull market continue? A sense of crisis.Can gold continue last week's rally? Will it be another flash in the pan? In early Asian trading on Monday, gold rose to 3370 before falling slightly to around 3345 and currently fluctuating around 3360.
On Monday, focus on the 3340-3335 area. This was support before last Friday's rebound, and it also served as a key resistance level that has now become a support point. After last week's strong performance, don't rush into buying. Wait for a pullback to confirm the trend, or for an upward breakout in the European session before considering entering the market before the US market opens. In volatile markets, try to control the pace and avoid frequent in-and-out moves.
The 4-hour chart shows that gold is currently facing resistance near 3370, but this strong upward move is likely to correct in the European session, preparing for a subsequent secondary rally. This period has been range-bound, not a strong, one-way trend. Even if bullish, don't chase the market; wait for confirmation after a pullback before taking action.
Quaid believes that support today lies in the 3340-3335 range. A pullback near this area is a good opportunity to go long. The early Asian session's surge is a continuation of last Friday's bullish trend. The 3340-3335 area served as support before Friday's final rally and a key level for top-to-bottom reversals. If the price breaks through 3370 and stabilizes above it, it could potentially reach 3375-3385. However, after reaching the high, Quaid believes a pullback is highly likely, with a focus on the 3330-3310 area.
Trading Strategy:
Go long near 3330, stop-loss at 3320, and profit range at 3360-3370.
Short near 3375, stop-loss at 3385, and profit range at 3330-3320-3310.
Gold prices are fluctuating. Is a correction coming?Gold surged last Friday, directly breaking through multiple moving average resistance levels. This trend is quite strong. Currently, the 5-day moving average has turned upward, indicating short-term upward momentum; however, the 10-day moving average remains slightly downward, indicating some divergence in the short- and medium-term trends. The 20- and 30-day moving averages have flattened. Overall, the short-term moving averages are less reliable, making it difficult to clearly predict the precise short-term trend based on them.
Since mid-May, gold has been fluctuating widely at high levels. Within this trend pattern, continued monitoring of fluctuations within this broad range is warranted. Until a major trend breakout occurs, the overall approach should be to maintain a volatile outlook and avoid prematurely declaring a unilateral trend.
The upper resistance level is around 3375, which has been repeatedly suppressed during previous price fluctuations. Focus on support in the 3340-3335 area below. This marks the low point after last Friday's sharp rise. The market has stabilized in this area and continued its upward trend. If the decline is significant, the 3300 round-number resistance level will need to be monitored.
Trading strategy:
For aggressive trading, short around 3375 with a stop-loss at 3385 and a profit range of 3345-3335.
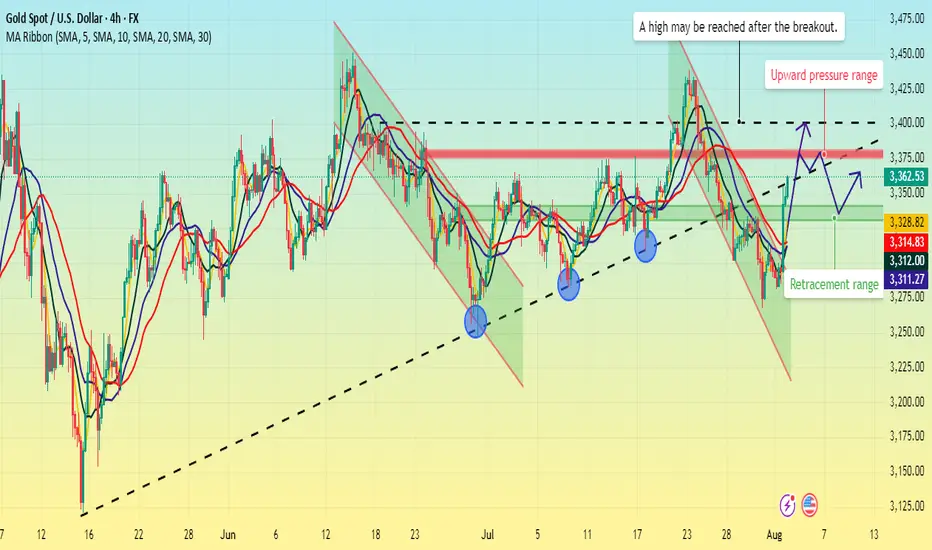
Interest rate cuts intensify. Will gold break out?No noteworthy news events occurred this weekend. So, we'll have to wait and see how the market interprets gold's trajectory at the start of next week.
From the 4-hour chart, the first thing we can confirm is that the 3363 level is unlikely to be the high point of this pullback. Because Friday's non-farm payroll report re-priced expectations for a rate cut, Friday's figures were merely a reaction from the US market. Furthermore, after hitting 3355, the price retreated slightly to 3340 before embarking on a second wave of gains.
The Asian and European markets were closed at the time, so when Monday opens, the Asian and European markets will likely also interpret expectations for a rate cut and the impact of the non-farm payroll data on the market.
Therefore, gold is likely to continue its upward trend next Monday. Currently, the first resistance level is around 3375-3380. It's uncertain whether this resistance can be overcome, but if it breaks through and stabilizes above 3380, it's likely to continue to move towards 3400.
On the other hand, if 3375-3380 holds strong resistance, a retest of Friday's retracement lows of 3330-3340 is possible.
Thus, avoid blindly shorting at the opening of next week. If the market retraces back to around 3330, then a long position is possible. If the market opens directly testing the upward pressure level, then do not chase the long position, as there is a possibility of a pullback at the pressure level.
Will prices stage a comeback? Continue their upward trend?Information Summary:
Market participants currently expect the Federal Reserve to cut interest rates twice before the end of the year, starting in September. Earlier this week, the Fed maintained interest rates at 4.25%-4.50%. Powell stated that it was too early to determine whether a September rate cut would occur, citing the need to monitor inflation and employment data.
Market Analysis:
Looking at the 4-hour and 1-hour charts, gold's Bollinger Bands are showing signs of opening upward after Friday's sharp rise. However, it's important to note that a surge-like top opening typically lacks sustainability, and the Bollinger Bands will close again after returning to technical levels. Currently, prices are trading above the upper band, which is not conducive to a direct rise.
The 1-hour chart shows a blunting of the moving averages, and the upper Bollinger Band is about to close. Overall, while gold is strong, it's not appropriate to be overly bullish. Focus on shorting opportunities next Monday, and then consider a bullish outlook after a price correction.
In the short term, focus on resistance in the 3375-3385 range above, and support in the 3345-3335 range below, followed by support near 3315.
Trading Strategy:
Short around 3365-3375, stop loss at 3385, profit range 3345-3335-3315;
Go long on a pullback to 3335-3340, stop loss at 3325, profit range 3350-3360;

Has a bull market started? In-depth analysis.Friday's non-farm payroll report was unexpectedly disappointing, sending gold soaring.
Data released by the U.S. Department of Labor on Friday showed that non-farm payrolls added only 73,000 jobs in July, far below market expectations of 100,000. The weak employment report quickly shifted market sentiment regarding the Federal Reserve's policy path. Market expectations for a September rate cut have soared to 75%, with another cut expected before the end of the year.
This shift has provided strong support for gold prices. Amidst persistent inflationary pressures and disappointing employment data, a Fed rate cut would be a substantial boon for gold.
Friday's data triggered a sharp rise in gold prices on the daily chart, reversing a week-long decline. This is the first sign of a pattern that breaks a weak downward trend. Following consecutive declines, the daily chart began to rise, directly reversing a week's losses. This pattern is likely to continue next week, forming a bullish pattern, with a potential second leg higher. Therefore, next week will be crucial for bullish sentiment, with key focus on whether it can break through the highs and the continuity of the bullish trend.
The bullish trend is likely to continue next week. It's also important to note that Friday's pullback to around 3340 marked an inflection point, a watershed between bulls and bears and a secondary bullish level. Since Friday's close was near resistance, it's important to watch whether the market will surge directly next week or retreat before rising again. If the rally isn't sustained in the early Asian session, a correction is likely to occur, accumulating upward momentum.
Is the uptrend complete? Will there be a pullback?On the last trading day of this week, gold prices soared, rising nearly $56, driven by the non-farm payroll data. The rally began at 3300 and peaked near 3356. The price has now retreated slightly, fluctuating around 3345.
The current uptrend has repeatedly tested the resistance level near 3355 but has failed to break through. The RSI indicator hovered around 76.8, indicating a gradual flattening of the upward trend. The 3355 high is likely the end of this uptrend.
As this is the last day of a major data week, Quaid believes the current uptrend is complete. Consider a light short position around 3350-3355. The current low has yet to be confirmed, and the pullback is likely to end around 3335.
However, we cannot rule out the possibility that the price will remain within the upward channel with slight fluctuations on the last trading day of the week.
