XAU/USD Chart Analysis: Price Retreats to Monthly LowXAU/USD Chart Analysis: Price Retreats to Monthly Low
In mid-June 2025, demand for gold surged following reports of exchanged strikes between Israel and Iran, along with US bombings of Iran's nuclear facilities. As a so-called safe-haven asset, gold prices climbed towards $3,430.
However, by the final day of June, the XAU/USD chart shows that gold had retreated to around $3,250, marking the lowest level in a month.
Why Is the Gold Price Falling?
On one hand, this reflects easing tensions in the Middle East, as a ceasefire—albeit fragile—between Israel and Iran remains in place.
On the other hand, the risk of trade wars is also diminishing. According to media reports:
→ President Donald Trump announced last week that the United States had signed a trade agreement with China and hinted that a “very major” deal with India would follow soon.
→ The US is also close to concluding agreements with Mexico and Vietnam, while negotiations with Japan and many other countries are ongoing.
Technical Analysis of the XAU/USD Chart
Looking at the broader picture, it is worth noting that gold prices in 2025 continue to move within a long-term upward channel (shown in blue), with the following key observations:
→ The channel’s median line acted as resistance (indicated by arrow 1);
→ The line dividing the lower half of the channel in half also showed signs of resistance (indicated by arrow 2).
Now, gold is trading near the lower boundary of the channel – a key support level within the multi-month uptrend. Demand may begin to strengthen here, with long lower wicks on candles on the lower timeframes supporting this view.
A rebound from the lower boundary is possible in early July, but how strong might it be? Note that bears have taken control of the $3,345 level (which has now flipped from support to resistance), and there are signs of a triple top pattern (A-B-C) forming near the $3,430 resistance. This raises the risk of a bearish breakout from the ascending channel.
This article represents the opinion of the Companies operating under the FXOpen brand only. It is not to be construed as an offer, solicitation, or recommendation with respect to products and services provided by the Companies operating under the FXOpen brand, nor is it to be considered financial advice.
Xauusdtrend

Market Analysis: Gold Drops — Traders Eye Macro TriggersMarket Analysis: Gold Drops — Traders Eye Macro Triggers
Gold price started a fresh decline below $3,320.
Important Takeaways for Gold Oil Price Analysis Today
- Gold price climbed higher toward the $3,400 zone before there was a sharp decline against the US Dollar.
- A key bearish trend line is forming with resistance near $3,300 on the hourly chart of gold at FXOpen.
Technical Analysis of Gold Price
On the hourly chart of Gold at FXOpen, the price climbed above the $3,320 resistance. The price even spiked above $3,350 before the bears appeared.
A high was formed near $3,395 before there was a fresh decline. There was a move below the $3,350 support level. The bears even pushed the price below the $3,300 support and the 50-hour simple moving average.
It tested the $3,245 zone. A low is formed near $3,247 and the price is now showing bearish signs. There was a minor recovery wave toward the 23.6% Fib retracement level of the downward move from the $3,393 swing high to the $3,247 low.
However, the bears are active below $3,300. Immediate resistance is near $3,280. The next major resistance is near the $3,300 zone. There is also a key bearish trend line forming with resistance near $3,300.
The main resistance could be $3,320 or the 50% Fib retracement level, above which the price could test the $3,350 resistance. The next major resistance is $3,395.
An upside break above the $3,395 resistance could send Gold price toward $3,420. Any more gains may perhaps set the pace for an increase toward the $3,450 level.
Initial support on the downside is near the $3,245 level. The first major support is near the $3,220 level. If there is a downside break below the $3,220 support, the price might decline further. In the stated case, the price might drop toward the $3,200 support.
This article represents the opinion of the Companies operating under the FXOpen brand only. It is not to be construed as an offer, solicitation, or recommendation with respect to products and services provided by the Companies operating under the FXOpen brand, nor is it to be considered financial advice.

Non-agricultural data is coming. Will it affect the market trendBecause there will be non-agricultural data next week, Quaid thinks that the market will not be in a hurry to perform at the beginning of the week. And Friday is the US Independence Day, and the market will be closed in advance; maybe only Wednesday and Thursday are really needed.
This week, gold closed below 3300, and the daily line was also broken, and gold officially entered a bearish trend.
First look at the monthly line chart
Because next Monday is the last day of June, the monthly line will start to close, so you can still pay attention to the support of the monthly line. The MA5 moving average below the monthly line is currently around 3170. Moreover, with the support of non-agricultural data next week, the possibility of touching around 3170 is not ruled out.
Secondly, from the weekly line chart
The weekly line is basically the same as the monthly line. The MA20 moving average below is also around 3170. So next week, I think we should focus on around 3170. The monthly line and the weekly line resonate, so the probability of touching this position is very high.
Finally, let's look at the daily chart. The daily chart shows a downward trend and the short-term support has been broken. The current support is around 3250. I think there is a high probability of a small sideways consolidation at the beginning of the week. If the market conditions are eager to change, it may rebound slightly and then continue to decline. If it falls below 3250, it will continue to fall towards 3200. If this level is broken, it may hit the low point of 3170-3175.

Gold’s Big Heist—Will You Join the Loot or Get Robbed?🔥 GOLD HEIST ALERT: XAU/USD Breakout Robbery Plan (Swing & Scalp Strategy) 🔥
🌟 Greetings, Money Makers & Market Robbers! 🌟
Ready to loot the gold market? 🏆💰 Based on Thief Trading Style analysis (technical + fundamental), here’s how we execute the heist on XAU/USD—escape with profits before the bears trap us!
📈 ENTRY: The Heist Begins!
"Break the Wall!" Wait for RESISTANCE (3370.00) to crack, then strike!
2 Ways to Rob:
✅ Buy Stop above Moving Average (breakout confirmation)
✅ Buy Limit near pullback zones (15m/30m recent swing lows)
Pro Tip: Set a chart alert 🚨—don’t miss the breakout!
🛑 STOP LOSS: Protect Your Loot!
"Yo, listen! If you’re buying after breakout, DO NOT set SL until price confirms!
Thief’s SL Rule: Place at recent swing low (4H timeframe)—adjust based on your risk & lot size.
Rebels, beware! 🔥 Your risk, your rules… but don’t cry if the market robs you back!
🎯 TARGET: Escape Like a Pro
Main Take Profit: 3480.00 (or exit early if the market turns shady!)
Scalpers: Only LONG plays! Use trailing SL to lock profits.
Swing Traders: Ride the trend & split the loot wisely! 💰
⚠️ WARNING: News = Market Chaos!
Avoid new trades during high-impact news.
Trailing stops = your best friend to protect profits.
💎 WHY THIS HEIST?
XAU/USD Trend: Neutral (but bullish potential! 🐂)
Key Drivers: Geopolitics, COT data, macro trends—do your homework! 🌍📰
🚀 BOOST THE HEIST!
Like this plan? Smash the Boost Button! 🔥 Helps us steal more profits & share next robbery targets! Stay tuned—more heists coming soon! 🎯🤝
🎉 Happy Trading, Thieves! May the market favor your loot! �💸

Gold has been falling continuously. Will it continue next week?Market review:
The conflict between Israel and Iran intensified, and gold surged in the early stage, and then continued to fluctuate downward. Affected by the situation in the Middle East and weak data from the United States, it fell severely in three trading days, and most of the other time periods were in the stage of repeated washing.
The first round of decline began at the high point of 3452. Affected by the situation in the Middle East, the price rose rapidly, but the rapid rise led to insufficient upward momentum, and the departure of buyers led to continuous declines in a single trading day. The second round of decline was affected by the easing of the conflict between Iran and Israel, and the US dollar, crude oil, and gold all plunged sharply; the third round of decline was Powell's wait-and-see attitude towards the interest rate cut policy, and some US data were bearish for gold, leading to a new round of decline.
Market outlook for next week:
The breaking of the key support bands of 3303 and 3295 means that the downward adjustment has not ended, but after touching the support near 3250, there was a clear bottoming out and recovery. It means that there is strong support below, and the focus of next week's opening is the emergence of price rebound. There were rebounds to varying degrees after the previous two rounds of decline, so this round of decline still needs to be paid attention to. The strategy mainly revolves around shorting on price rebound, with a focus on the upward suppression range of 3285-3310.
If the rebound is small, then at the beginning of next week, it is likely to maintain a small fluctuation in the range of 3270-3285.

The data is negative. Will the price rebound from the bottom?Gold prices have continued to fall since the high near 3450. This trading day started the downward mode near 3328, and the European session continued to fall, breaking a new low. The negative PCE data also continued the downward mode. So far, it has rebounded after hitting the lowest level near 3255. However, the rebound is small, and the upper pressure is still very strong.
From the 4-hour chart, short-term resistance focuses on the vicinity of 3295-3300, followed by important pressure near 3315. The short-term support below focuses on the vicinity of 3265-3270. The overall strategy of shorting at high positions remains unchanged based on this range.
Operation strategy:
Short at the price rebound near 3295, short covering at the high point of 3315, stop loss 3325, profit range 3370-3360.
At present, the price fluctuates greatly. If you want to try scalping transactions, you can trade with a light position and float up and down 5 points to stop loss or profit in time.
This is the last trading day of this week. I hope you all will gain something and have a happy weekend with your family.

Gold is weak. Can it continue?Gold is still fluctuating and falling slightly today. Gold is weak, so gold is likely to be short-term. If the price rebounds, it will be a short opportunity.
We need to pay attention to the release of US PCE data later.
From the 1-hour chart
the moving average continues to cross the short arrangement and diverge downward. After gold fell below the early support near 3340, it began to move downward weakly. The current upward pressure is around 3295-3310.
From the daily chart, the price is below the MA20 cycle and the 50 cycle, but remains above the 100 cycle. The technical indicators turned higher, but the momentum indicator is at a neutral level, and the RSI index is around 42.7, which does not point to an upward trend.
Since the upcoming data may have some impact on the price, the price may have a short-term high opportunity. Steady trading is still waiting for the price to rise and then short. Of course, if your trading strategy is more aggressive, you can use a long strategy before the price rises.
Operation suggestions:
Radical: Buy near 3280, stop loss at 3265, profit range 3305-3310.
Conservative: Wait for the price to rise and then bear pressure, sell near 3310, stop loss at 3320, profit range 3290-3285.

Gold breaks down. It may reach a low point.From the current market daily chart
The absolute support of gold is around 3280. Gold is basically in the process of maintaining this daily trend support line. Therefore, I personally think that around 3280 is a long-short dividing line for gold. If gold falls below 3280 on the daily line, it is very likely that the decline will just begin. On the contrary, be careful. If 3280 does not fall below, there is still a possibility of rebounding.
In the 4-hour chart, from the high point of 3450 to now, the 0.382 position is just around yesterday's high point of 3350. The 0.618 position is at 3325, and the final 100% position is around 3280. 3280 also coincides with the daily chart.
Therefore, gold must at least test around 3280 today, and it is not ruled out that there will be lower positions.

Gold is sideways. Is a new trend brewing?Information summary:
On June 23, Trump announced that Iran and Israel reached a comprehensive ceasefire, but the asymmetric terms of the agreement caused the conflict to continue. Israel launched another air strike on Iran, and Israel threatened to kill Iranian senior officials. The uncertainty of geopolitical risks continues to support gold prices.
Market analysis:
From the 4-hour chart, the MA5-day and 10-day moving averages show signs of upward divergence, and the K-line stands firm on the moving average support and fluctuates upward. In the short term, pay attention to the breakthrough and decline of the 3350 pressure level. The current market's downward momentum has weakened, and the overall market remains volatile. We need to be wary of the risk of short-term adjustments after continuous surges. Be alert to the short-term adjustment risks after continuous highs.
Operation strategy:
Short near the price rebound of 3345, stop loss 3355, profit range: 3330-3320.

Gold volatility intensifies. Waiting for direction?The price of gold fluctuated greatly this week, which means that the end point of sentiment will not disappear so easily for the time being; in the short-term K-line pattern, there are continuous ups and downs. If you want to trade steadily, you can wait and see for a while.
From the hourly chart, the MA5-day and 10-day moving averages cross downward, and the RS indicator hovers around 40.7. This shows that the market trend is weak. The current price has bottomed out near 3310 and rebounded to fluctuate around 3320. The price may continue to decline after a slight rebound.
Today, focus on the long opportunities near 3305 and the pressure position above 3345.
Quaid has always believed that only by insisting on detailed analysis of the market and reducing losses, can we slowly accumulate the principal of the account.
Good luck to everyone.
XAU/USD Bearish Bomb Ready to Explode? (Entry Levels Inside)🏦💰 GOLD HEIST ALERT: XAU/USD Bearish Raid in Progress! (Short Setup Inside) 💰🏦
🚨 Cops Waiting at Resistance? Here's How to Steal Pips & Escape Safely! 🚨
🦹♂️ ATTENTION ALL MARKET BANDITS!
To the Profit Pirates & Risk-Takers! 🌍💣
Using our 🔥Thief Trading Tactics🔥 (a lethal mix of liquidity grabs + institutional order flow + macro traps), we're executing a bearish gold heist on XAU/USD—this is not advice, just a strategic robbery plan for traders who play by their own rules.
📉 THE GOLD VAULT RAID (SHORT ENTRY PLAN)
🎯 Loot Zone: 3280.00 (or escape earlier if bulls fight back)
💣 High-Stakes Play: Neutral trend turning bearish - trap for late buyers
👮♂️ Cop Trap: Where bullish traders get arrested by resistance
🔪 ENTRY RULES:
"Heist Activated!" – Strike when price breaks 3340.00
Sell Stop Orders above MA OR Sell Limit on pullbacks (15-30min TF)
Aggressive? Enter at market but use tighter stops
📌 SET ALERTS! Don't miss the breakdown
🚨 STOP LOSS (Escape Plan):
Thief SL at 3390.00 (4H swing high)
⚠️ Warning: "Ignore this SL? Enjoy your margin call."
🎯 TARGETS:
Main Take-Profit: 3280.00
Scalpers: Ride the bear waves only
🔍 FUNDAMENTAL BACKUP (Why This Heist Works)
Before raiding, check:
✅ COT Data (Are big players dumping gold?)
✅ Real Yields (TIPS vs Gold correlation)
✅ Geopolitical Heat (Safe-haven flows drying up?)
✅ DXY Strength (Dollar crushing commodities?)
🚨 NEWS RISK WARNING
Avoid NFP/CPI/FOMC periods (unless you like volatility torture)
Trailing stops = your get-out-of-jail-free card
💎 BOOST THIS HEIST!
👍 Smash Like to fund our next raid!
🔁 Share to recruit more trading outlaws!
🤑 See you at the target, rebels!
⚖️ DISCLAIMER: For entertainment only. Trade at your own peril.
#XAUUSD #GoldTrading #TradingView #LiquidityGrab #ThiefTrading
💬 COMMENT: "Short already—or waiting for confirmation?" 👇🔥

XAUUSD Hello traders.
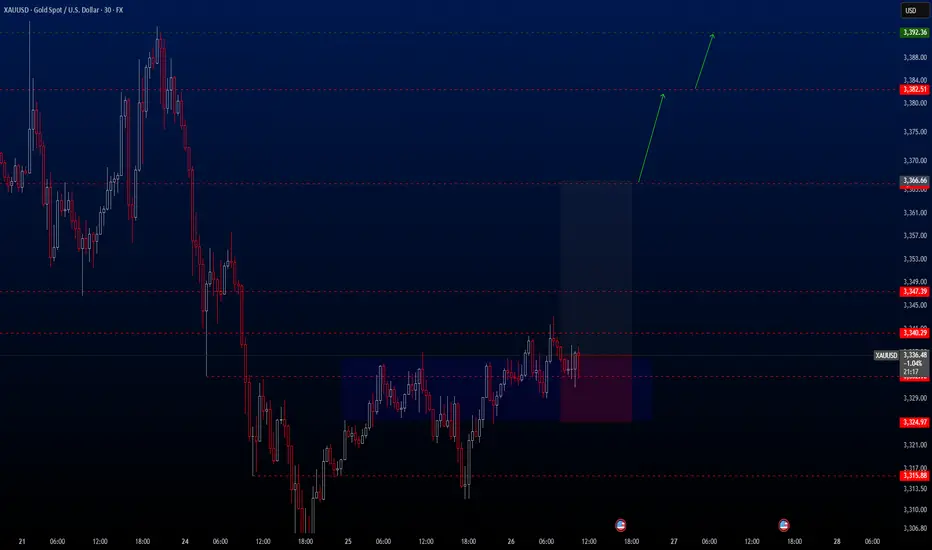
Today’s first trade setup comes from the XAUUSD pair. The pair is currently positioned in an ideal buy zone, and I’ve spotted a potential long opportunity. There are three different take profit levels, all of which are listed below. Personally, I’ll be closing my position at the first TP level: 3366.66.
However, keep in mind that two major economic events will be released today:
📌 Gross Domestic Product (GDP) (QoQ) – Q1
📌 Initial Jobless Claims
These are highly impactful events, so please manage your risk accordingly.
🔍 Trade Details
✔️ Timeframe: 30-Minute
✔️ Risk-to-Reward Ratio: 1:2.5
✔️ Trade Direction: Buy
✔️ Entry Price: 3336.62
✔️ Take Profit: 3366.67 / 3382.51 / 3392.36
✔️ Stop Loss: 3324.97
🕒 If momentum fades or the price consolidates within a tight range, I’ll keep this trade open only until 23:00 (UTC+4). After that, I’ll close it manually—whether in profit or loss—depending on how the price action evolves.
🔔 Disclaimer: This is not financial advice. I’m simply sharing a trade I’ve taken based on my personal trading system, strictly for educational and illustrative purposes.
📌 Interested in a systematic, data-driven trading approach?
💡 Follow the page and turn on notifications to stay updated on future trade setups and advanced market insights.
Gold continues to fluctuate. Waiting for a trend?Today, gold has been suppressed below the high of 3345, and the hourly line tends to be weak. Looking at the number of Yin and Yang lines on the hourly line during the fluctuation, we can see that the typical Yin line is continuous and the Yang line is few, plus the weak suppression of the previous day, from the rhythm point of view, it is a weak signal.
From the hourly chart, around 3312, this is the 0.618 position of the retracement of the 3295-3337 fluctuation range. The decline is slow during the day, and the 0.618 position has become a support rebound.
And the current trend, like the previous day, may continue to rebound and then fall. At the same time, there was no cyclical decline in the early Asian session. Instead, it fluctuated sideways, bottomed out and rebounded, and then continued to return to the high of the previous day.
Judging from the current market situation, the Asian market bottomed out and rebounded in the morning, reaching a high of around 3343, and then began to fall back, and is currently fluctuating around 3335.
The trend of the European session is very critical, and the focus is on the watershed below 3328. If this position falls below, the price will most likely continue to fall.
Operation strategy:
Short around 3340, stop loss 3350, profit range 3320-3310.

Gold may continue to rebound to 3350-3360If gold can stand above 3330 today, it will stimulate long trading behavior to a certain extent, especially the self-rescue behavior of trapped longs. Gold may continue to rebound and is expected to reach the 3345-3355 area. So there is no need to risk shorting gold near 3330 for the time being; although gold may continue to rebound, it is still under pressure in the 3350-3360-3370 area; and gold is still weak overall, so we can consider shorting gold in the 3350-3360 area and look at the target area of 3325-3315.
The Premium privilege of my account will end on June 26, and it will stop updating here from tomorrow. Friends in the channel have already made a lot of money by following my trading strategy. Friends who have not joined yet can join and receive the latest trading strategies and trading signals as soon as possible to escort your trading!

Short gold after reboundGold rebounded after touching 3312, and has now rebounded to 3330, but the rebound strength is far less than the decline strength, so the overall performance of gold is still weak. Because gold fell sharply yesterday, the market bullish confidence suffered a heavy blow, and there are many resistances above after gold fell and broke, and it is under pressure at 3340-3350 in the short term, and there is a technical gap above that suppresses the 3360-3370 area.
Therefore, before gold stabilizes in the 3360-3370 area, the short-selling force still has the upper hand, so we still focus on shorting gold in trading. We can consider shorting gold with the 3340-3350 area as resistance, and look at the target area of 3320-3310.
The Premium privilege of my account will end on June 26, and it will stop updating here from tomorrow. Friends in the channel have already made a lot of money by following my trading strategies. Friends who have not joined yet can join and receive the latest trading strategies and trading signals in the first time to protect your trading!

Gold fluctuates upward. Trend change?Yesterday, the gold daily line closed with a middle-yin candlestick with a lower shadow. The closing price has lost the middle and lower rail positions one after another, and the short-term downward pressure adjustment will continue.
The hourly level shows a bottoming out and rebound, and it rose in the early Asian session, breaking through the pressure resistance of 3328-3332 in the European and US sessions yesterday, but it did not continue the rebound and fell into a narrow range. At present, there is still great resistance above 3340, and it has failed to break through after many attempts, but the hourly line track has not been completely lost.
Pay attention to the 3315 support for long positions, and pay attention to the 3340-3355 short position range for upward movement. For the period of shock, strong support or resistance will inevitably produce inertial puncture behavior, and some errors are normal. We need to pay attention to the market trend at all times and change strategies in time.
Today we need to focus on the response strategies for resistance and support levels, which will determine whether we can achieve profits within the fluctuation range.
Good luck to everyone.

Gold fluctuates, 3300 may fall below.Gold fell to 3333 on Tuesday and then rose to around 3358, then began to fall slowly due to resistance, continued to fall in the European session, and fell to around 3295 in the US session, and rebounded in the late trading, rebounding to around 3325, and the daily line closed with a negative line with a lower shadow.
In addition, Israel and Iran both accused each other of violating the agreement, which brought uncertainty to the gold market.
After the sharp drop in gold last week, except for the correction of the cross positive line on Tuesday last week, the daily level has closed five consecutive negative lines since last Wednesday until now, fully demonstrating that the gold price has shown a weak feature of fluctuating downward in recent transactions.
From the technical indicators, the 5-day moving average and the 10-day moving average cross downward, which indicates an important signal that the market trend is weakening in the short term. The current gold price continues to run below the moving average, further verifying the current market situation where shorts dominate.
In terms of resistance, the 5-day moving average is currently around 3350, and the 10-day moving average is around 3370. These two price levels constitute the key resistance range in the upward process of gold prices. As long as the gold price fails to effectively break through this resistance band, it is likely to continue to be weak in the short term. At the support level, pay attention to the 60-day moving average around 3290.
Operation strategy:
Short gold rebounds around 3350, stop loss 3360, profit range 3320-3310.
Go long gold falls back to around 3295, stop loss 3285, profit range 3330-3340.
The market conditions are often not what we ideally want. This is the market, and it is also a form of trading practice.

Gold is under pressure. Will the trend change?Information summary:
The easing of tensions in the Middle East is the main reason for the suppression of gold. Risk aversion has weakened, and the market has entered a risk-taking mode. Gold prices are well supported near $3,300.
Powell released an important signal: The market expected Powell to strongly refute the possibility of a rate cut, but he remained on the sidelines. The market still generally believes that the July 29-30 meeting is unlikely to initiate a rate cut, and the first rate cut is expected to be in September.
Market analysis:
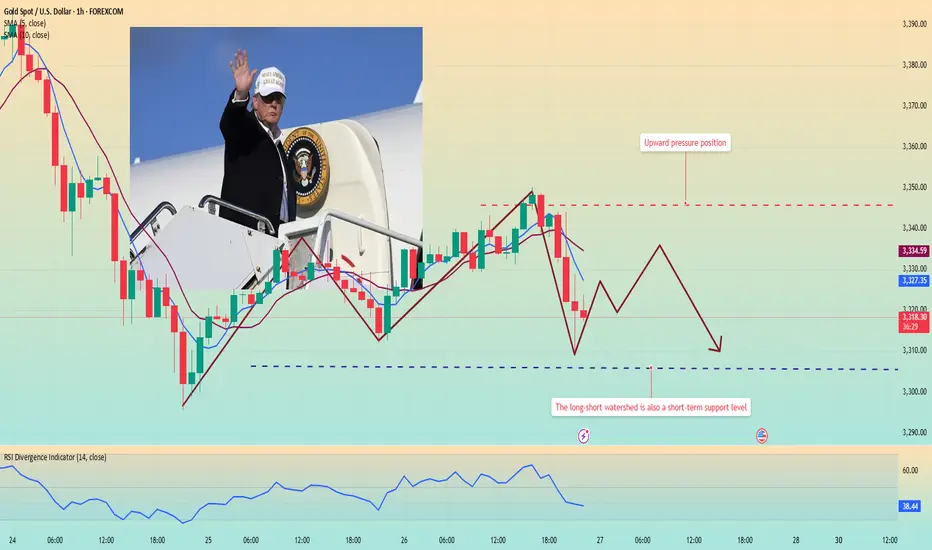
Gold has fallen for seven consecutive weeks, which has changed the current bull structure in stages, so there is no doubt that gold is expected to fall back as a whole. The early decline was near 3355, which is the current long-short watershed of gold. As long as the adjustment does not break through the 3355 position, the overall short-term adjustment pattern of gold will not change.
The early Asian market did not continue to retreat, but the short-term rebound had a long buying force accumulation, but as long as it did not break through 3355, the market trend was still weak, and it was adjusted by low-level shock correction. Today, there is a high probability of movement around the falling range. The short-term support below is around 3290. If this position is lost, it may touch the turning point around 3275.
Operation strategy:
Go long when the price falls back to around 3315, stop loss at 3305, and profit range 3345-3350.

The rebound is an opportunity to short goldAfter the ceasefire agreement between Iran and Israel and Powell's hawkish remarks that strongly refuted the possibility of a rate cut, gold fell sharply and hit a low near 3295. Although gold has rebounded, it is particularly difficult during the rebound process, which shows that the bulls are not willing to attack, and the rebound is only a technical repair of the decline.
Since gold fell below 3300 yesterday, the current bull structure has been changed in stages and the confidence of the bulls has been greatly weakened. As gold falls, it will be under pressure in the 3345-3355 area in the short term. Before gold breaks through this area, any rebound may give us an opportunity to short gold; in addition, after gold falls below 3300 once, in order to move downward and test support, gold has the need to retreat again.
So in the next short-term trading, we can try to use the 3345-3355 area as resistance, short gold appropriately, and look to the 3315-3305 area.

Dark moment for prices. Will it fall even lower?Information summary:
Due to the ceasefire in the 12-day war between Iran and Israel, market risk appetite has rebounded, demand for safe-haven assets has declined, and gold prices have plummeted. As an interest-free asset, gold prices are under pressure against the backdrop of declining risk aversion, but there is still buying support at low levels.
Investors are currently focusing on the speech of Federal Reserve Chairman Jerome Powell at a hearing of the House Financial Services Committee. Powell has been cautious about whether to cut interest rates in the near future.
Market analysis:
The current market selling sentiment has increased significantly, and for gold, falling has become the only path. It seems that the market has lost hope in gold, and the current gold price has fallen to around 3295, then rebounded slightly, and is currently fluctuating around 3313. The break of 3300 declares that gold still has further room to fall, and from the trend point of view, it is likely to continue to fall.
The current trend shows that the important support is around 3285. It is possible that it will fall directly to the current position. The Fed is still speaking, and it is unpredictable whether it will cause drastic fluctuations in gold in the future. However, from today's trend, shorting is the best solution at present, and the upper resistance position is in the range of 3315-3325.
Operation strategy:
Short around 3320, stop loss 3330, profit range 3290-3285.

Buy gold first, and short on gold after filling the gapGold is currently continuing to retreat, and the lowest has reached around 3333. Gold is quite weak, and the bears have completely taken the upper hand. The overall center of gravity of gold is shifting downward, and the short-term support below is 3330-3325. Once gold falls below this support area, gold may continue to fall to 3300, or even 3280; since gold has fallen to the 3340-3330 area, we cannot rush to short gold in the operation, because there is a technical gap above that needs to be filled, so gold still has a rebound to 3360-3370 in the short term.
Therefore, before gold falls below the short-term support of 3300-3325, we can appropriately consider going long on gold; after gold rebounds technically and fills the gap above, we can consider continuing to try to short gold in the 3360-3370 area.

Gold continues to decline, can it still change the trend?Information summary:
Will the Fed cut interest rates in July? The latest statements of Fed officials have released a heavy signal. Fed Governor Michelle Bowman said that as long as inflationary pressures remain moderate, she will support a rate cut at the next policy meeting in July. At the same time, Trump has continued to put pressure on the Fed.
Next, investors need to pay attention to the testimony of Fed Chairman Powell on the semi-annual monetary policy report to the House Financial Services Committee today.
Market analysis:
Gold fell sharply today, directly breaking the key support level of 3350. From a 4-hour perspective, the MA moving average shows a short trend arrangement, and the MA5\10 moving average crosses the MA20/30 long-term moving average downward, which indicates that the short force is dominant. In addition, the RSI indicator also fell rapidly and entered the oversold area, but this may also suggest that prices have a rebound trend in the short term.
I think the current market price decline trend is more obvious, unless there is significant positive data, the gold price may continue to decline.

Israel and Iran have a truce. Gold fluctuates sharply.Information summary:
Trump said on Truth Social that Israel and Iran have fully agreed and there will be a complete and thorough ceasefire. (About 6 hours from now, when Israel and Iran have finished and completed the last mission they are doing!).
After 12 hours, the war will be considered over. Iran will start a ceasefire first, and after the 12th hour, Israel will start a ceasefire, and 24 hours later, the world will salute the official end of this 12-day war.
Senior Iranian officials have confirmed that Tehran has agreed to a US-proposed ceasefire with Israel brokered by Qatar.
Market analysis:
From the current point of view of gold, the news market has been digested in the early Asian market, and gold has also fallen to around 3330. Now it is obvious that there may be a bottoming rebound.
But from the trend point of view, gold is still in the short position, and 3380 and 3400 have not been stabilized.
Judging from the current hourly chart, gold is likely to rebound to 3370-3380. Then it will quickly fall from this position to the early trading low of 3330. At the same time, we can also see that the trend near 3378 is at the Fibonacci 0.382 position. Moreover, the previous trend also rebounded from 3330 to 3380, and then fell back again.
So we need to be patient and wait for the price to rebound before going short. Of course, we can also choose an aggressive long strategy. Of course, we can also choose an aggressive long strategy.
Operation strategy:
Short near 3380, stop loss 3390, profit range 3350-3330.
Long near 3345, stop loss 3335, profit range 3370-3380.
