Is the gold price far from 3,400?Information summary:
The trade war is a continuous war, and it has just begun. During Trump's four years in office, trade conflicts will continue to occur. Trade conflicts are means, not ends. The goal of the United States is to transfuse blood to its own economy through trade negotiations.
In addition, US inflation fell to a historic low of 2.3% in April. The Federal Reserve has not cut interest rates on the grounds that inflation will rebound. The Federal Reserve can't hold on for long. Cutting interest rates is the only antidote to boost the economy, and it is also a special medicine.
Next, once the Federal Reserve releases the wind of interest rate cuts, the market's risk aversion will be ignited again. In June, 6 trillion US bonds will mature. Regardless of the result this time, market sentiment will be worried, which is the key to driving price fluctuations.
Market analysis:
The 1-hour gold price broke through yesterday's high of $3,320. The previous pressure formed a new top-bottom conversion position, and the strong market was only a small correction in the middle. There is no need to worry about whether it will peak, but there must be a standard for judging the peak; this standard is: breaking the support position before the last decline, and the second rebound does not set a new high.
Operation strategy:
Go long when the price falls back to around $3,330, stop loss at $3,320, and profit range at $3,365-3,380.
Xauusdtrend

My Learning and analysis on GOLD (XAUUSD)Hello Community,
I have shared everything as per my learning. Maybe, it is right or wrong. It doesn't matter have rough idea about Gold (XAUUSD). Please, Do not consider it's as your learning. I am beginner and just tracking my trading journey.
Have a Good Trading day ahead.
Comment down your thoughts below. Always inspired to learn.
Thanks.

Gold fluctuates, and the profit range is in this area
📌 Driving events
After a phone call with Trump yesterday, Russian President Vladimir Putin said that efforts to end the war in Ukraine are on track and Moscow is ready to work with Ukraine on a memorandum of understanding for a future peace agreement. The United States has begun serious trade negotiations with the European Union, which has slightly improved investor sentiment. These negotiations broke the long-standing deadlock and brought some hope for more deals after Washington signed a framework agreement with the United Kingdom earlier this month. Trump had previously said that he could also reach an agreement with India, Japan and South Korea, but the negotiations with Japan seemed to be deadlocked over the issue of automobile tariffs.
📊Commentary Analysis
Gold prices fluctuated narrowly throughout the day, mainly due to the weakening of the US dollar and safe-haven demand after Moody's downgraded the US government's credit rating.
💰Strategy Package
For intraday short-term operations, pay attention to the 3200 area for long opportunities and defend 3193. Pay attention to the 3235 area for short opportunities and defend 3242.
⭐️ Note: Labaron hopes that traders can properly manage their funds
- Choose the number of lots that matches your funds
- Profit is 4-7% of the fund account
- Stop loss is 1-3% of the fund account

Putin's phone call changed the market?
📌 Driving Events
Putin's "peace smoke bomb", gold is under short-term pressure
Just when gold was soaring due to risk aversion, a piece of news on Monday cooled the market instantly - after Putin and Trump talked on the phone, both sides released the signal that "Russia and Ukraine will soon ceasefire negotiations." Trump even announced loudly: "Russia and Ukraine will start ceasefire negotiations immediately!"
US President Trump said, "We will do everything we can to stop the conflict in Ukraine."
This news caused the market's risk appetite to rise briefly, and the gold price fell slightly to around $3,220 in the Asian market on Tuesday. But senior observers soon discovered that Putin's words were full of diplomatic rhetoric - he only said that the peace efforts were "on the right track" but did not promise a specific ceasefire time. Former Swedish Prime Minister Bilt pointed out: "This is Putin's victory. He successfully delayed the ceasefire pressure while continuing military operations."
Market truth: Geopolitical risks have not really subsided, and the safe-haven demand for gold is only a short respite.
📊Comment analysis
For investors, the question now is not "whether to buy gold", but "when to buy and how much to buy". At the moment when the global economic order is being reconstructed, the light of gold may have just begun to shine.
💰Strategy Package
Bullish breakout scenario: If the price breaks through the high of last Friday's rebound at $3,252 and continues to rise, you can go long with a light position near $3,260, targeting the $3,280-$3,290 range.
Bearish breakout scenario: If the price breaks below the key support level of $3,200 and further declines, you can go short near $3,190, targeting the $3,170-$3,160 range.
⭐️ Note: Labaron hopes that traders can properly manage their funds
- Choose a lot size that matches your funds
- Profit is 4-7% of the capital account
- Stop loss is 1-3% of the capital account

Gold fluctuates. Will it break through resistance and start to rWe analyzed the fundamentals and technical aspects comprehensively over the weekend, and the overall trend tends to be upward.
The Asian market opened, and the price rose to around $3,250 and fell back; in yesterday's analysis, I thought that the Asian market would rise rapidly after the opening due to the impact of the US sovereign credit rating. As I predicted, the opening in the morning quickly rose to the intraday high of $3,250, and then began to fall. Finally, it fell to $3,210 and strengthened again, and the trend was the same as my analysis.
From the current market, gold continues to fluctuate greatly. It is relatively strong at present, but it is suppressed by the $3,250-3,255 area. Therefore, it is expected that the price will continue to rise after adjustments below $3,250; if the price stabilizes above $3,210, there is still room for the price to rise. Below this, it will start a downtrend that could potentially hit last week’s cycle low of $3,150.
In the short term, we need to pay attention to the support level of $3225. If it breaks through the resistance level of $3250-55, it will open up room for growth. We will further pay attention to the high point of $3270-3290.
Until the price breaks through the upward resistance zone of $3250-3255 with a strong force, it is recommended not to adopt a long strategy.

Gold Price Targets Fresh GainsGold Price Targets Fresh Gains
Gold price started a fresh increase above the $3,210 resistance level.
Important Takeaways for Gold Price Analysis Today
- Gold price started a steady increase from the $3,120 zone against the US Dollar.
- A connecting bullish trend line is forming with support at $3,210 on the hourly chart of gold at FXOpen.
Gold Price Technical Analysis
On the hourly chart of Gold at FXOpen, the price found support near the $3,120 zone. The price formed a base and started a fresh increase above the $3,150 level.
The bulls cleared the $3,200 zone and the 50-hour simple moving average. There was also a spike above the 50% Fib retracement level of the downward move from the $3,347 swing high to the $3,120 low. The RSI is now above 50 and the price could aim for more gains.
Immediate resistance is near the 61.8% Fib retracement level of the downward move from the $3,347 swing high to the $3,120 low at $3,260.
The next major resistance is near the $3,295 level. An upside break above the $3,295 resistance could send Gold price toward $3,350. Any more gains may perhaps set the pace for an increase toward the $3,385 level.
Initial support on the downside is near the $3,210 zone. There is also a connecting bullish trend line forming with support at $3,210. If there is a downside break below the $3,210 support, the price might decline further.
In the stated case, the price might drop toward the $3,155 support. The next major support sits at $3,120. Any more losses might send the price toward the $3,060 level.
This article represents the opinion of the Companies operating under the FXOpen brand only. It is not to be construed as an offer, solicitation, or recommendation with respect to products and services provided by the Companies operating under the FXOpen brand, nor is it to be considered financial advice.

5/19 Gold Trading Signals🔍 Market Overview:
Last Friday, gold prices entered the 3176–3148 buy zone, and after the market opened today, prices rose to 3249, yielding substantial profits.
From a technical perspective, the overall trend is still under the pressure of a double-top pattern. In the short term, price action remains in a range, but the lows are gradually rising. However, indicators are not yet favorable for bulls. In this case, if the bulls want to take control, then the support at 3182–3176 becomes extremely important during any pullback.
🗞️ News Background:
Trump’s tax cut bill has been approved by a key committee in the U.S. House of Representatives.
👉 This week, further progress must be closely monitored as it directly impacts gold's safe-haven demand.
If trade tensions flare up again, gold is likely to rise sharply due to renewed safe-haven demand.
If tensions continue to ease, downward pressure on gold will likely increase.
Also, watch out for any comments on monetary policy — if rate cut expectations increase, gold could face additional downside risk.
📈 Today’s Trading Strategy:
🟢 Buy Zone: 3196 – 3176
🔴 Sell Zone: 3293 – 3318
🔄 Scalp/Flexible Trading Zones:
3188-3209-3236-3252-3269-3282

Gold is rising strongly? Beware of a sharp rise to the high poinThe US sovereign credit rating was downgraded from AAA to Aa1; affected by this, gold opened sharply higher in the Asian market on Monday, and the highest so far is around 3250.
However, 3250 is not the high point at present, and it is only warming up in the Asian market. The important thing should be in the European and American markets. Such a major breaking news must be seen in the US stock market.
If gold can continue to rush above 3250 in the short term, then we will see 3280-3300 later. It is not ruled out that the Asian market will continue to fluctuate sideways in the short term, but I think it will still rise. The high point of 3250 may be broken at any time.
From the 4-hour chart:
This K line is very strong. Once this K line closes above 3230, the highest high point can be seen from the 4-hour chart here.
Judging from the current trend, I think the gold price is bullish as long as it is above 3200 in the Asian market. The lowest price in the Asian market in the morning retreated to around 3210, so it is not known whether it will retreat to around 3200.
Then, for the short-term strategy, you can go long around 3210, with 3200 as the stop loss position. As long as the upper target stands at 3250, you can continue to see the profit range of 3280-3300.

Beware! Gold Falls
📌 World Situation
Gold prices fell more than 1.5% on Friday and are on track to close the week with a loss of more than 4% as improving risk sentiment drove investors away from safe-haven assets and into stocks and other riskier investments. At the time of writing, XAU/USD was trading around $3,187, retreating from a daily high of $3,252.
The precious metal started the week lower following a reported significant de-escalation in the US-China trade conflict, including an agreement by both sides to reduce tariffs by 115%. Despite trading between $3,120 and $3,265 throughout the week, gold prices struggled to maintain bullish momentum, with weakening buyer interest becoming increasingly apparent against the backdrop of stronger risk appetite and encouraging US economic data.
📊Comment Analysis
Will be greatly affected by tariff news and Russia-Ukraine peace talks
💰Strategy Package
Resistance: $3265, $3357
Support: $3160, $3112
In this range, you can enter the market in batches in real time to flexibly grasp the market changes.
⭐️ Note: Labaron hopes that traders can properly manage their funds
- Choose the number of lots that matches your funds
- Profit is 4-7% of the capital account
- Stop loss is 1-3% of the capital account

Moody's downgrades US credit rating, will gold be affected?Information summary:
At about 4:43 pm on Friday (the last minute before the market closed), Moody's downgraded the US sovereign credit rating from AAA to Aa1 on the grounds of "surge in debt and fiscal out of control", ending the US's last "top credit" title among the three major rating agencies.
Perhaps considering reducing the impact, Moody's announced this news after the US stock market closed. But at this time, gold, foreign exchange and other markets still have more than ten minutes of trading time. The 10-year US Treasury yield once rushed from 4.44% to 4.49%, the US dollar index fell, and gold rushed up.
The downgrade is a super-class data, which may cause gold to rebound in stages, but not continuously. If nothing unexpected happens, after the adjustment, gold may continue to retreat in a trend.
Technical analysis:
Next week, gold may rebound in stages to 3330-3340. Then there may be a trend decline again, and I estimate that it may test around 2950 below. As for why it went to 3330-40, here is an analysis:
I think the current gold trend is very similar to the holiday trend in Asia from May 1st to 5th. It also fell sharply, then bottomed out and rebounded, and then stretched up again. I also drew it in the picture, which is basically consistent with the current trend. If the next market trend is copied from the previous paragraph, then I think it should test the 3330-40 point.

Gold fluctuates greatly. What will happen next week?Gold fluctuated greatly on Thursday and Friday. It is difficult to implement an operation strategy in this market. It is difficult to go short or long. The market does not continue the next day, and there are few suitable trading opportunities in the process of changing the market. So what should gold do next week? Has the rhythm of gold changed again?
The rhythm of gold has changed rapidly recently, and next Monday is actually the key; the 1-hour moving average of gold has begun to show signs of turning, so whether it can form an upward trend is the next key.
The strength of gold on Monday is very important. Gold closed with a big positive line on Thursday, but it fell directly on Tuesday and pierced the support level, which cannot be said to be completely bullish. Although it rebounded slightly in the late trading, it still closed with a real big negative line.
Next week, we need to pay attention to two key positions. Pay attention to $3175 below. If it falls and breaks quickly after the opening on Monday, then gold will still be weak overall; pay attention to $3215 above. If gold breaks through this point strongly and stabilizes above the point, then gold will be strong overall.
If gold opens flat in early trading on Monday and the upward momentum is not strong, then you can continue to short in the short term.

Gold price rises and then sells off?Information summary:
Yesterday morning, gold prices soared due to the impact of international news, hitting an intraday high of $3,253.
On Friday, Asian time, gold suddenly fell rapidly in the short term, and the price of gold currently fell to around $3,215/ounce, a sharp drop of nearly $28 in the day.
Gold price targets higher, but the bullish potential is limited in the short term. The focus will be on the preliminary value of the University of Michigan Consumer Confidence Index in May.
Technical analysis:
Looking at the daily chart, gold prices rose on Thursday, but both the high and low points of the day moved down from the previous trading day. On the other hand, the 20-day moving average eased down to around $3,305/ounce, while the 100-day and 200-day moving averages maintained an upward tilt at a level far below the current gold price. Finally, the trend of technical indicators is upward, but it is still below the previous intraday high and in the negative range, which shows that buyer sentiment is not very high.
The short-term trend shows that gold buyers still lack full confidence.
You need to pay attention to the important support and resistance levels:
Support level: $3,200; $3,175; $3,160.
Resistance level: $3,230; $3,245.
Operation strategy:
Buy around $3,200, stop loss at $3,190, and profit range at $3,250-3,280.

Gold, false decline, real wash
📊Comment analysis
The recent surge and plunge of gold has also led to many different opinions on the market trend. If it rises, look at the ceiling, and if it falls, look at the floor. Most of them are such remarks, and the misleading nature of such remarks can be imagined. The first time I chased more at 3500, it was okay. After the beginning of the month, I soon got the opportunity to get out of the trap. But those who chased higher at 3400 twice last week were not so lucky. Opportunities cannot always be there, and not every time you can survive.
Once you have the idea of standing guard or holding on, it means you will lose. In the face of huge fluctuations in prices, short-term card points, and few positions can be grasped. You can't just rely on a rumor on the Internet to chase shorts and look at bear markets when prices fall, and chase longs and look at bull markets when prices rise. Investing and trading are two different things. Investment is a direction, focusing on large cycles, large directions, long-term, and profiting by time. Trading, on the other hand, makes money by rhythm and fluctuations, which are completely two concepts.
I have always said that the general direction is bullish and the rhythm is to get on board after every retracement. The transaction is divided into short, medium and long. The short-term is limited to intraday. Whether it is right or wrong, it is settled on the same day. The medium-term wave band, after each large retracement, insist on getting on board in batches, and leave after a phased rise. For the long-term, after each large retracement, build positions in batches and hold for a long time. First, make the logic clear, and then talk about the operation. We can't achieve the lowest or highest, but as long as we achieve a relatively low or high position, it will be fine.
The core of investment is the cycle, and the core of trading is the rhythm. If the rhythm is right, everything is right.
In the face of the sharp rise and fall of gold, first, don't hold a heavy position, and second, as long as it is not a relatively high or relatively low chasing order, there is no need to panic. First, if you hold a heavy position, first of all, you can't withstand the fluctuations, you can only bet on the win or loss of one order, and there will be no next chance. Secondly, as long as you chase long at high positions and short at low positions, even if you have a light position, you will not have a chance to get out of the trap, and you can only make up for the loss through new transactions. There is no other way, but to achieve unity of knowledge and action, and don't think about it. Heavy positions, plus chasing back and forth, plus the world lock, will only die faster and will not get out of the trap. Take care of yourself.
Let's talk about the market. First of all, the bull is still there. Secondly, the sharp drop and surge are wash-outs and adjustments, not the peak, but the base is large and the amplitude is large, so you have to reduce your position. At present, it is a large-scale range shock wash-out adjustment at the daily level, and a weekly level retracement, not the peak. It will be very clear if you look at the big cycle, and you must not listen to the rumors flying all over the sky. If it rises, chase high to see new highs, and if it falls, chase short to see new lows. It is not advisable. Again, remember one thing, grasp the relative highs and lows, let the wind and waves rise, and sit on the fishing boat steadily.
After the U.S. market plummeted, it directly reversed and surged. This kind of market will not continue. Don't chase it. Don't see the plummet and then the surge, and then shout that the bottom has been reached. The plummet means the peak, and the surge means the bottom has been reached. Isn't it a life-and-death situation every day?
The U.S. market directly talked about the next area. After the sell-off, gold rebounded sharply yesterday, which gave the trapped orders an opportunity to escape, not a direct reversal. Next, gold will enter a large range of shocks and washes with 3260 as resistance and 3150-3120 as support. After the shock, it will finally experience a wave of sell-offs and break the new low, and then it will bottom out. The bottoming logic is the same as the May Day period. Before May Day, gold continued to maintain above 3260 for washing. After May Day, it directly broke below 3260 and touched 3200 and then rose. Next, it will be the same. After a period of washing and shock, it will fall below the low of 3120 again, hit a new low and bottom out, and start to rise. The rhythm is like this, it depends entirely on courage, patience and technology, chasing ups and downs is not advisable. The rhythm is like this, watch more and do less, hold tight, and fasten your seat belts.
⭐️ Note: Labaron hopes that traders can properly manage their funds
- Choose the number of lots that matches your funds
- Profit is 4-7% of the capital account
- Stop loss is 1-3% of the capital account

Gold rebounded to the expected position, 3205 short!
📌 Driving Event
The announcement of a 90-day trade truce between the world's two largest economies also helped ease recession concerns in the United States, prompting investors to reduce expectations for aggressive monetary easing by the Federal Reserve (FED). This shift supports the continued rise in U.S. Treasury yields, further suppressing demand for interest-free gold.
📊 Commentary Analysis
Today, the price of gold fell to its lowest point in more than a month. It once hit the lowest level since April 10 at 3120, and then rebounded to the 3200 line, and the volatility increased again!
💰 Strategy Package
Short position:
Actively participate in 3200-3203 points, with a profit target around 3120 points
⭐️ Note: Labaron hopes that traders can properly manage their funds
- Choose a lot size that matches your funds
- Profit is 4-7% of the fund account
- Stop loss is 1-3% of the fund account

Gold Price Drops to Lowest Level in Over a MonthGold Price Drops to Lowest Level in Over a Month
As shown on the XAU/USD chart, the price of gold fell below $3,130 this morning – its lowest level since 10 April.
Since its peak in May, gold has lost more than 8% in value per ounce.
Why Is Gold Falling?
Bearish sentiment in the gold market may be fuelled by easing geopolitical tensions. According to media reports:
→ China and the US have already reported progress in reaching a trade agreement, while details of potential deals with India, Japan, and South Korea are currently being developed.
→ Iran is reportedly willing to sign a nuclear deal in exchange for the lifting of sanctions. In addition, Donald Trump may lift sanctions on Syria during his visit to the Middle East.
→ The situation between India and Pakistan has stabilised, and today, talks between Russia and Ukraine are expected to take place in Istanbul, with a potential ceasefire on the agenda.
These developments could be seen as reducing the appeal of gold as a safe-haven asset.
Technical Analysis of the XAU/USD Chart
In our 7 May gold price analysis, we:
→ outlined a descending channel (marked in red);
→ noted that bearish pressure persisted above $3,400.
Since then, the gold (XAU/USD) price has continued to move within this channel, breaking support around the $3,200 level and approaching a key support zone formed by:
→ the lower boundary of the red channel;
→ a long-term trendline (marked in blue);
→ a former resistance level (highlighted with arrows) at $3,140.
Given these conditions, traders should consider a scenario in which a minor rebound may occur – for instance, towards the median line of the red channel.
This article represents the opinion of the Companies operating under the FXOpen brand only. It is not to be construed as an offer, solicitation, or recommendation with respect to products and services provided by the Companies operating under the FXOpen brand, nor is it to be considered financial advice.

XAUUSD Analysis today: Unemployment spike? Hello traders, this is a complete multiple timeframe analysis of this pair. We see could find significant trading opportunities as per analysis upon price action confirmation we may take this trade. Smash the like button if you find value in this analysis and drop a comment if you have any questions or let me know which pair to cover in my next analysis.

Gold prices fell by more than $50. Two news will be released.At the end of the Asian session, gold accelerated its decline, with the lowest price falling to around $3,123, and plummeting more than $50 during the day.
Gold prices continued to fall in the Asian session and were under pressure from multiple factors. Optimism about Sino-US trade weakened gold's safe-haven effect. In addition, reduced bets on the Fed's rate cuts and rising US Treasury yields are also not conducive to gold prices.
There are two pieces of news to pay attention to in today's trading market.
1. At 8:30 a.m. US time, the U.S. Census Bureau will release April retail sales data.
2. At 8:40 a.m. US time, Federal Reserve Chairman Powell will deliver an opening speech at the second Thomas Laubach Research Conference. (This conference will focus on research on monetary policy and economics, and is expected to provide an academic perspective for the Fed's commitment to review the monetary policy framework every five years.)
Trading analysis:
Gold prices have just fallen below the $3,140 support level, which makes gold prices vulnerable. Some follow-up selling could push gold further towards $3,100; if it falls below this level, gold could target $3,060.
On the upside, if gold prices rise back above the $3,160-3,170 area, it could face strong resistance at the Asian session high and then $3,200.
Any further gains in gold prices could be seen as selling opportunities and could lose upward momentum around $3,230. This is a key level, and if it breaks through this level, a new round of short-covering could push gold prices up to $3,265 to form resistance before moving towards the $3,300 mark.
Market trading is risky, and I hope you will take profits in time; make a good profit.

Gold price plunges suddenly. Technical analysis.Information summary:
During the Asian session, gold prices suddenly plunged, and the price of gold has now hit a low of $3,148, down more than $44 from the intraday high of $3,192.78 hit earlier.
Gold prices continued to fall after breaking the $3,200 support I predicted earlier, and gold prices fell to a one-month low, continuing the recent decline.
The sharp reduction in tariffs between the United States and China has brought relief to global markets and led to a rebound, which has caused gold to correct and break through multiple technical levels.
Technical analysis:
In the short term, according to the 4-hour chart, the outlook for gold is bearish. Gold prices are trading below all of their moving averages, and the 20-period SMA has fallen below the 200-period SMA, which is located at $3,232, which will constitute an important resistance if the gold price trend recovers. Finally, technical indicators lack directional strength, but remain at negative levels, reflecting a lack of buying interest.
I think traders need to pay attention to the latest important support and upward resistance levels:
Support: $3140.
Resistance: $3100; $3215; $3232.

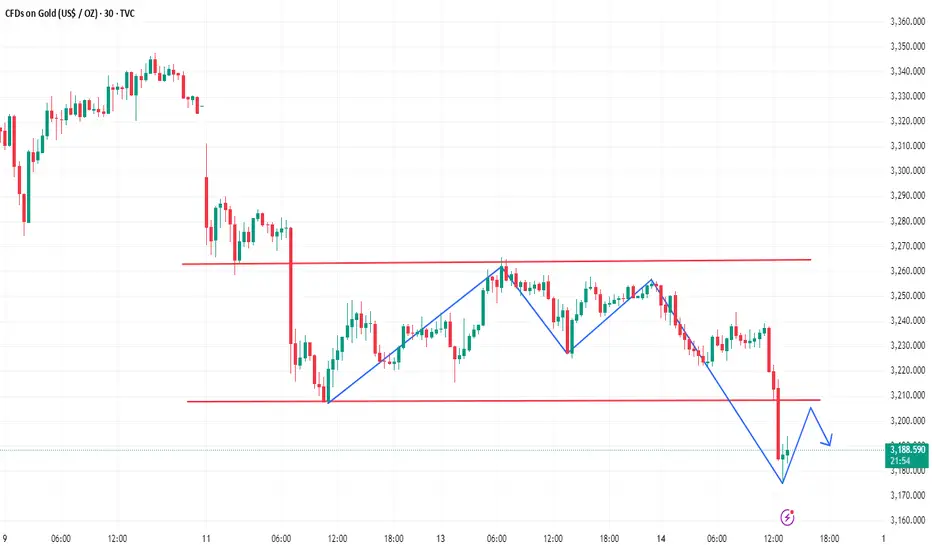
Gold fell. How is the market?Gold fell sharply at the opening today, and the lowest point hit $3175.
From the weekly line, this has already touched the weekly MA10 moving average position.
Quaid believes that traders should not blindly carry out short strategies. If there is a price rebound, the rise will be very fast, and the market may not give you a chance to stop loss.
From the 4H chart, we can see that gold has started a downward trend from last Friday's high of $3345. $3345-3307 is wave a. $3307-3360 is wave B. Currently, it is wave C from around $3360.
However, this wave C has not ended yet. If we look at it by standard, it will be considered the end of this trend only when it goes down to around $3120.
However, around $3175 is a support position. So now before it falls below $3175, gold may maintain a shock adjustment of $3200-3175.
I think you need to pay attention to the short-term resistance level of $3200-3250. If it cannot be as strong as breaking, then we can still carry out a short strategy below 3200.

Can we continue to bet against gold?My article today emphasized that gold may fall below 3200. Sure enough, it did so without hesitation today and fell to around 3175 in the short term. At present, gold has rebounded, and the short-term pressure is around 3200, so you can short at this position.
In the short term, focus on the support near 3160 below. If it falls below, there is still room for gold to fall.
Gold fell and then rose to $3,250. Next trend?News summary:
After two days of negotiations in Geneva, China and the United States announced that they would reduce tariffs on each other in the next three months: the US tariff on Chinese imports would be reduced from 145% to 30%, and China's tariff on US goods would be reduced from 125% to 10%. This news pushed global stock markets up.
Boosted by the agreement, market risk appetite has increased, investors' concerns about the US recession have eased, and expectations for the Fed's aggressive rate cuts this year have also declined accordingly, which has pushed the US dollar to continue to strengthen, and gold, as a traditional safe-haven asset, has come under pressure.
Technical analysis:
Gold prices fell below the 21-day moving average on Monday, when the average was at $3,313, further increasing downside risks. The 14-day relative strength index also fell below the midline for the first time since early April, sending a bearish signal. Buyers are trying to regain control of the situation.
Traders need to pay attention to the release of US CPI data.
I think if the US CPI data is higher than expected, gold prices may start a new round of decline, with the target being $3,145 near the 50-day moving average. The important support level below is $3,100.
On the contrary, if the CPI data is lower than expected, gold prices are expected to re-enter the 21-day SMA, which is currently $3,311. Once this resistance is broken, it will test the trend line resistance at $3,430. If it breaks further, the trend will open up space for gold prices to hit the historical high of $3,500.

Gold 3200 Life and Death Battle!Gold stabilized after touching the support of the 3193-3202 rising trend line. Although the US market rebounded, it did not form an effective breakthrough. In the short term, it is still dominated by shorts.
Short-term strategy:
Before 3200 is broken, you can go long on dips. If it falls below, stop the loss decisively, and use a small stop loss to game the potential bull reversal. Whether the 3250 pressure is broken or not determines the short-term direction

Tariff easing has just begun
📌 Driving factors
The historic easing of tariffs between China and the United States, the imminent peace talks between Russia and Ukraine, the ceasefire between India and Pakistan, and the market's pricing of geopolitical risks have obviously cooled down, which has further shrunk the demand for gold as a regional safe-haven tool. The situation in the Middle East is complicated, and it is necessary to monitor the latest developments in real time, focus on the latest developments in the follow-up news, and adjust strategies in real time.
📊Comment analysis
In the Asian session, gold is concerned about the upper resistance at $3,250 today. The rebound relies on the resistance below to continue shorting. The lower point is $3,207. If it falls below, it will be $3,150. For specific operations, please pay attention to the free channel.
💰Strategy Package
Long position:
Actively participate at 3200 points, with a profit target of around 3230 points
Short position:
Actively participate at around 3245 points, with a profit target of around 3220 points
Labaron believes
Guaranteeing the principal is the bottom line for survival, controlling risks is the armor for survival, earning profits is a stage medal, and long-term stable and continuous profits are the only proof of being able to stand up from the mountains of corpses and seas of blood.
