The gold strategy is correct, enter the market at key points.Gold clearly treated the wide range of fluctuations, and the strategy was basically realized! In the real market, I also arranged short orders at 3345 and 35, and took profit at 3313-14! I continued to arrange long orders at 3302, and finally successfully reached the profit target of 3315! The overall harvest was good.
Analysis of gold trend:
On Tuesday (April 29) in the Asian market, spot gold fluctuated in a narrow range and is currently trading at $3337.58/ounce. Gold prices reversed their decline on Monday and rose. Earlier, they fell to around $3268, but then there was a low-absorption buying, and gold prices closed at $3343.91/ounce; the dollar fell across the board on Monday, which also provided support for gold prices. Investors cautiously waited for further news on US trade policies and prepared for a week of intensive economic data, which may initially indicate whether US President Trump's trade war is having an impact.
From a technical perspective, gold prices reversed their decline on Monday and rose. Gold repeatedly tested the 3260-3270 area for support. Gold has formed a multiple bottom structure in the short term, so gold may end its short-term adjustment. This time, gold has already adjusted, and it is unlikely to adjust again. Therefore, as long as it does not break the 3260 low in the near future, gold will rise and there will be room for growth. As for the high point, there are two dividing points, one is the 3337 high point, breaking 3337 is a strong shock, and the other is the 3370 high point, breaking 3370 is absolutely strong, then, the upper space is opened, and then look at 3420-3500.
From the daily chart, the daily line forms three bottoms at 3260, and the daily line closes positively, and the bullish trend is obvious. As long as the daily line is positive, it will not be able to go to the upper track or the previous high is just around the corner. The 4-hour cycle is also absolutely strong after Monday's rise, but now the unilateral rising mode of the Bollinger opening has not yet formed, and the gains and losses of 3370 will be tested here. Therefore, if the bullish long position continues on Tuesday, it must pay attention to whether 3370 breaks. If 3370 breaks, there will be a strong unilateral rising space. If 3370 does not break, it will still be a large range of fluctuations. Then, the only thing to consider during the day is to adjust the long position. Today, the lower support is around 3300-3310, and the upper pressure is around 3350-3360.
Xauusdupdate

CADCHF BULLISH OR BEARISH DETAILED ANALYSISCADCHF is currently trading around 0.59 and is showing a strong bullish wave setup on the 8H chart. Price has bounced cleanly from a key demand zone, with a visible bullish engulfing structure, suggesting buyers are stepping in aggressively. My target for this setup is 0.61, aligning with a previous major resistance level seen on the chart.
Fundamentally, CAD is supported by firm oil prices and hawkish sentiment from the Bank of Canada, while CHF has been under mild pressure due to reduced demand for safe-haven assets amid improving global sentiment. This macro backdrop favors CAD strength in the near term, adding fuel to the bullish technicals.
If the current momentum sustains, we could see a smooth continuation toward 0.61, with a favorable risk-reward ratio. As always, trade management and patience are key, especially as the pair approaches resistance. I remain bullish on CADCHF in the short term, based on both structure and fundamentals.

Gold prices bottomed out and rebounded, market trend analysis.Analysis of gold trend: From the perspective of market sentiment, interest-free gold as a safe-haven asset has performed strongly this year, with prices soaring by nearly $700 and hitting record highs several times. However, the recent optimistic expectations of easing global economic and trade relations have boosted market risk appetite, and the equity market has generally performed positively. Some funds have flowed out of safe-haven assets such as gold and turned to risky assets, which is also the main psychological factor under pressure on gold prices. If market risk appetite continues to improve, global economic and trade relations further ease, and the US dollar strengthens, gold prices may face greater downward pressure. From a technical point of view, the gold price needs to effectively fall below the $3,265-3,260 range in the short term before a larger correction downward may be confirmed. Once confirmed to fall below, the gold price may quickly fall to the 50% retracement level near $3,225, further pointing to the $3,200 mark. If $3,200 is lost, it will suggest that gold may have peaked in the short term.
Gold opened higher in the Asian session on Monday and continued to fall last week after hitting 3336. The idea of the Asian session was to directly bearish at the analysis point of 3277. After hitting the lowest point of 3268, it fluctuated upward. The European session also fell to 3273 and then rebounded. The highest point in the US session just reached 3336 again, a standard bottoming and rebounding trend. Since it is an adjustment structure, let's re-analyze the idea. The gold price fell at 3500 and rebounded at 3260 last Wednesday. The rhythm was volatile. It rebounded above 3260 many times below and did not cross the first rebound high of 3367 above.
Today, we mainly focus on the closing price. If it stands firmly at the 3313 line, we will adjust our thinking on Tuesday. On the contrary, it will fall back after encountering resistance at 3336, today's opening high, and go to 3278. On Tuesday, we will continue to look at the idea of swinging and falling. Now it is the end of the market, and the market is also falling from a high.

Gold bulls are not strong enoughGold has begun to form an inverted V reversal pattern in the 1-hour moving average. If the 1-hour moving average of gold begins to turn, then gold may have a deep adjustment. If there is no strong risk-averse news for gold, then adjustments are inevitable. Gold is at least volatile in the short term. Don’t chase too much easily. Pay attention to the pressure near 3450.
Trading idea: short gold near 3446, stop loss 3456, target 3426

GOLD New 2 Scenarios Available , Which One You Prefer ? Here is my opinion on Gold right now , after my last 2 posts on It , now i see the price need to go down a little to make any correction and i think this will happen tomorrow , so if we have a 4h Closure below my Support , we can sell it at least for 300 pips , and if we have not , then we can buy it but i prefer to sell it before buy it again , just follow the price action and then you can take you decision .
This Is An Educational + Analytic Content That Will Teach Why And How To Enter A Trade
Make Sure You Watch The Price Action Closely In Each Analysis As This Is A Very Important Part Of Our Method
Disclaimer : This Analysis Can Change At Anytime Without Notice And It Is Only For The Purpose Of Assisting Traders To Make Independent Investments Decisions.

Gold Third Scenario , Depend On Breakout , What`s Your Opinion ?Here is the update for the last idea i post for Gold , if we take a look now we will see that he price moving in sideway and still not touch my support , so do yo uthink the price will go up without retest it ? or should we keep the first analysis ?

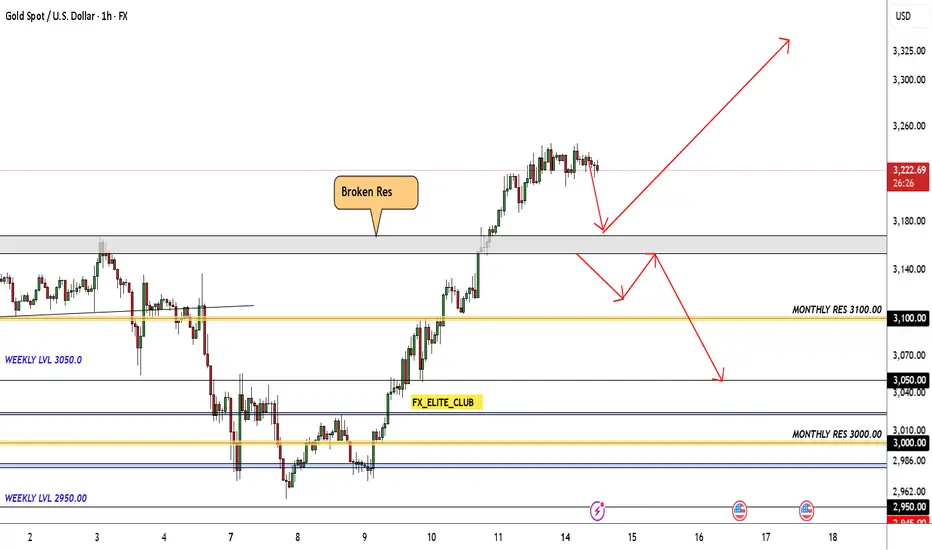
GOLD 2 Excepted Scenarios Very Clear , Which One You Prefer ? Here is my opinion on GOLD Chart , the price broke the highest Res , and continue to upside , so i think we have 2 ways in this pair right now , if the price go back to retest the broken res area and give us a good bullish Price Action we can enter a buy trade with smal lot size cuz the price at very high price , and if we have a clear closure below it , we can enter a sell trade with 500 pips target .
GOLD (XAU/USD) Hits ATH – Discover the Market EdgeHi Guys,
I’ve been testing my edge for the past 5 months, and it’s been crazy what I’ve discovered so far. It might sound a little wild, but there’s a way to compare another market that leads 3–5 days ahead and gives clear trend signals for Gold Futures — which moves in tandem with XAU/USD, with only a few dollars' difference.
You can see a pullback here, but sometimes it shoots straight to an all-time high. Taking current geopolitics into consideration, the markets are extremely volatile. Before Trump started the trade wars, I opened an account with 1:500 leverage (starting capital $150, grew to $500) and made significant profits just by catching the moves and trends I was able to predict.
From a math standpoint, if it were just coincidence, I would’ve been liquidated a long time ago. I’ve been through everything — this isn’t luck. I remember one day, I was watching Bloomberg live and the news anchor said, “I can’t believe gold is dropping,” — but I had predicted that move days earlier, haha! That was triple confirmation that I have an edge and that algorithms are actually following it.
There were also days when I expected a small pullback the next day, but it happened during the NY session because of some news — and it couldn’t push lower. Sellers in the TradingView chat was going crazy. The next day, during the London session, it started reaching the ATH (as I predicted). The pressure was intense, but the algorithm didn’t allow it to go lower than the previous low — and that structure came from my leading market edge!
In this case, the pullback might not happen — and if it doesn’t, we’ll break the current ATH and easily go long after that. As I mentioned, in these volatile markets, with tariffs going back and forth, the buying pressure and constant news are so intense that the market sometimes doesn’t even have time to make a pullback! If you have good capital and trade with low leverage, you can easily go long now and keep adding to your position with every pullback until we hit the new ATH!
Now, gold is going to reach a new ATH again — that’s 110%. I believe we’ll easily hit $3200+, followed by a pullback to around $3100.
Next gold move:
ATH: $3200 – $3350
Pullback: ~$3100
Re-test of ATH area — consolidation in that zone until the next major news event.

GOLD At Interesting Res Area , Should We Sell Now Or Wait ?Here is my GOLD Chart and this si 1H Time Frame , i`m looking to sell it if i have a bearish price action to confirm that the price will go down , i think the price will go up a little to make some wicks and take all stop losses before going down again maybe tomorrow, so i think we will see some stop hunts before the price going going down for 500 pips and then move again to upside very hard .

Market Update (No Buy/Sell Bias)🧠 Structural Recap: Why Gold Did What It Did
🔄 Mitigation & Reaction Zones Review
✅ Premium Supply Zone @ 3144–3160 (H1-H4)
— Price tapped into this key premium area and sharply rejected it. This indicates a successful mitigation of that supply zone.
— This zone previously aligned with the weak high and premium structure, adding to its weight.
🟦 Mid-Range FVGs @ 3120–3130 (H1)
— This area acted as the bounce point today after price wicked down aggressively.
— The strong wick from 3086–3144 confirms buyer interest post-news, filling imbalance and mitigating prior demand (on H1).
🟫 Mitigated Demand Zone @ 3086–3096 (H1-H4)
— This demand zone was pierced and fully tapped. We saw a textbook bounce with strong reaction, suggesting the zone is now mitigated.
— A notable EQ + strong candle from this zone created bullish displacement.
🔵 Unmitigated Discount Demand @ 3054–3080 (H4)
— This remains a key untouched demand. Price wicked close to it but didn’t tap.
— If we get another push down, this is still valid and unmitigated.
🧱 Below 3050: Unmitigated Macro Zone (D1)
— The large OB/FVG combo around 2970–3030 still hasn’t been mitigated. This remains untouched liquidity in a deeper pullback.
📰 News Review — April 3, 2025
Trump’s Conference Commentary
— Hawkish rhetoric around economic strategy but no clear monetary focus.
— Mixed signals caused initial DXY strength, but later market corrected.
US Jobless Claims & ISM Services PMI
— Slightly worse-than-expected numbers, showing cooling economy signs.
— This supported XAU recovery post-drop as rate hike sentiment weakened.
Geopolitical Noise (Middle East)
— Continued tensions are keeping safe-haven demand intact, especially below 3100.
🧠 TL;DR
Zones like 3144–3160 and 3086–3096 are now mitigated.
3054–3080 and 2970–3030 remain unmitigated, future bounce areas.
Today’s volatility was news-driven, but liquidity still sits lower.
We’re currently in mid-mitigation flow, with the market respecting PA zones well.

Why XAUUSD is Bullish ?? Detailed analysis XAU/USD currently trading at approximately $3,030, forming a bullish pennant pattern—a continuation signal that typically precedes further upward movement. This pattern emerges after a strong price surge, followed by consolidation marked by converging trendlines. A breakout above the pennant's upper boundary could propel gold prices toward the target of $3,100, aligning with the prevailing bullish trend
Fundamental factors support this optimistic outlook. Recent geopolitical tensions and concerns over escalating inflation have heightened demand for gold as a safe-haven asset. Additionally, the Federal Reserve's dovish stance, including potential interest rate cuts, has weakened the U.S. dollar, making gold more attractive to investors. These elements collectively contribute to the bullish sentiment surrounding gold.
Technical indicators further reinforce this perspective. Gold has recently surpassed the significant $3,000 threshold, reaching new all-time highs. The formation of the bullish pennant suggests a continuation of this upward momentum. Key support levels to monitor include $2,961 to $2,965, while resistance is anticipated around $3,021 to $3,030. A decisive break above these resistance levels could confirm the pennant breakout, paving the way toward the $3,100 target.
Traders should exercise prudent risk management strategies, such as setting appropriate stop-loss orders, to navigate potential market volatility. Staying informed about upcoming economic data releases and central bank communications will also be crucial in effectively capitalizing on this trading opportunity.

GOLD Finally Gave Bearish P.A , Short Setup Ready For You !Here is my opinion on Gold , and now the price closed below my support , and i`m waiting the price to retest it to enter a sell trade to take this 500 pips .
This Is An Educational + Analytic Content That Will Teach Why And How To Enter A Trade
Make Sure You Watch The Price Action Closely In Each Analysis As This Is A Very Important Part Of Our Method
Disclaimer : This Analysis Can Change At Anytime Without Notice And It Is Only For The Purpose Of Assisting Traders To Make Independent Investments Decisions.

Why GBPJPY is Bullish?? Detailed technical and fundamentalsThe GBP/JPY pair has recently confirmed a bullish reversal by breaking out of a falling wedge pattern, aligning with our earlier analysis. Currently trading at 194.000, the pair is on track toward our target of 199.000.
Technically, the breakout from the falling wedge—a pattern typically indicative of bullish reversals—suggests increased buying momentum. This is further supported by the pair's ability to maintain levels above key resistance points, now acting as support. The next significant resistance is anticipated around the 195.000 level, a psychological barrier that, if surpassed, could pave the way toward our 199.000 target.
Fundamentally, the British pound has been bolstered by positive economic indicators, including robust GDP growth and a resilient labor market, enhancing investor confidence. Conversely, the Japanese yen has experienced depreciation due to the Bank of Japan's commitment to ultra-loose monetary policies, aiming to stimulate inflation and economic growth. This monetary policy divergence has contributed to the upward trajectory of GBP/JPY.
In conclusion, the confluence of technical and fundamental factors supports a bullish outlook for GBP/JPY. Traders should monitor upcoming economic releases and central bank communications, as these could impact market sentiment and price action. Maintaining a disciplined approach with appropriate risk management strategies is essential as the pair approaches the 199.000 target.

GOLD What Next? SELL!
My dear followers,
This is my opinion on the GOLD next move:
The asset is approaching an important pivot point 2919.2
Bias - Bearish
Safe Stop Loss -2926.5
Technical Indicators: Supper Trend generates a clear short signal while Pivot Point HL is currently determining the overall Bearish trend of the market.
Goal -2904.2
About Used Indicators:
For more efficient signals, super-trend is used in combination with other indicators like Pivot Points.
———————————
WISH YOU ALL LUCK

Why GOLD IS BULLISH? DETAILED TECHNICAL AND FUNDAMENTALSXAUUSD is currently trading at $2,920, forming a bullish flag pattern—a classic continuation signal indicating potential upward momentum. The target price is set at $3,000, suggesting an anticipated gain of 80 pips upon a successful breakout.
A bullish flag pattern typically consists of a strong upward price movement (the flagpole) followed by a consolidation phase where prices move slightly downward or sideways within parallel lines (the flag). This pattern often precedes a continuation of the prior uptrend once the price breaks above the flag's resistance. In this scenario, a confirmed breakout above the flag's upper boundary could propel XAUUSD toward the $3,000 target.
Fundamentally, gold prices have been bolstered by ongoing global economic uncertainties and trade tensions, leading investors to seek safe-haven assets. Recent market analyses indicate that geopolitical developments and policies are expected to influence gold prices in 2025, with XAUUSD potentially finding support around the $2,500 level. citeturn0search1 Additionally, forecasts suggest that XAUUSD could reach a high of $2,912.14 in March 2025, with an average price around $2,855.32.
In conclusion, the formation of a bullish flag pattern in XAUUSD, coupled with supportive fundamental factors, indicates a potential upward move toward the $3,000 target. Traders should monitor key resistance levels and await confirmation of a breakout to capitalize on this opportunity.

USDCHF Bullish Flag: Breakout Potential Toward 0.92USDCHF is currently trading at 0.899 and forming a bullish flag pattern, signaling a potential breakout toward the 0.92 target. The bullish flag is a strong continuation pattern that occurs after a sharp upward move, followed by a consolidation phase. If the price successfully breaks above the flag’s resistance, it could trigger a new bullish wave, driving USDCHF higher.
Technically, the bullish flag suggests that buyers are accumulating positions before the next breakout. A confirmed breakout above the flag’s upper trendline, with increased volume, could validate the uptrend. Traders should watch key resistance zones and look for strong bullish candlestick formations to confirm the breakout momentum toward 0.92.
On the fundamental side, the US dollar remains strong due to the Federal Reserve’s stance on interest rates. If economic data from the US continues to show resilience, the dollar could gain further strength against the Swiss franc. Additionally, the Swiss National Bank’s (SNB) monetary policy stance, which has remained relatively dovish, could contribute to CHF weakness, supporting the bullish outlook for USDCHF.
In summary, USDCHF is currently consolidating within a bullish flag, preparing for a potential breakout toward 0.92. A strong move above resistance, combined with bullish fundamentals, could accelerate the upside momentum. Traders should keep an eye on US economic data and risk sentiment to confirm the trade setup.

NZDUSD Cup Pattern: Bullish Breakout Targeting 0.60NZDUSD is currently trading at 0.57 and forming a classic cup pattern, signaling a potential bullish continuation toward the 0.60 target. The cup pattern is a well-known technical formation that typically indicates a period of accumulation, followed by a breakout to the upside. If the price breaks above the resistance level at the cup’s rim, it could trigger strong buying momentum, pushing NZDUSD higher.
From a technical standpoint, the cup pattern suggests that the market has undergone a correction and is now regaining strength. A confirmed breakout above the neckline would validate the bullish setup, with 0.60 as the next major resistance level. Traders should watch for increasing volume and bullish candlestick confirmations to strengthen the breakout scenario.
Fundamentally, the New Zealand dollar’s movement depends on risk sentiment, US economic data, and Reserve Bank of New Zealand (RBNZ) policies. If the US dollar weakens due to expectations of Federal Reserve rate cuts or softer economic data, NZDUSD could gain additional upside momentum. Additionally, any hawkish signals from the RBNZ regarding inflation and interest rates could further support the bullish outlook.
In summary, NZDUSD is forming a bullish cup pattern, with a potential breakout targeting 0.60. A strong breakout above the resistance could accelerate the bullish move, supported by both technical patterns and fundamental factors. Traders should monitor global risk sentiment, US dollar trends, and RBNZ statements to confirm the momentum shift.

GOLD Giving Amazing Bearish P.A , 500 Pips Waiting For Us !This Is An Educational + Analytic Content That Will Teach Why And How To Enter A Trade
Make Sure You Watch The Price Action Closely In Each Analysis As This Is A Very Important Part Of Our Method
Disclaimer : This Analysis Can Change At Anytime Without Notice And It Is Only For The Purpose Of Assisting Traders To Make Independent Investments Decisions.

XAU/USD 13 February 2025 Intraday AnalysisH4 Analysis:
-> Swing: Bullish.
-> Internal: Bullish.
Analysis and bias remains the same as analysis dated 11 February 2025.
As mentioned in yesterday's analysis dated 10 February 2025 that it is highly likely price will print a bullish iBOS is how price printed.
Price is currently trading within an internal low and fractal high.
ChoCH positioning to indicate, but not confirm bearish pullback phase initiation is denoted with a blue dotted line.
Intraday Expectation:
Price to continue bearish and react at either discount of internal 50%, or H4 demand zone, before targeting weak internal high, priced at 2,942.780.
Alternative scenario:
Given HTF (Daily and Weekly) have also printed bullish iBOS' it would not come as a surprise if price printed a bearish iBOS.
Note:
With the Federal Reserve's dovish stance and persisting geopolitical uncertainties, heightened volatility in Gold is expected to continue. Traders should proceed with caution and adjust risk management strategies in this high-volatility environment.
Price could also be driven by President Trump's policies, geopolitical moves and economic decisions which are sparking uncertainty.
H4 Chart:
M15 Analysis:
-> Swing: Bullish.
-> Internal: Bullish.
Analysis and bias remains the same as analysis dated 11 February 2025.
Price printed as per yesterday's analysis whereby it was mentioned price to print bearish CHoCH to indicate bearish pullback phase initiation.
Price is now trading within an established internal range.
Intraday Expectation:
Price to trade down to either discount of 50% internal EQ or nested H4/M15 demand zone before targeting weak internal high priced at 2,942.780.
Alternative Scenario:
As all HTF's are in bearish pullback phase it would be viable if price targeted strong internal low, printing a bearish iBOS.
Note:
With the Federal Reserve maintaining a dovish stance and ongoing geopolitical tensions, volatility in Gold prices is expected to remain elevated. Traders should exercise caution, adjust risk management strategies, and stay prepared for potential price whipsaws in this high-volatility environment.
M15 Chart:

XAU/USD 27-31 January 2025 Weekly AnalysisWeekly Analysis:
Swing Structure -> Bullish.
Internal Structure -> Bullish.
Analysis/Bias remains the same as analysis dated 01 December 2024.
Price Action Analysis:
In my analysis dated 27 October 2024, it was noted that the first sign of a pullback would be a bearish Change of Character (CHoCH), indicated by a blue dotted line. Price's consistent upward momentum had positioned this CHoCH much closer to recent price levels as expected for weeks.
Now, for the first time since 23 November 2020, price has printed a bearish CHoCH. We are currently trading within a defined internal range.
Price is anticipated to trade down towards either the discount of the internal 50% Equilibrium (EQ), highlighted in blue, or the Weekly demand zone before targeting the weak internal high.
Note:
It is highly unlikely price will "crash" as many analysts are predicting. My view is this is merely a corrective wave of the primary trend.
Given the Federal Reserve's dovish policy stance alongside heightened geopolitical risks, market volatility is likely to remain elevated, influencing intraday price swings.
Weekly Chart:
Daily Analysis:
-> Swing -> Bullish.
-> Internal -> Bullish.
Analysis/Bias remains the same as analysis dated 01 December 2024
Price Action Analysis:
Price has shown a reaction from discount of internal 50% EQ. Currently price has been unable to target the weak internal high
Given the current internal range dynamics, price is expected to target weak internal high, priced at 2,790.170 However, considering the signs of a pullback phase on the Weekly timeframe, there remains a possibility of price printing a bearish Internal Break of Structure (iBOS). Price has yet to tap into Daily demand.
Note:
With the Fed maintaining a dovish policy stance and the continued rise in geopolitical tensions, we should anticipate elevated market volatility, which may impact both intraday and longer-term price action.
Daily Chart:
H4 Analysis:
-> Swing: Bearish.
-> Internal: Bullish.
Analysis and bias remains the same as analysis dated 21 January 2025, however, CHoCH positioning has changed, bringing it closer to current price action.
Previous analysis has been met. Following price printing bearish CHoCH, price has printed a further bullish iBOS. This has significantly narrowed the internal range.
Price did not trade into either discount of 50% or H4 demand zone before targeting weak internal high, however, on this occasion I will remain systematic in my approach and revisit later.
Intraday Expectation:
Price to print bearish CHoCH to indicate, but not confirm bearish pullback phase initiation. Bearish CHoCH positioning is denoted with s blue dotted line.
It would be useful to remember that Daily TF swing and internal range are bullish.
Note:
With the Federal Reserve's dovish stance and persisting geopolitical uncertainties, heightened volatility in Gold is expected to continue. Traders should proceed with caution and adjust risk management strategies in this high-volatility environment.
H4 Chart:https://www.tradingview.com/x/tPRFgn8w/

The Highest Place To Sell Gold And Get 500 Pips Very Clear !Now the price are moving to upside without any correction , so i`m waiting the price at the highest place we can sell from it , it was a very good res area and it forced the price to go down very hard , so it`s my fav and last place to sell gold and i`m targeting 500 pips target at least !
This Is An Educational + Analytic Content That Will Teach Why And How To Enter A Trade
Make Sure You Watch The Price Action Closely In Each Analysis As This Is A Very Important Part Of Our Method
Disclaimer : This Analysis Can Change At Anytime Without Notice And It Is Only For The Purpose Of Assisting Traders To Make Independent Investments Decisions.

Gold Giving Amazing Bearish P.A , Short Valid To Get 500 Pips !We Have a very good bearish price action as i mentioned in the chart , and we have a very good touch for the trend line , also we have a very good rejection area , i`m targeting 500 pips in this setup , i will wait the price to go up a little before enter a sell trade to make my sl not too much .
This Is An Educational + Analytic Content That Will Teach Why And How To Enter A Trade
Make Sure You Watch The Price Action Closely In Each Analysis As This Is A Very Important Part Of Our Method
Disclaimer : This Analysis Can Change At Anytime Without Notice And It Is Only For The Purpose Of Assisting Traders To Make Independent Investments Decisions.

XAU/USD 05 December 2024 Intraday AnalysisH4 Analysis:
-> Swing: Bearish.
-> Internal: Bullish.
Bias/analysis remains the same as analysis dated 25 November 2024.
Price Action Analysis:
As mentioned in yesterday's analysis dated 24 November 2024, whereby price was expected to print a bearish CHoCH. This is how price printed.
Currently, price is trading within an established internal range.
Intraday Expectation:
Price is anticipated to trade down to either discount of internal 50% EQ, which is marked in blue, or H4 demand zone before targeting weak internal high priced at 2,721.420.
Note:
With the Federal Reserve's dovish stance and persisting geopolitical uncertainties, heightened volatility in Gold is expected to continue. Traders should proceed with caution and adjust risk management strategies in this high-volatility environment.
H4 Chart:
M15 Analysis:
-> Swing: Bearish.
-> Internal: Bearish.
Today's analysis and bias will remain the same as analysis dated 26 November 2024.
Price Action Analysis:
Intraday expectation and analysis dated 25 November 2024 printed as anticipated, with price successfully printing a bearish iBOS after targeting the weak internal low.
A correction from yesterday's intraday expectation: instead of targeting the weak internal high, price was expected to target the weak internal low.
Price has since printed a bullish CHoCH, indicating, but not confirming, bullish pullback phase. We are now trading within an established internal range.
Intraday Expectation:
Price is anticipated to trade up to either the internal 50% EQ or the M15 supply zone before targeting the weak internal low at 2,605.310.
Alternative Scenario:
The H4 timeframe has printed a bearish CHoCH, indicating the initiation of a bearish pullback phase coupled with the fact that H4 TF is now trading in discount of internal 50%. However, this suggests that bearish momentum on M15 may face limitations as the broader H4 phase unfolds.
Note:
Given the Federal Reserve's dovish stance and persistent geopolitical tensions, volatility in Gold prices is likely to remain elevated. Traders should remain cautious and prepared for potential price whipsaws in this high-volatility environment.
M15 Chart:
